Three pains developers face daily
Site screening burns time
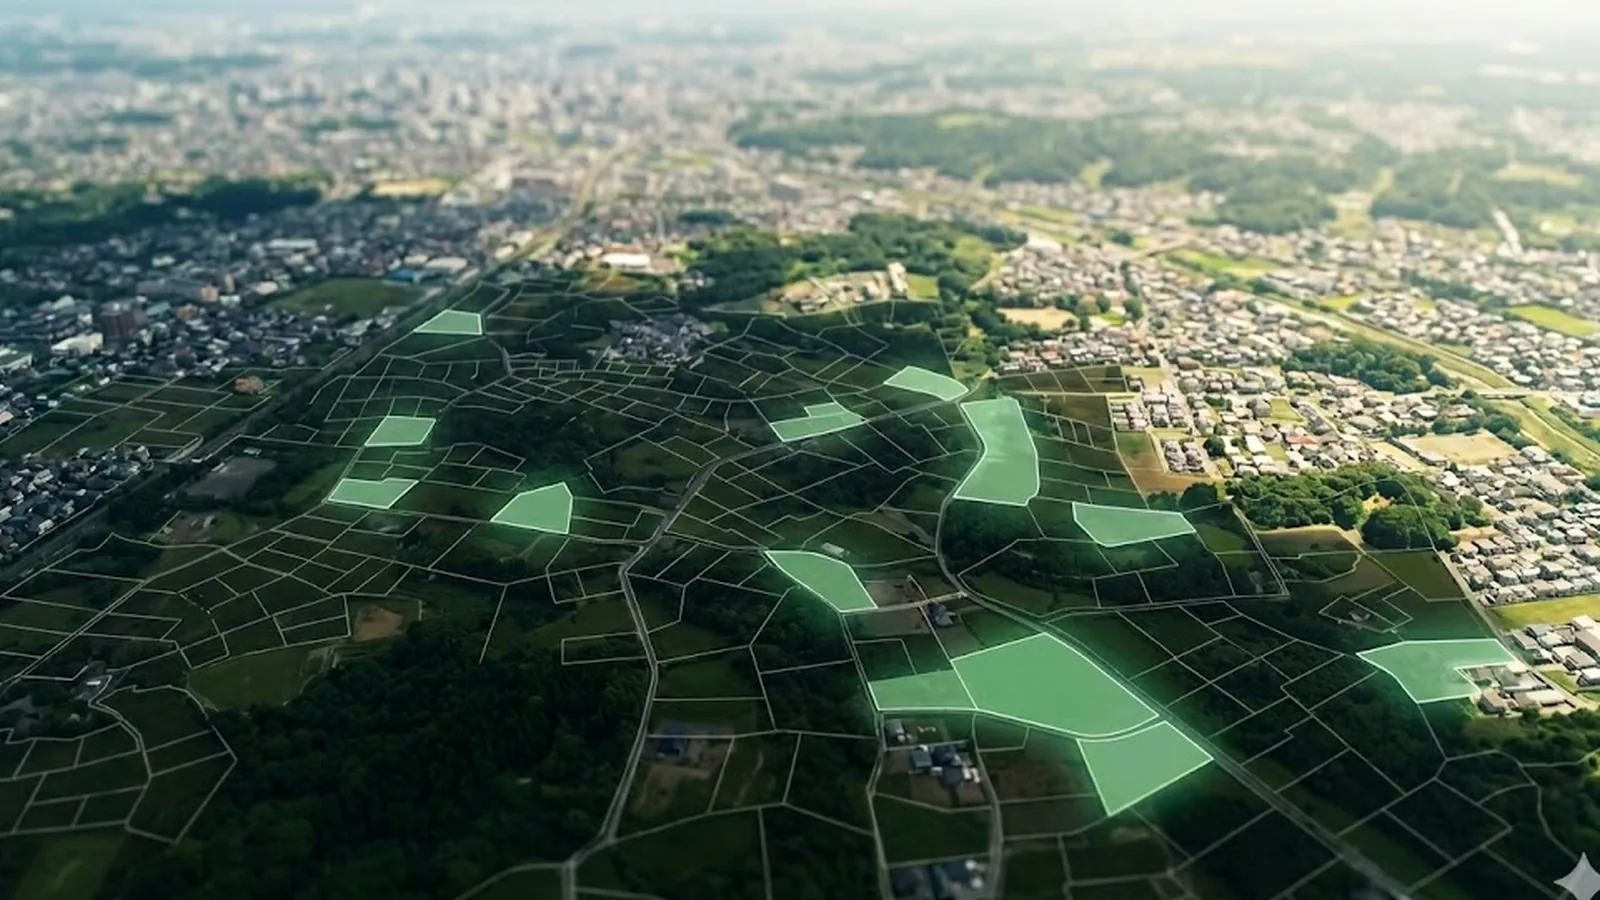
Checking zoning, hazard, and land-price for each candidate one by one across multiple portals — 100 sites take a week. During that window, competitors can lock up the best ones. With MAPRISE's AND filter, 50 sites finish in a single day.
Volume checks take two weeks
Engaging an architect, confirming zoning and frontage-road widths, calculating FAR — the full loop runs 2 weeks to 1 month. You can't evaluate parallel candidates in that window.
Three days lost to regulation cross-checks
Zoning, agricultural promotion zones, forestry law, farmland law, height-control districts, urban-planning roads — overlapping the regulations manually consumes half a day to a full day per site, before any other work begins.
What changes after MAPRISE
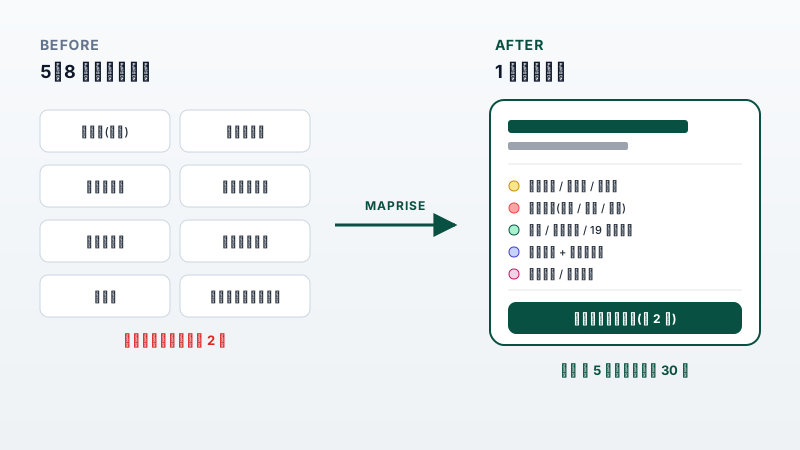
| Scenario | Before | After (MAPRISE) |
|---|---|---|
| Site screening | Check 100 sites one by one across portals (1 week +) | AND filter narrows down instantly — 50 sites in a day |
| Volume check | Engage an architect, wait 2 weeks – 1 month | Estimate FAR, BCR, and frontage-road adjustment instantly |
| Regulation crosscheck | Check zoning / agricultural / forestry / planning roads separately (1 day +) | All regulation layers on one screen; overlap analysis in minutes |
| Catchment / market analysis | Outsource market research, several hundred thousand yen, weeks | In-house with population projections, facilities, and comparables |
| Cross-department sharing | Paste maps into PowerPoint, print, circulate | A share URL — every department sees the same live map (planned) |
The Before / After above shows the workflow improvements MAPRISE aims to deliver (estimates); actual results vary by environment and usage.
Regulation, hazard, land-price, and population checks — all on a single MAPRISE screen
Four capabilities for land sourcing
AND filter & bulk screening
Combine zoning, hazard risk, land-price band, future-population deltas, FAR, and outside-of-agricultural-zone with AND logic for instant screening. A shortlist of 50 sites within the same day.
Instant volume check
Zoning, BCR, FAR, frontage-road width, height-control — combined to estimate total floor area on the spot. Compresses the pre-architect screening phase substantially.
Catchment & population analysis
Population, projections, surrounding facilities, transaction comparables, and transit access within a radius of up to 3 km — analysed instantly. Bring catchment analysis in-house, end the outsourcing dependency.
Real-time cross-department sharing (planned)
A planned capability: distribute candidate maps and analysis as share URLs. Acquisition, design, sales, and executives all see the same live map — approvals move faster.
A reshaped day for land sourcing
| Time | MAPRISE step | Duration |
|---|---|---|
| 9:00 | Receive a 100-site candidate list (internal sales / brokers) | List prep |
| 9:30 | AND filter (zoning + low hazard + price band + outside-of-agriculture) narrows to 50 sites | ~5 min |
| 10:00 | Evaluate 50 sites individually: FAR, frontage road, catchment | ~3 h |
| 13:00 | Share via URL (planned) with execs / design / sales — same map, parallel review | Real-time |
| 15:00 | Decide internal priorities → export volume-check PDF for the top picks | ~2 h |
| Next day | Hand top picks to an architect with MAPRISE screenshots + estimates attached | — |
What used to take a week of screening is targeted to finish in a single day (estimated impact; actual results vary by usage).
Data backdrop for developers
(See the four hero statistics above.)
Questions we often hear from developers & homebuilders
Q. How precise is the volume check?
A. It combines zoning, BCR, FAR, and frontage-road adjustment into an estimate. Use it as input for early screening, with the architect's full check (slant-line restrictions, sunlight regulations, etc.) handling the precision phase.
Q. Can we use PLATEAU 3D data?
A. PLATEAU 3D city models for 17 major cities across Kyushu (approx. 1.23 million buildings) are loaded. Building height and shape can be reviewed in 3D. Pro plan and above.
Q. Can we bulk-load candidate data?
A. CSV bulk import is planned (Enterprise plan) — pull property lists from in-house systems and screen them in one batch.
Q. How is access controlled when sharing with execs / design / sales?
A. Share URLs (planned) will support read-only and edit-enabled modes. IP allow-listing is planned for the Enterprise plan.
Q. Can we track competitor activity?
A. Recent transactions + land-price moves + building-permit data (designated cities) reveal area development tempo. Tracking specific firms' specific projects is a separate scope — let's discuss.
Recommended plan
For land sourcing in developers and homebuilders, we recommend the Business plan.
- Shared workspace for up to 10 branch staff (planned)
- Up to 5,000 property registrations / portfolio entries
- API integration (planned); 3-year history retention
- CSV bulk import (planned)
See it in the real app
Use case: when evaluating land acquisition, gauge oversupply risk via housing-starts x demographics cross-analysis, and pressure-test feasibility with land-price trends layering AI forecasts on 19 years of actuals.


Analysis results are for reference only. Consult a licensed real-estate agent or specialist before any contract or investment decision.