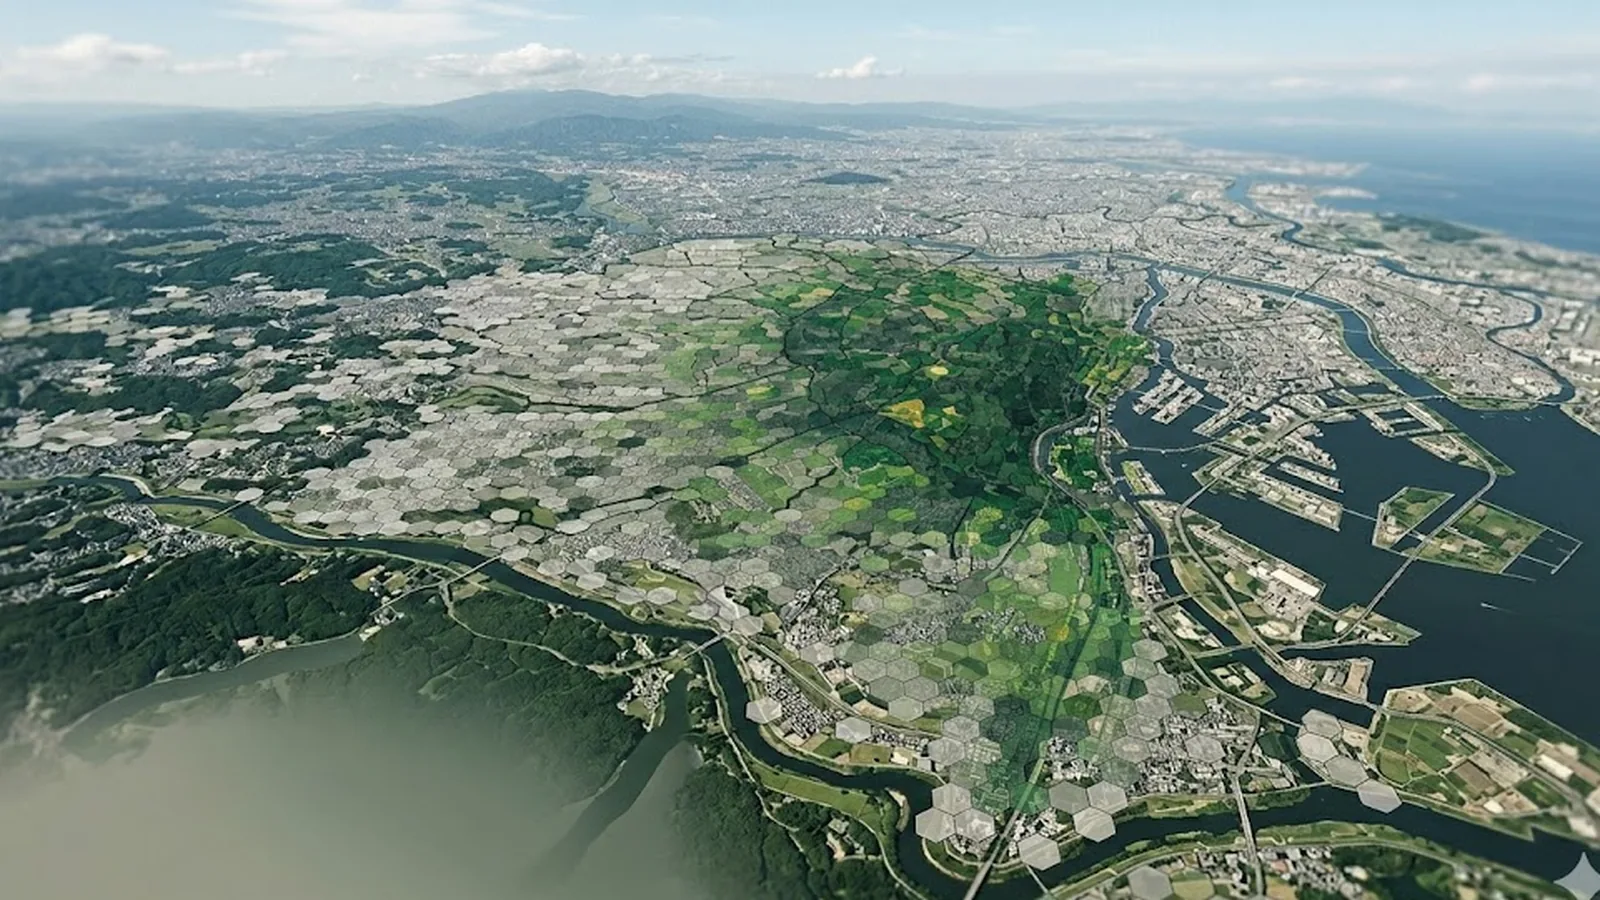
Three pains we hear from government and research
Inter-departmental data is fragmented
Urban-planning has its own GIS, disaster-management has hazard maps, planning has population statistics — all in separate systems. Coordinating a cross-department analysis can take weeks.
EBPM is bottlenecked by data collection
Census data, e-Stat, National Land Numerical Information — downloaded individually and overlaid in GIS. Days to weeks are spent on collection before analysis even starts. The bottleneck is upside-down.
Future change is hard to visualise
Where population decline, DID shrinkage, and rising hazard risk overlap requires time-series visualisation. Doing it has traditionally meant expensive GIS licences (ArcGIS, etc.).
What changes after MAPRISE
| Scenario | Before | After (MAPRISE) |
|---|---|---|
| Cross-department analysis | Each section's system referenced separately; manual Excel integration | Urban planning + disaster + population + transit shown together on one screen |
| Location Normalization Plan drafting | Outsource to specialist consultants; months of investigation | Urbanisation-guidance districts + future-population projection overlaid instantly; evidence brought in-house |
| Disaster-plan revision | Reference each municipality's hazard map separately | Kyushu-wide hazard + shelter + population distribution unified |
| Council / public-meeting materials | Static PDFs, paper-based explanations | Time-slider that animates "how the area changes over time" |
| Academic / research data gathering | Download census and National Land Numerical Information separately | One-click sourcing of cited datasets — citation metadata included |
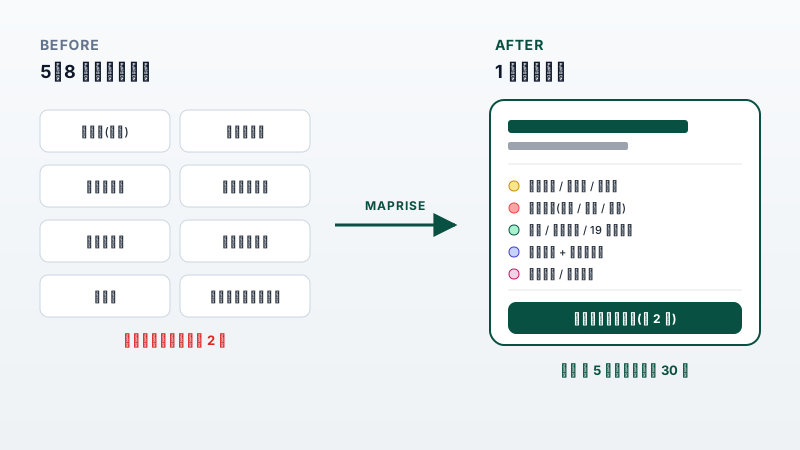
Department-by-department GIS and statistics, unified on a single MAPRISE screen
Four capabilities for government and research
Time-series data integration (10 layers)
Aerial photography, DID, land-use mesh, land prices, future population — 10 layers compared on a single time slider. Watch a community shift from 1960 to 2070 on one screen.
Multi-layer overlays
Urban planning (zoning + location-guidance districts) + hazard + population + transit + facility distribution — all on at the same time. Integrated analysis across departments completes in the browser.
AI-assisted EBPM conversation
"What's this area's population in 2050?" "How many people live in high-flood-risk areas?" — ask the AI, get integrated data summaries back. Evidence-building for policy proposals accelerates.
Policy-report PDF export
Map + chart + tabular data assembled into a report PDF in one click. Ready for council briefings, public meetings, and academic publication — citations are appended automatically.
Where it gets used
| Setting | What MAPRISE does |
|---|---|
| Annual Location Normalization Plan review | Urbanisation-guidance + future-population time series → revision-direction evidence |
| Regional disaster-plan update | Hazard history + shelters + at-risk resident districts unified |
| Urban planning council prep | Zoning proposal + nearby land prices + population dynamics into a single PDF |
| Academic research (urban shrinkage / DID) | 1960–2015 DID transitions as time series, citation metadata included |
| Council Q&A response | Ask the AI for instant area-specific data — same-day responses to council questions |
Data backdrop for government and research
(See the four hero statistics above.)
Frequently asked questions
Q. Does it integrate with our open-data portal?
A. CSV / GeoJSON are supported for I/O. Bringing in municipal-specific datasets (urban-planning GIS, lot-number maps, etc.) is planned for case-by-case handling under the Enterprise plan (coming soon, timing TBD).
Q. What citation format is used for academic papers / official reports?
A. Each data layer carries source attribution (MLIT, METI, etc.) suitable for citation. Specific citation formatting requirements can be discussed with support.
Q. Can it be used from a closed government network (LGWAN)?
A. We're cloud (SaaS) — a general internet connection is required. LGWAN-ASP arrangements are handled under the Enterprise plan.
Q. Access control / audit logs?
A. SSO/SAML, IP restrictions, and access audit logs are planned for the Enterprise plan.
Q. Can we run a PoC / pilot first?
A. Yes — 3–6 month pilot arrangements are available for government and research institutions. Reach out to discuss.
Recommended plan
For government and research workloads we recommend the Enterprise plan.
Note: Enterprise is coming soon (timing TBD). Please contact us to discuss your requirements.
- Unlimited seats; API access (planned)
- SSO / SAML authentication (planned)
- Dedicated CSM
- Fully customisable reports
- LGWAN-ASP / closed-network arrangements discussed case-by-case
See it in the real app
Use case: for location-optimization plans and wide-area administration, grasp the big picture with a population-change ranking of 92 Kyushu cities, then prioritize policy with compact-city analysis crossing optimization zones and demographics.


Analysis results are for reference only. For public decision-making such as policy formulation or resident briefings, please use only after verification against official statistics and confirmation by relevant experts.