BASE MAP CATALOGUE
Base map catalogue
A page for each base map you can choose in MAPRISE: what kind of map it is, what you can learn from it and what its limits are, so you can pick the one that suits your purpose.
As of 12 November 2026
What is a base map?
A base map is the "base" map laid at the very bottom. Layers such as zoning, hazards, land prices and facilities are all drawn on top of it.
Layers and base maps are different things. You can choose only one base map per screen, while any number of layers can be overlaid. In the four-way split view, each screen can have its own base map.
The same layer looks different on different base maps. For dark layers choose "Pale" or "Blank"; to overlay on real land choose an aerial photo; to overlay on terrain choose the Color Elevation Map or the Contour Map. Each base map has an opacity slider, so you can fade the base to make the layers on top stand out.
Choose by purpose
Overlay layers as clearly as possible
Check addresses, roads and place names
Read terrain: low ground, flood-proneness, fill
See the actual condition of the land
Compare how the land changed (then and now)
Aerial photo 1945–1950 (US Army)Aerial photo 1961–1969Aerial photo 1974–1978Aerial photo 2007– (Ortho)Yearly photo 2023
See the depth of a lake
Color Elevation MapContour Map (Color Bands)Lake depth shading (option)
Use in English materials or meetings with overseas partners
Road and place-name maps4 maps
Ordinary maps for reading addresses, roads, railways, buildings and place names. Start here if you are unsure.
GSI Map (Standard)
The standard map of the Geospatial Information Authority of Japan: roads, railways, buildings, contours, place names and administrative boundaries in colour. The most general-purpose base map.
- As a base
- Because it carries a lot of information, overlay colours can blend with the map colours. It is the base for reading place names and roads together with a layer. Switch to "Pale" or "Blank" when the overlay is hard to read.
- What you can learn
- Layout of roads, railways, stations and buildings
- Place names, town names and administrative boundaries
- Contours and spot heights (when zoomed in)
- Symbols for public facilities
- Limits and cautions
- Not a guarantee of the latest buildings and roads (new ones may appear late)
- Content switches with scale (zoomed out, a small-scale map is used and details are not shown)
- Range
- All of Japan. Zoom 5–18 (a small-scale map when zoomed out)
- Data source
- GSI Tiles (Standard map, Fundamental Geospatial Data), GSI
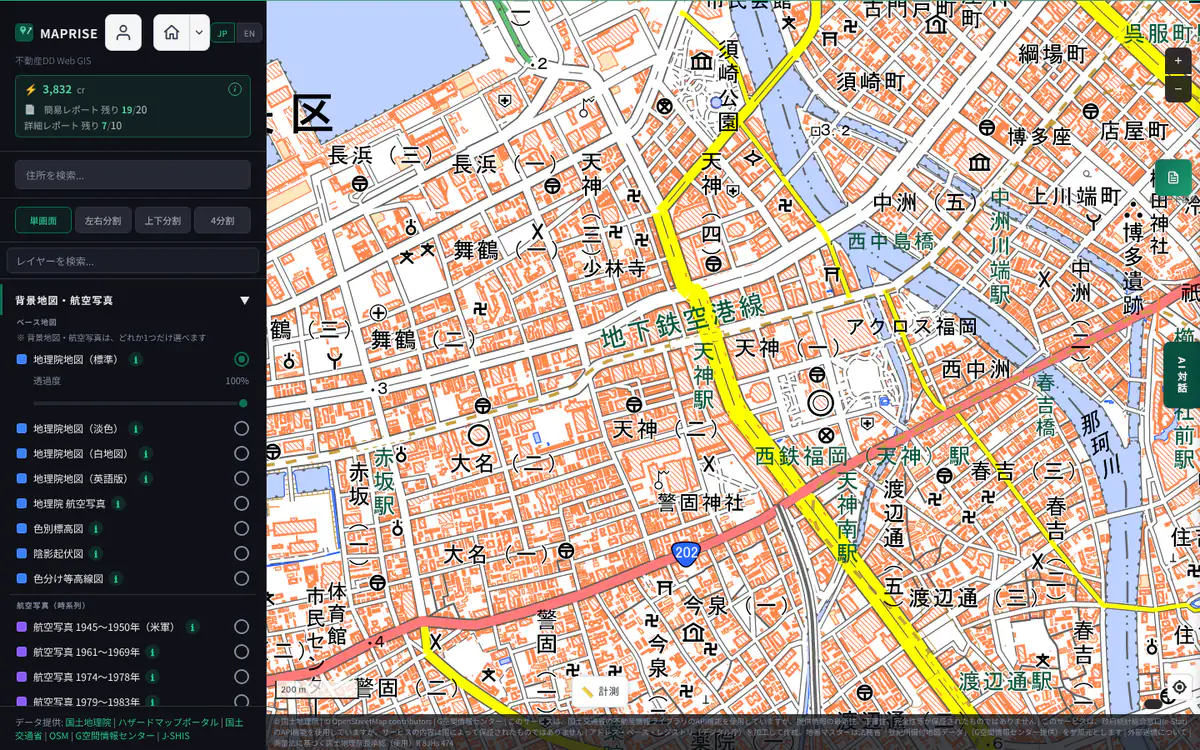
Screen example (MAPRISE) ・Place:Tenjin, Chuo Ward, Fukuoka City ・Click the image to open it full size GSI Map (Pale)
The same data as the Standard map, with softened colours.
- As a base
- The most suitable base map for viewing overlays. Its muted colours keep zoning, hazard and land-price colours from being buried. If unsure, overlay on this one.
- What you can learn
- Roads, railways, buildings and place names (same content as Standard, in pale colours)
- Limits and cautions
- Its pale colours make it poor for reading terrain or land use on its own
- Like Standard, new buildings and roads may appear late
- Range
- All of Japan. Zoom 5–18
- Data source
- GSI Tiles (Pale map, Fundamental Geospatial Data), GSI
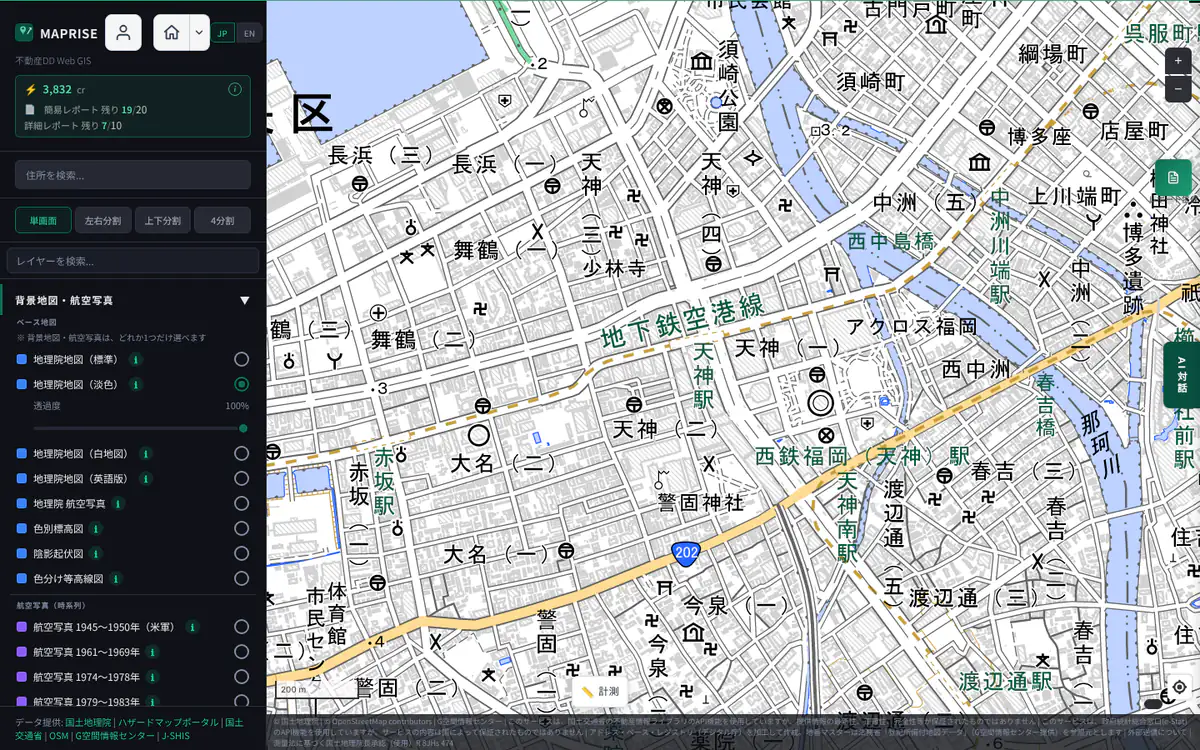
Screen example (MAPRISE) ・Place:Tenjin, Chuo Ward, Fukuoka City ・Click the image to open it full size GSI Map (Blank)
A white map with only boundaries and place names.
- As a base
- The base map that shows an overlay most clearly. Also useful for documents and screen captures.
- What you can learn
- Coastlines, administrative boundaries and place names
- Limits and cautions
- Roads and buildings are almost absent, so it is poor for locating places
- Zooming in beyond level 14 adds no detail (the image is stretched)
- Range
- All of Japan. Zoom 5–14
- Data source
- GSI Tiles (Blank map), GSI
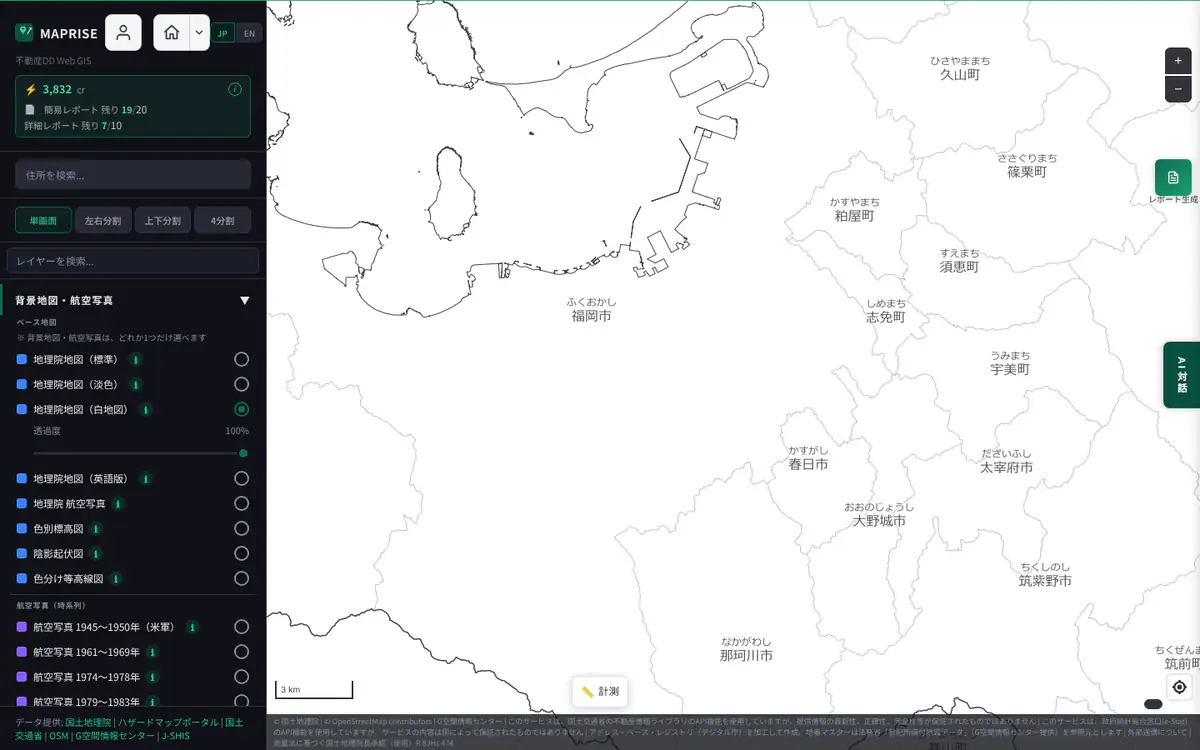
Screen example (MAPRISE) ・Place:Fukuoka City and its surroundings (wide view) ・Click the image to open it full size English map
A vector map that shows place names and similar labels in English. It is selected automatically when the screen language is set to English.
- As a base
- A base map for meetings with overseas partners and for foreign-language materials. Like the others, layers can be overlaid on it.
- What you can learn
- English labels for roads, railways and place names
- Limits and cautions
- Names without a registered English name appear in their original script
- It is not a GSI map, and its level of detail and content differ from the GSI maps
- The opacity slider is not available (it is a vector map)
- Range
- Wide area including all of Japan
- Data source
- Amazon Location Service map (see the credit at the bottom right of the map)
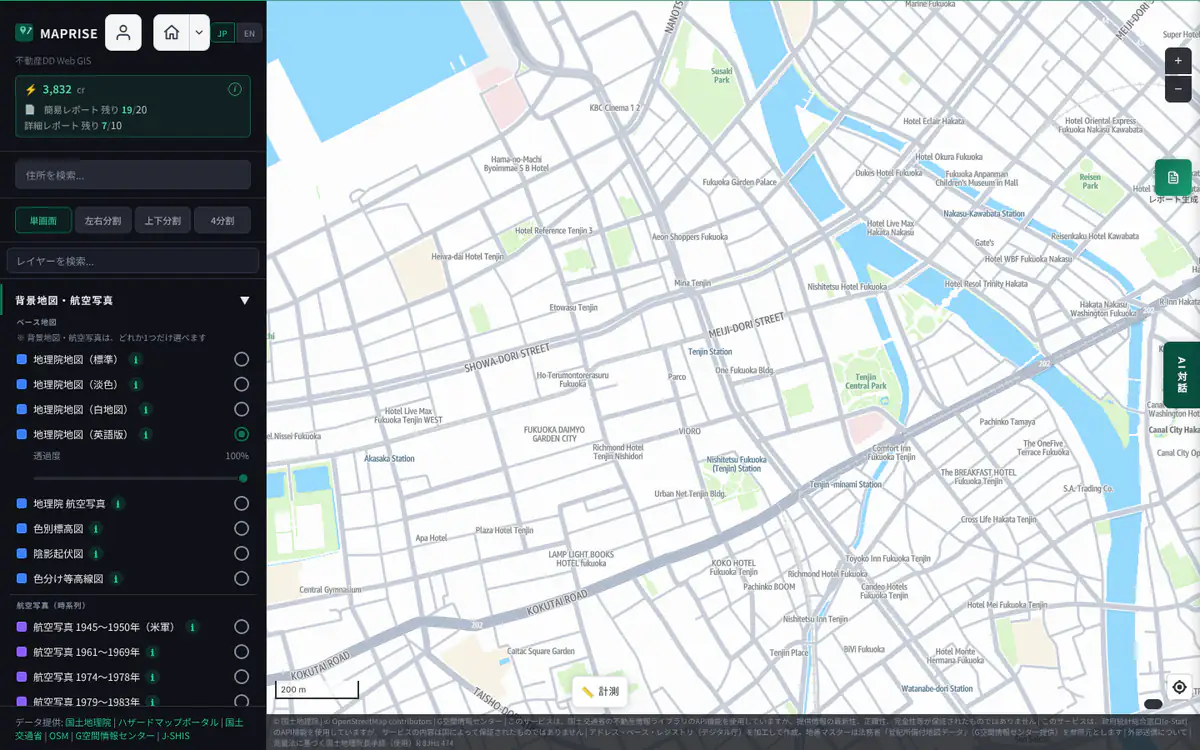
Screen example (MAPRISE) ・Place:Tenjin, Chuo Ward, Fukuoka City ・Click the image to open it full size
Terrain maps3 maps
Maps that show elevation and relief with colour or shading. Use them to read low ground that floods easily, cliffs, valleys and fill.
Color Elevation Map
A map that paints elevation in colours, changing step by step from low to high ground. The sea is coloured by depth.
- As a base
- Because the terrain itself is the base, it suits overlays closely tied to terrain (flood, landslide, landform classification). Its colours are strong, so adjust the opacity when overlaying dark layers.
- What you can learn
- Extent of lowlands, plateaus and mountains (broad height differences)
- Depth of sea and lakes (sea areas use Japan Coast Guard data)
- Hovering over land shows the elevation at that point (about X m, zoom 9 and above)
- With "Lake depth shading" on, the depth of surveyed lakes (see below)
- Limits and cautions
- Colour-to-elevation mapping is coarse and poor for reading differences of a few metres (use the Contour Map for fine differences)
- The elevation shown on hover is the value of the elevation-tile mesh (5 m or 10 m), excludes building and tree heights, says "No data" where there is none (e.g. over the sea), and is not shown on devices without a mouse
- Zooming in beyond level 15 adds no detail (the image is stretched)
- Elevations are reference values and are not guaranteed
- Range
- All of Japan. Zoom 5–15
- Data source
- GSI Tiles (Color elevation map), GSI. Sea areas created using data of the Hydrographic and Oceanographic Department, Japan Coast Guard
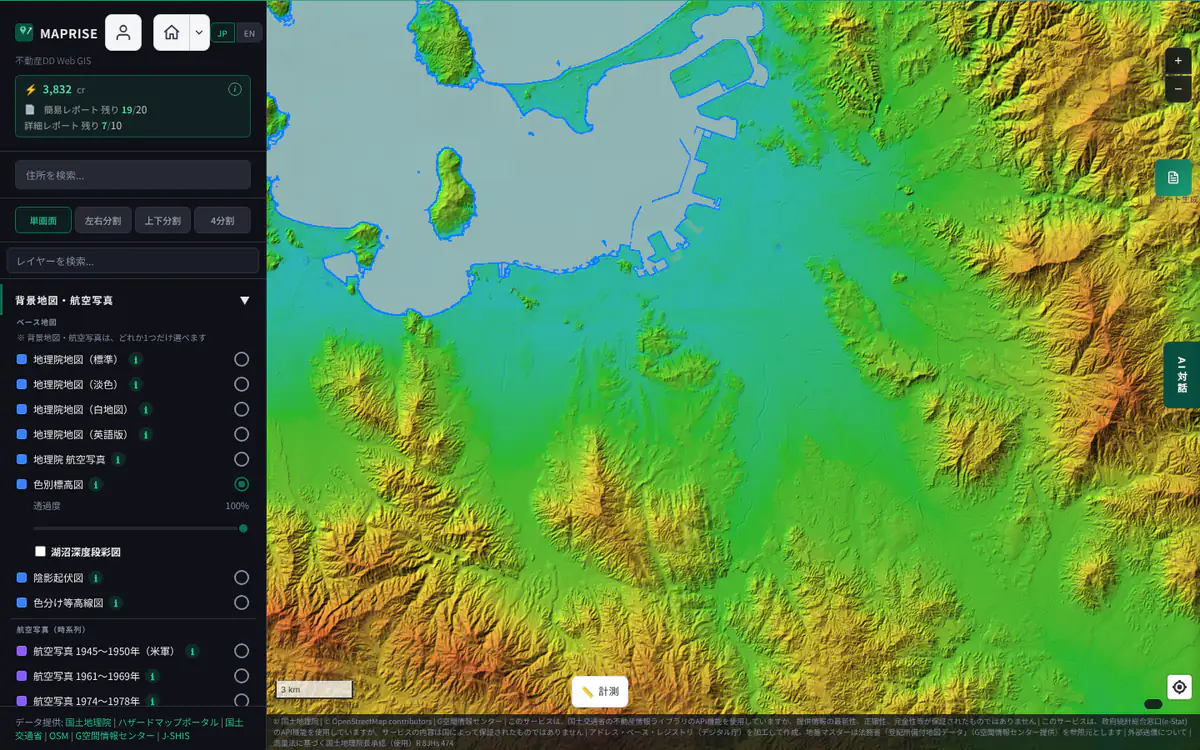
Screen example (MAPRISE) ・Place:Fukuoka City and its surroundings (wide view) ・Click the image to open it full size Hillshade Map
A map that shows the bumps and dips of the terrain with shading, as if lit by light.
- As a base
- Only the shape of the terrain is the base, so roads and buildings are absent. With few location cues, zoom in and check the place while using overlays.
- What you can learn
- Shape of ridges, valleys, cliffs and terraces
- Terrain of large embankments and developed land
- Clues to landforms prone to landslides
- Limits and cautions
- No place names, roads or colour information
- Accuracy follows the source elevation data (5 m or 10 m), so steps of a few metres may not be visible
- Zooming in beyond level 16 adds no detail
- Range
- All of Japan. Zoom 2–16 (10 m mesh up to zoom 12; 5 m or 10 m mesh from zoom 13)
- Data source
- GSI Tiles (Hillshade, Fundamental Geospatial Data DEM), GSI
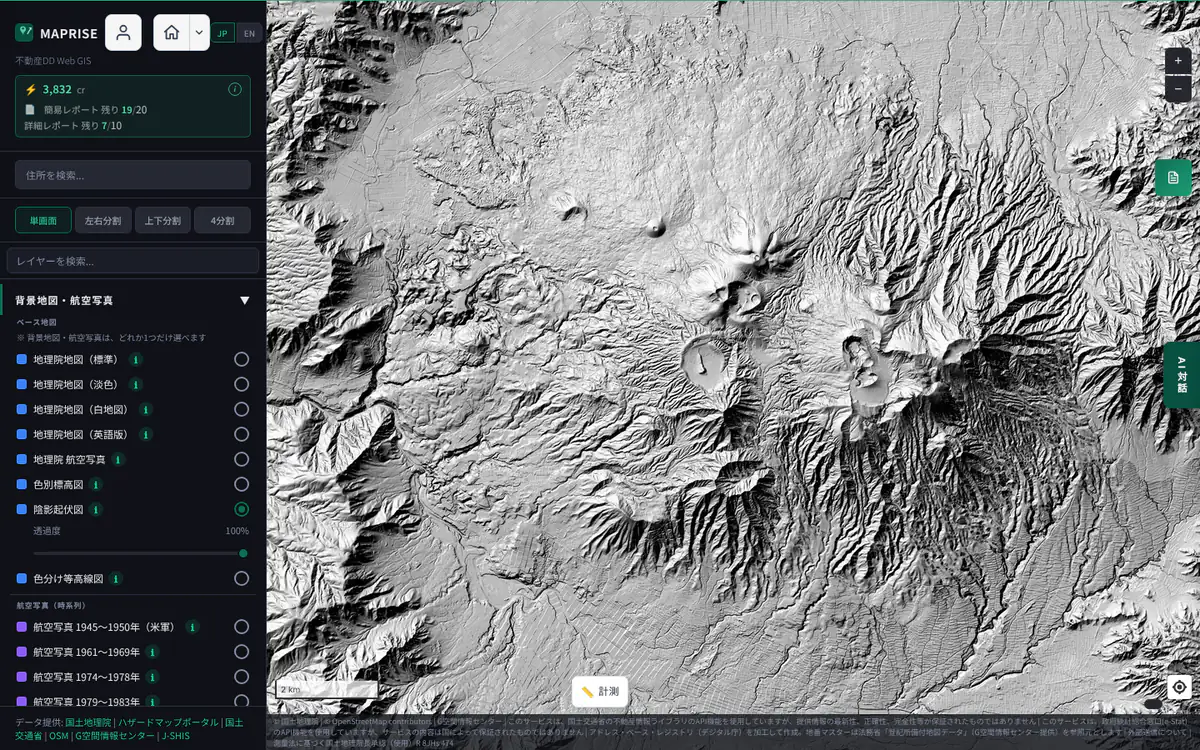
Screen example (MAPRISE) ・Place:Around Mt Aso (near Minamiaso, Kumamoto) ・Click the image to open it full size Contour Map (Color Bands)
A map that draws elevation over the pale map as colour bands per contour interval, with contour lines. Choose 10 m, 5 m, 2 m or 1 m; the colour range adapts to the elevations in view.
- As a base
- The pale map underneath lets you read terrain while checking roads and names. The band opacity can be changed with the opacity slider; keep it light when overlaying layers.
- What you can learn
- Subtle height differences on flat land (old river channels, natural levees, fill, flood-prone lowlands, plateau edges)
- Changes in slope (closely spaced contours mean steep slopes)
- Hovering over land shows the elevation at that point (about X m, zoom 9 and above)
- With "Lake depth shading" on, the depth of surveyed lakes (see below)
- Limits and cautions
- Elevations are reference values with errors and are not guaranteed
- The elevation shown on hover is the value of the elevation-tile mesh (5 m or 10 m), excludes building and tree heights, says "No data" where there is none (e.g. over the sea), and is not shown on devices without a mouse
- Source data is 1 m, 5 m or 10 m depending on the place; a fine interval on coarse data looks smoother than the real ground
- When zoomed out, lines would merge, so the interval coarsens automatically and, further out, nothing is drawn (zoom in to see it)
- The fine 1 m and 2 m intervals are a feature of the Starter plan and above (the 10 m and 5 m intervals are available on every plan)
- Water surfaces (rivers, ponds, sea) are left uncoloured
- Range
- All of Japan. Zoom 7 and above (source 1 m, 5 m or 10 m by place; 0.5–1 m from prefectural and other data near Nagasaki Station, the mountains of Toyama, southern Oita and the private forests of Tottori)
- Data source
- GSI (elevation tiles, processed). For the credits and approvals of the Nagasaki, Toyama, Oita (Forestry Agency) and Tottori data, see the map credit and the Data Sources list
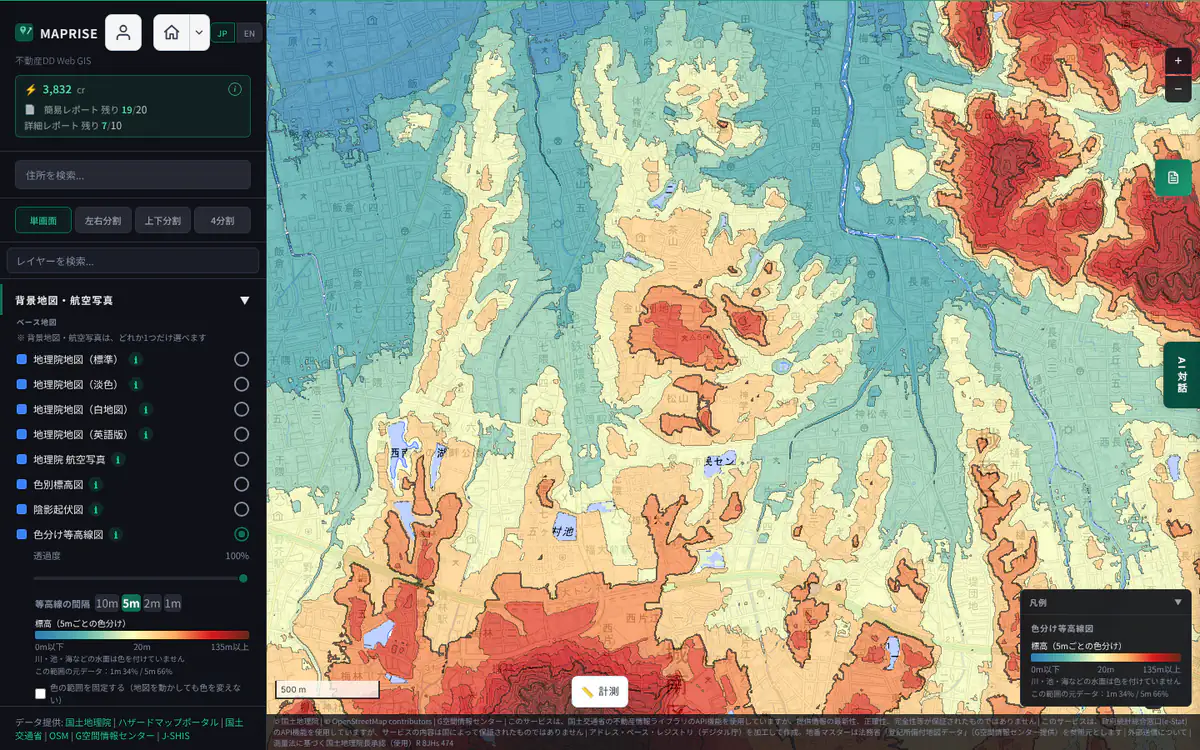
Screen example (MAPRISE) ・Place:Jonan Ward, Fukuoka City ・Click the image to open it full size
Option for the Color Elevation Map and the Contour Map
Lake depth shading (option)
A checkbox appears under the list of base maps only while the Color Elevation Map or the Contour Map is selected. Turned on, it overlays the depth of lakes surveyed by GSI: pale purple for shallow water, dark purple for deep water. Because it is purple, separate from the land elevation colours, land relief and lake depth are easy to tell apart. It turns off when you switch to another base map. At zoom 11 or higher, hovering shows the depth at that point (about X m below the standard water level, at survey, reference), so you can read a number as well as the colour.
Limits and cautions
- Only lakes covered by the GSI lake surveys (surveyed lakes from Hokkaido to Kagoshima; not every lake appears). The depth number is available only for lakes published as "Lake data"; on other lakes the colour may show but no number appears
- Maximum depth and survey year differ by lake, and the lakebed may have changed since the survey
- The depth in the callout is a computed, smoothed value and may differ from the published maximum depth of the lake; it does not appear on devices without a mouse (such as smartphones). Reference information only; it does not guarantee safety for navigation, swimming or construction
Data source
GSI Tiles (Lake data, Lake depth), GSI. Loaded on the fly from GSI by the user's browser
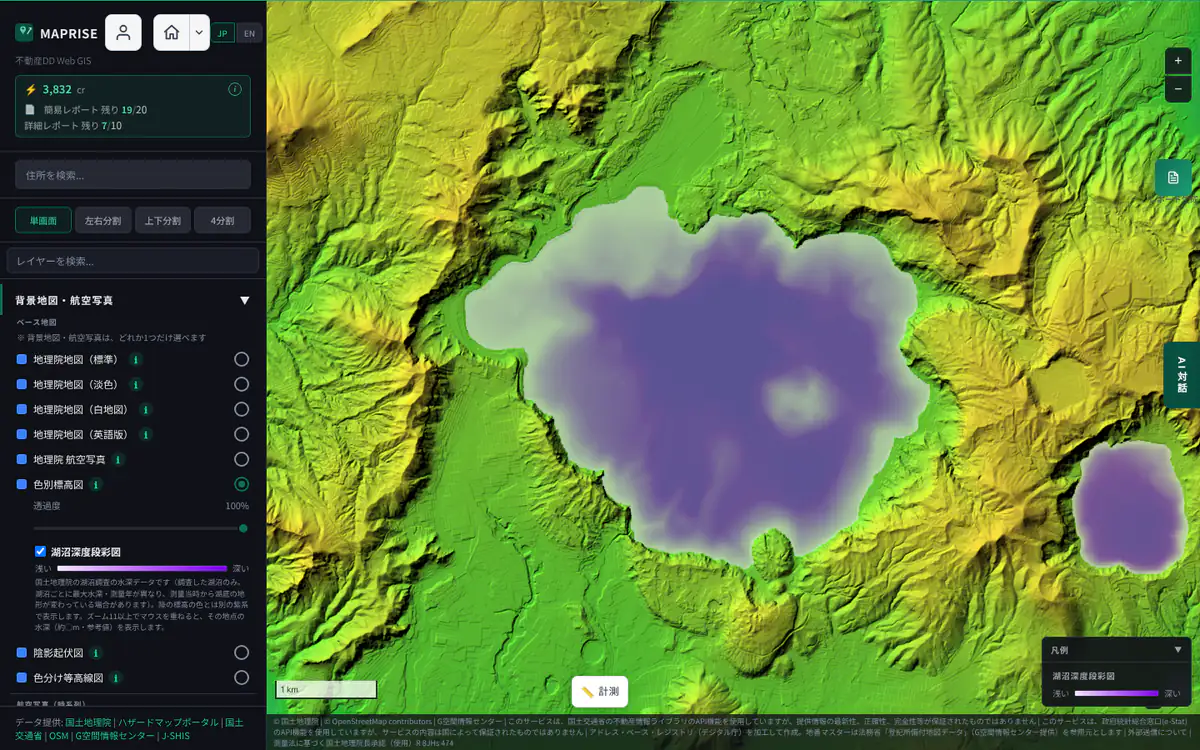
Latest aerial photos1 maps
A base map for checking the actual condition of the land in photographs.
GSI Aerial Photo
A seamless map of the latest aerial photographs of the whole country published by GSI.
- As a base
- Suited to checking "what is this area like now" by overlaying boundary and zone layers on the real land. Pale layers are hard to see on a photo, so raise the opacity or choose line layers.
- What you can learn
- Actual land use: buildings, parking lots, vacant land, farmland and forest
- Land under development, traces of construction, rivers and coastlines
- Roof shapes and how sites are used
- Limits and cautions
- Photos were taken at different times in different places, so this is not "today" (recent rebuilds or site works may be missing)
- No place or road names; switch to the Pale map to confirm a location
- Zoomed out, it switches to a satellite mosaic and details are not visible
- Photos from several organizations are stitched together, so colour and sharpness vary by place
- Range
- All of Japan. Photos at zoom 14–18 (satellite imagery when zoomed out)
- Data source
- GSI Tiles (nationwide latest photos, seamless; made from the orthophotos of the Fundamental Geospatial Data, and aerial photos of the Forestry Agency and local governments, among others), GSI
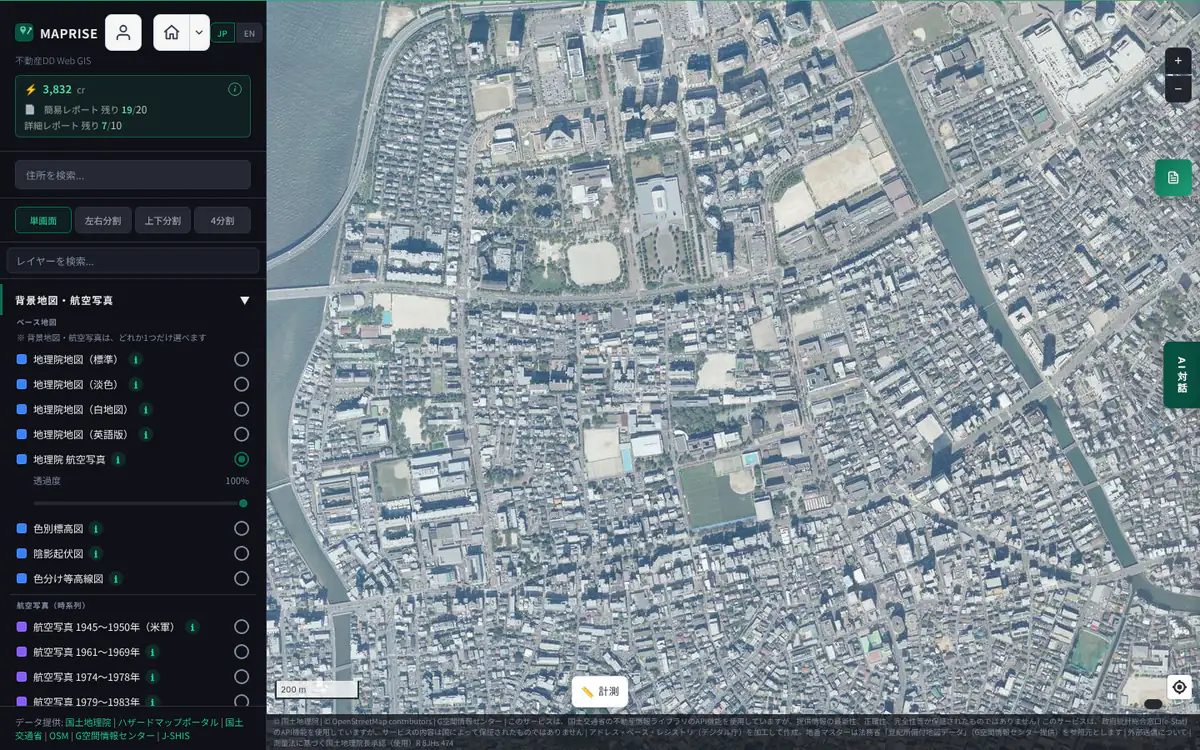
Screen example (MAPRISE) ・Place:Momochihama and Nishijin, Sawara Ward, Fukuoka City ・Click the image to open it full size
Past aerial photos and yearly photos11 maps
Aerial photos from the past to the present, for comparing how land changed over time (farmland to housing, fill and reclamation, before and after disasters).
The same place across the years (Momochihama, Fukuoka)
Momochihama was built on land reclaimed from the sea in the 1980s. Placing the aerial photos of each period side by side shows the shoreline moving out to sea and empty land turning into a town. Select a photo to jump to that base map.
Aerial photo 1945–1950 (US Army)
Aerial photographs taken by the US Army just after the war.
- As a base
- You can overlay current layers (zones, land prices, hazards) to see what the place was like right after the war.
- What you can learn
- War and air-raid damage
- Pre-war townscape, fields and river courses
- Coastlines and terrain before reclamation and development
- Limits and cautions
- Coverage and dates vary by place and do not cover the whole country
- Old black-and-white photos with positional errors and image distortion
- Shown at zoom 10–17 (no extra detail beyond that)
- Range
- Photographed areas only. Zoom 10–17
- Data source
- Photographed by the US Army / GSI Tiles (aerial photos 1945–1950), GSI
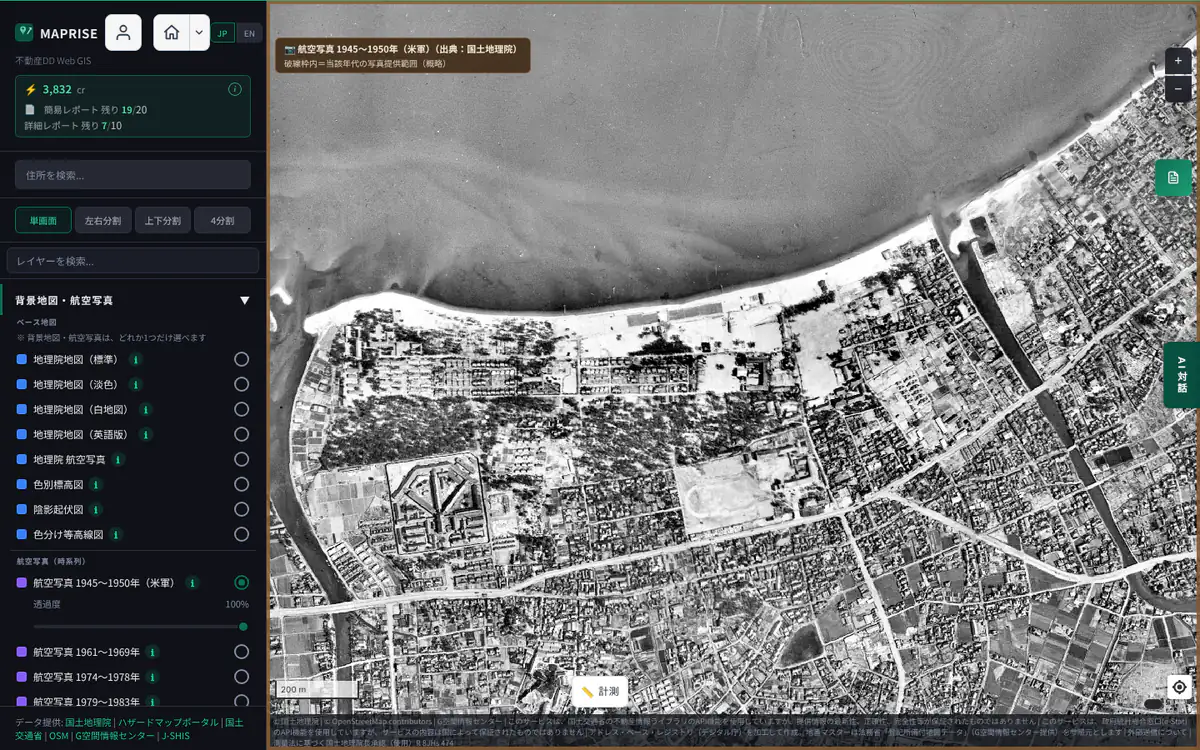
Screen example (MAPRISE) ・Place:Momochihama and Nishijin, Sawara Ward, Fukuoka City ・Click the image to open it full size Aerial photo 1961–1969
Aerial photographs from the period of rapid economic growth.
- As a base
- With the land use before urbanization as the base, you can overlay current zoning or land prices to see how much has changed.
- What you can learn
- Terrain, fields and villages before urbanization
- Land before new towns and industrial parks were built
- Limits and cautions
- Photographed areas only; the whole country is not covered
- Old photos with positional errors and image distortion
- Shown at zoom 10–17
- Range
- Photographed areas only. Zoom 10–17
- Data source
- GSI Tiles (aerial photos 1961–1969), GSI
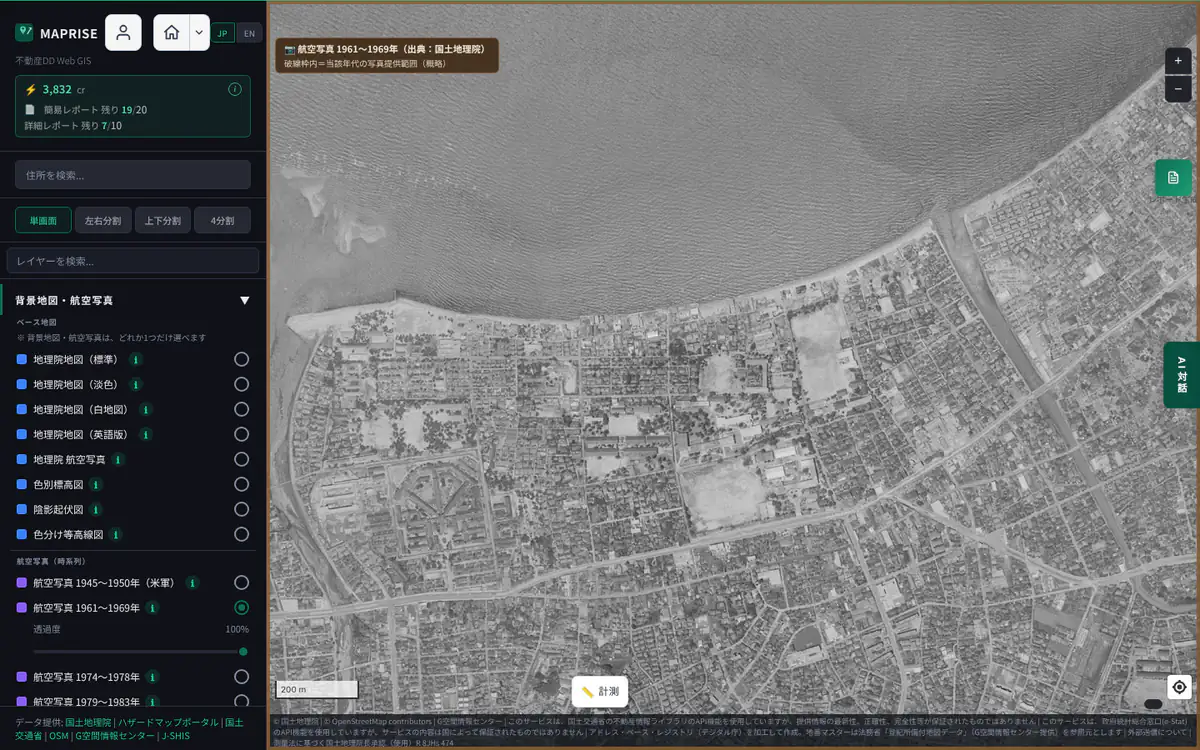
Screen example (MAPRISE) ・Place:Momochihama and Nishijin, Sawara Ward, Fukuoka City ・Click the image to open it full size Aerial photo 1974–1978
Aerial photographs of the 1970s (Land Image Information).
- As a base
- Use it as a 1970s base to compare with the present.
- What you can learn
- 1970s land use and extent of built-up areas
- Farmland, forest and water before they became housing land
- Limits and cautions
- Photographed areas only; the whole country is not covered
- Positional errors and image distortion
- Shown at zoom 10–17
- Range
- Photographed areas only. Zoom 10–17
- Data source
- GSI Tiles (Land Image Information 1974–1978), GSI
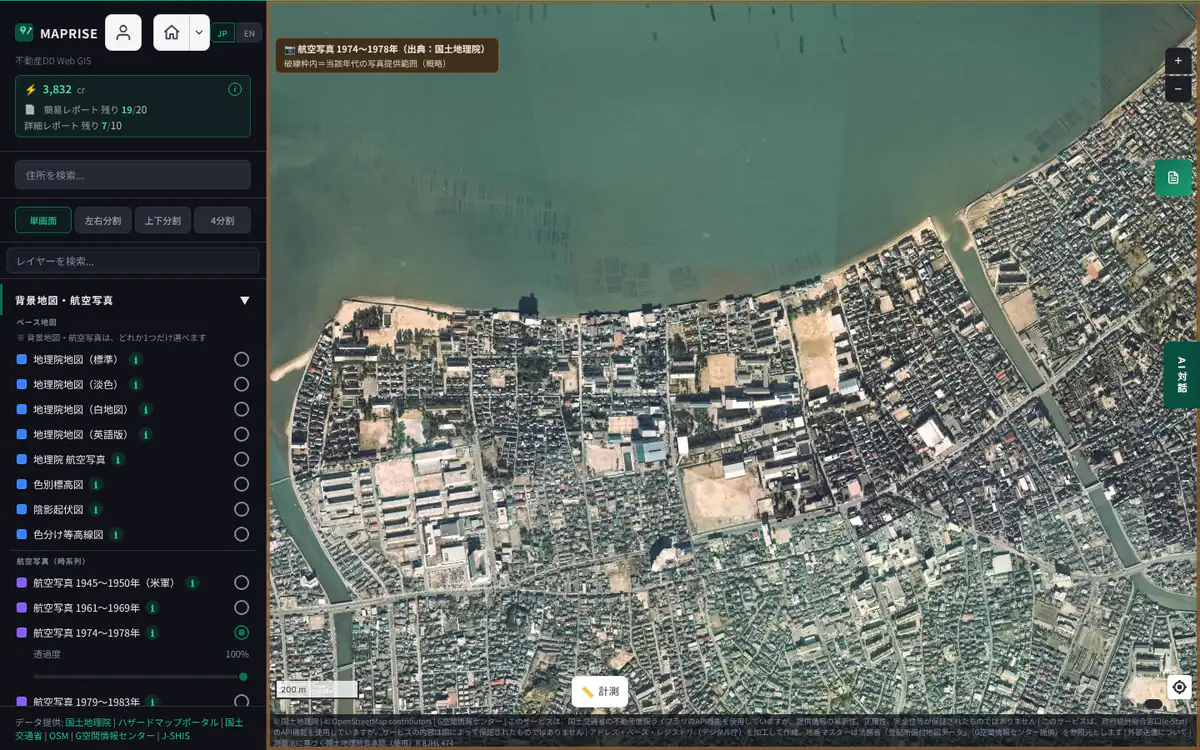
Screen example (MAPRISE) ・Place:Momochihama and Nishijin, Sawara Ward, Fukuoka City ・Click the image to open it full size Aerial photo 1979–1983
Aerial photographs of the early 1980s (Land Image Information).
- As a base
- Use it as a base showing the land while built-up areas were expanding, to compare with the present.
- What you can learn
- Land use around 1980 and the expansion of built-up areas
- Limits and cautions
- Photographed areas only; the whole country is not covered
- Positional errors and image distortion
- Shown at zoom 10–17
- Range
- Photographed areas only. Zoom 10–17
- Data source
- GSI Tiles (Land Image Information 1979–1983), GSI
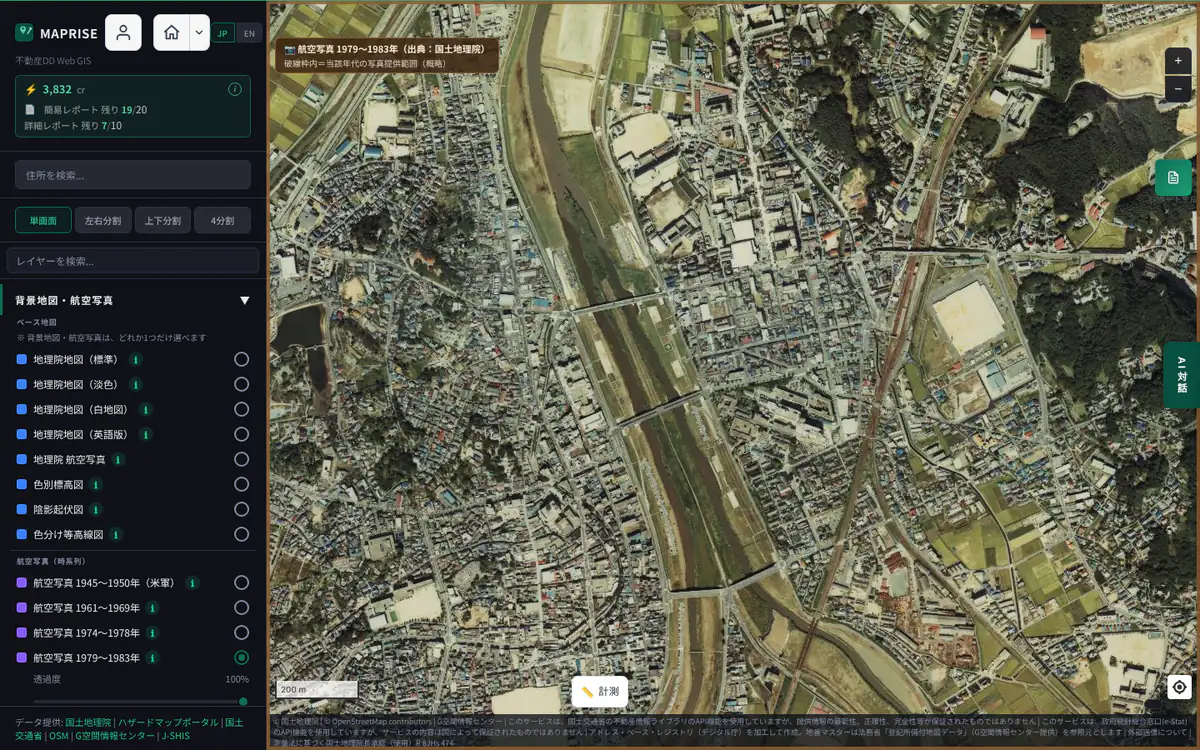
Screen example (MAPRISE) ・Place:Iizuka, Fukuoka Prefecture (Momochihama is outside its coverage) ・Click the image to open it full size Aerial photo 1987–1990
Aerial photographs from the late 1980s to 1990 (Land Image Information).
- As a base
- Use it as a base showing the land during the development boom, to compare with the present.
- What you can learn
- Development in the late 1980s (developed land, resorts, new housing areas)
- Limits and cautions
- Photographed areas only; the whole country is not covered
- Positional errors and image distortion
- Shown at zoom 10–17
- Range
- Photographed areas only. Zoom 10–17
- Data source
- GSI Tiles (Land Image Information 1987–1990), GSI
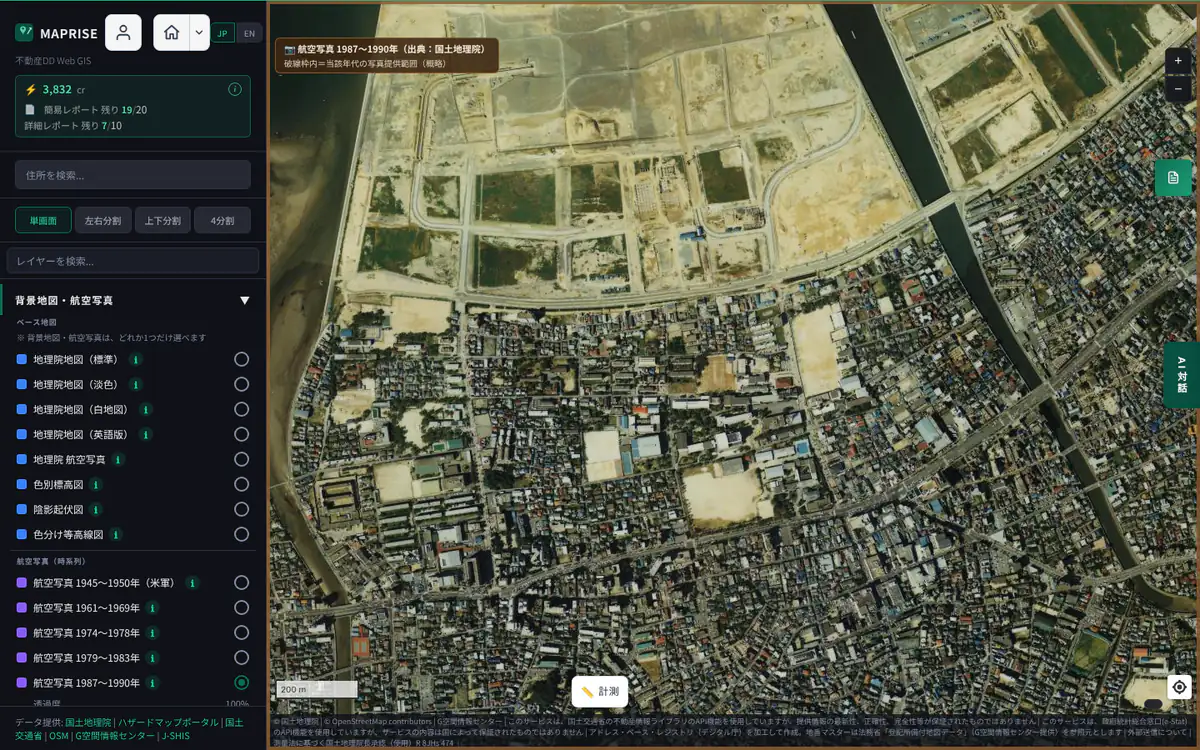
Screen example (MAPRISE) ・Place:Momochihama and Nishijin, Sawara Ward, Fukuoka City ・Click the image to open it full size Simple aerial photo 2004–
A map made by stitching together photographs taken for purposes such as checking airborne laser surveys.
- As a base
- A base map for quickly checking relatively recent conditions over a wide area.
- What you can learn
- Relatively recent land conditions since 2004 (also for quick checks after disasters)
- Limits and cautions
- Photos before orthorectification (the process that corrects distortion to match the map), so there are positional shifts and distortion
- Available only where it has been prepared
- Shown at zoom 14–18
- Range
- Prepared areas only. Zoom 14–18
- Data source
- GSI Tiles (simple aerial photos 2004–), GSI
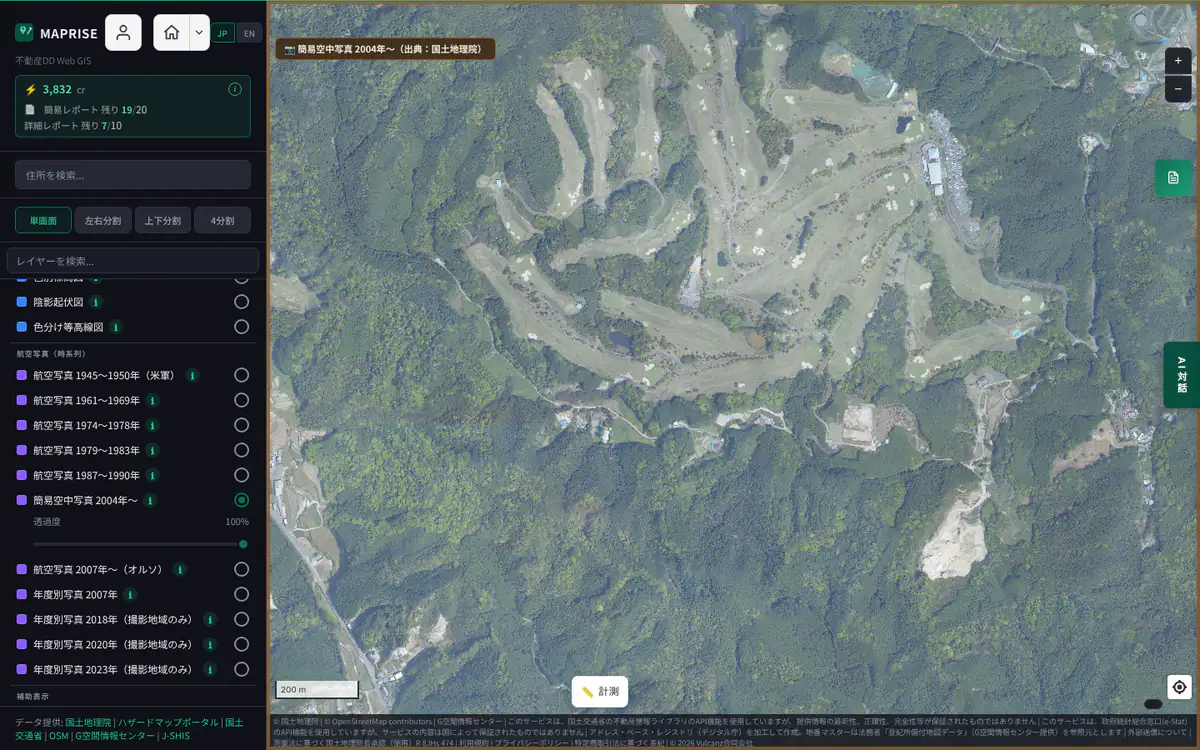
Screen example (MAPRISE) ・Place:Nakagawa, Fukuoka Prefecture (Momochihama is outside its coverage) ・Click the image to open it full size Aerial photo 2007– (Ortho)
Aerial photographs since 2007 corrected for distortion (orthorectified) so that they line up with the map.
- As a base
- Its positional accuracy is high, so zone, boundary and facility layers overlay with little shift. It includes older images than the latest seamless photo.
- What you can learn
- Land use, building positions and progress of site development since 2007
- Limits and cautions
- Dates differ by place
- No place or road names
- Shown at zoom 14–18
- Range
- All of Japan (dates vary by place). Zoom 14–18
- Data source
- GSI Tiles (Fundamental Geospatial Data, orthophoto), GSI
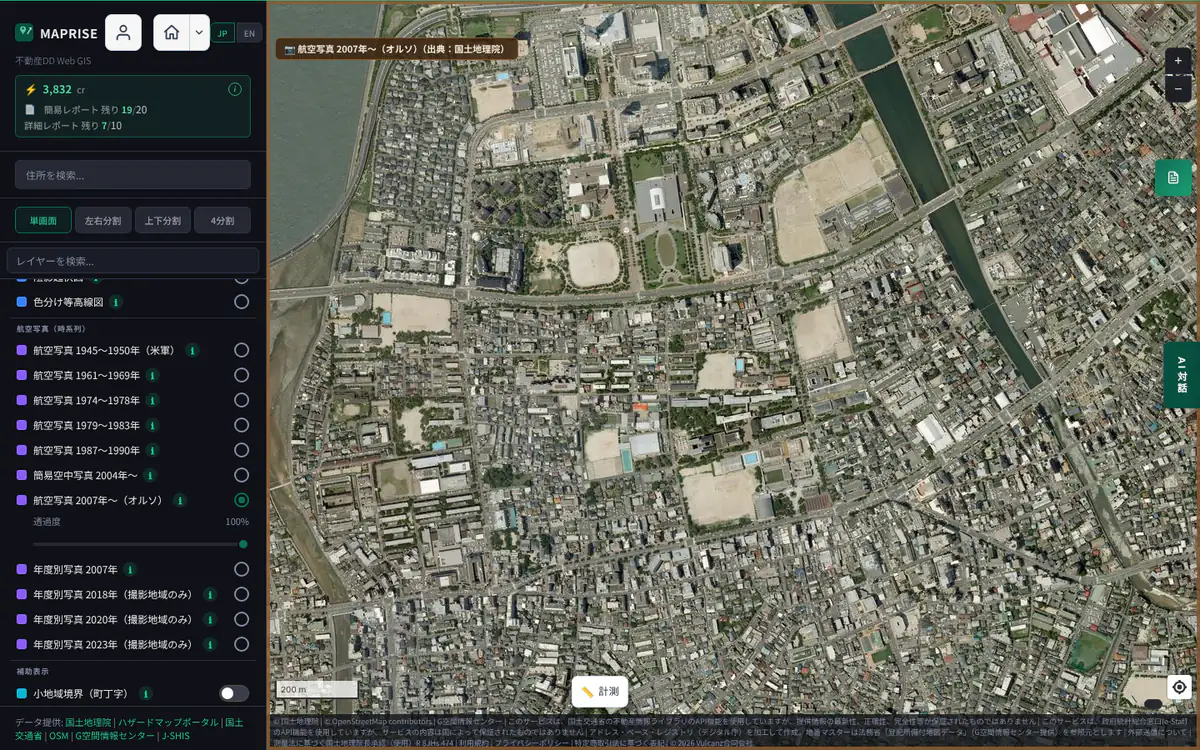
Screen example (MAPRISE) ・Place:Momochihama and Nishijin, Sawara Ward, Fukuoka City ・Click the image to open it full size Yearly photo 2007
Aerial photographs taken in 2007, by year.
- As a base
- A base map for checking a specific year. Switch between yearly photos to compare the same place over time.
- What you can learn
- Land use and buildings as of 2007
- Limits and cautions
- Photographed areas only (no photo outside them)
- Shown when zoomed in to level 14 or more
- Range
- Photographed areas only. Zoom 14–18
- Data source
- GSI Tiles (yearly photos), GSI
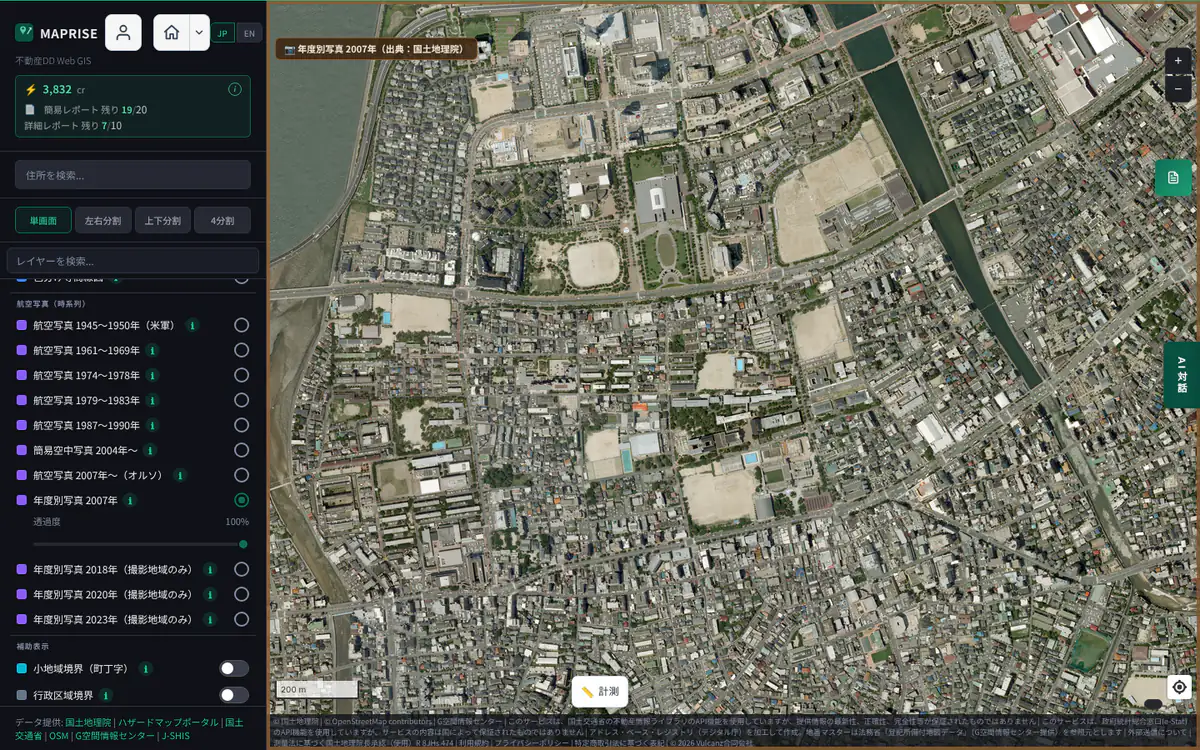
Screen example (MAPRISE) ・Place:Momochihama and Nishijin, Sawara Ward, Fukuoka City ・Click the image to open it full size Yearly photo 2018
Aerial photographs taken in 2018, by year.
- As a base
- A base map for checking a specific year. Switch with the 2020 and 2023 photos to compare the same place.
- What you can learn
- Land use and buildings as of 2018 (also for before-and-after disaster comparison)
- Limits and cautions
- Photographed areas only. Outside them no photo is shown, and a button to jump to a photographed area is offered
- Shown when zoomed in to level 14 or more
- Range
- Photographed areas only. Zoom 14–18
- Data source
- GSI Tiles (yearly photos), GSI
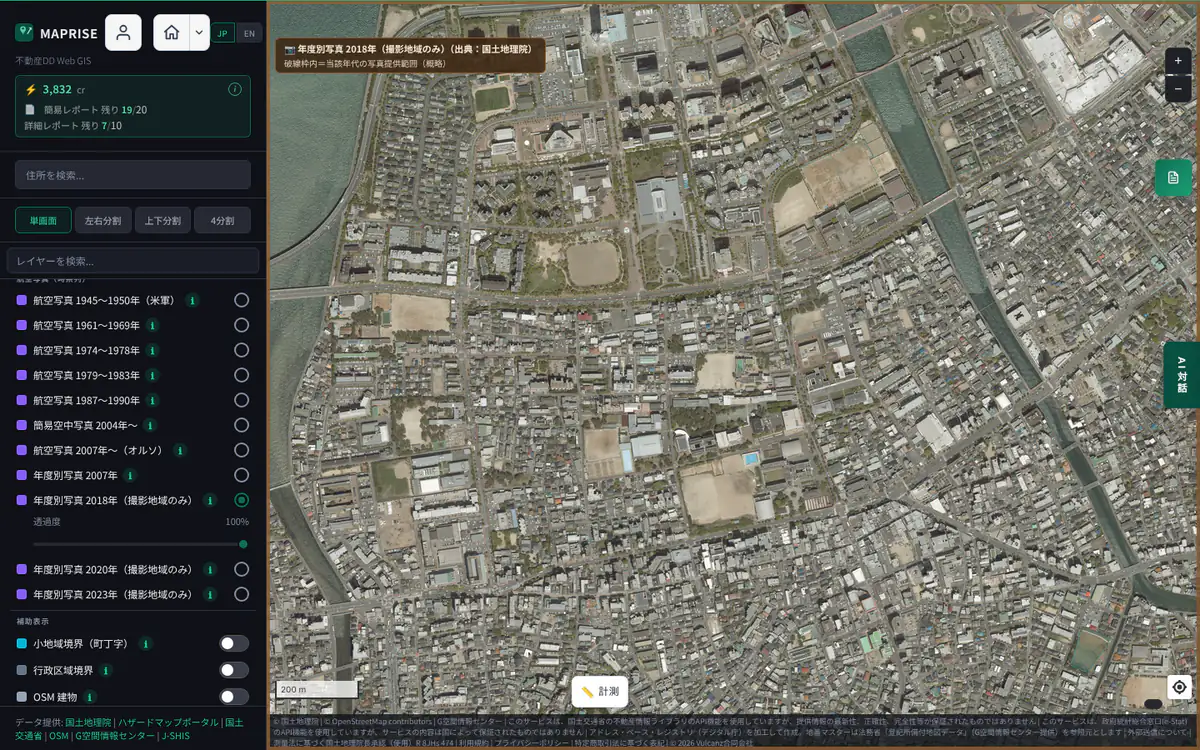
Screen example (MAPRISE) ・Place:Momochihama and Nishijin, Sawara Ward, Fukuoka City ・Click the image to open it full size Yearly photo 2020
Aerial photographs taken in 2020, by year.
- As a base
- A base map for checking a specific year. Switch between years to compare the same place.
- What you can learn
- Land use and buildings as of 2020
- Limits and cautions
- Photographed areas only. Outside them no photo is shown, and a button to jump to a photographed area is offered
- Shown when zoomed in to level 14 or more
- Range
- Photographed areas only. Zoom 14–18
- Data source
- GSI Tiles (yearly photos), GSI
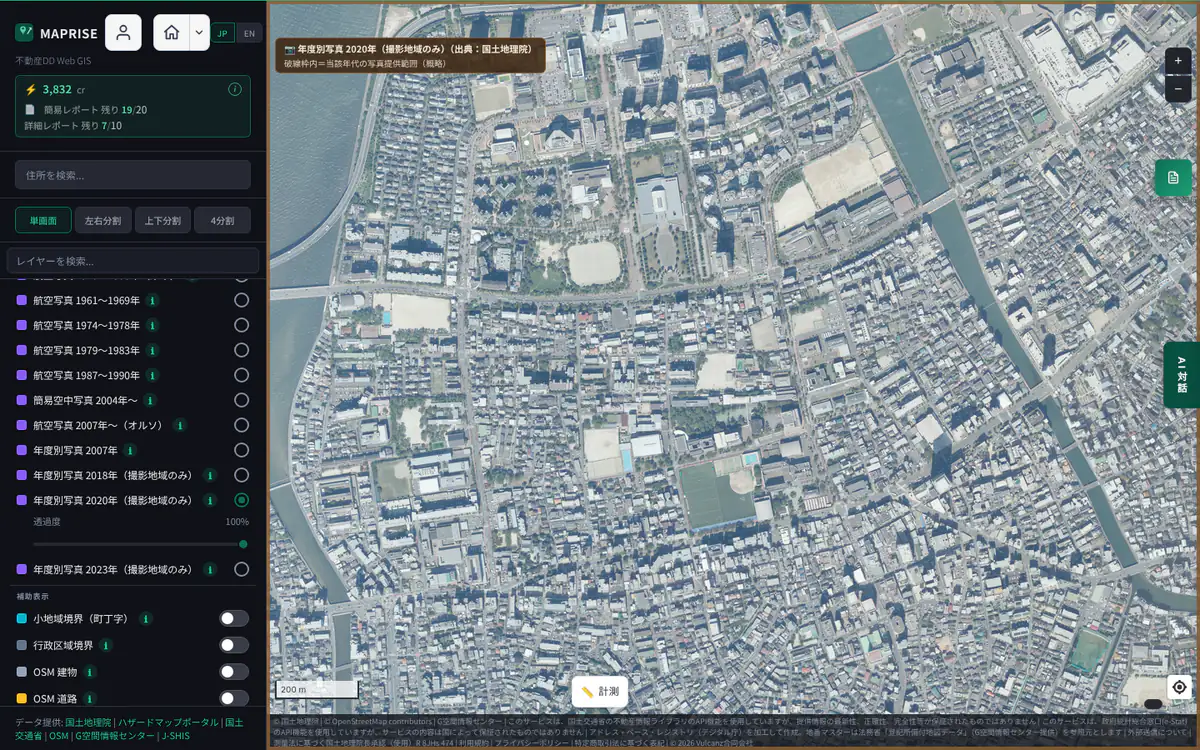
Screen example (MAPRISE) ・Place:Momochihama and Nishijin, Sawara Ward, Fukuoka City ・Click the image to open it full size Yearly photo 2023
Aerial photographs taken in 2023, by year.
- As a base
- A base map for checking a recent year. Switch with past years to compare the same place.
- What you can learn
- Land use and buildings as of 2023 (recent conditions)
- Limits and cautions
- Photographed areas only. Outside them no photo is shown, and a button to jump to a photographed area is offered
- Shown when zoomed in to level 14 or more
- Range
- Photographed areas only. Zoom 14–18
- Data source
- GSI Tiles (yearly photos), GSI
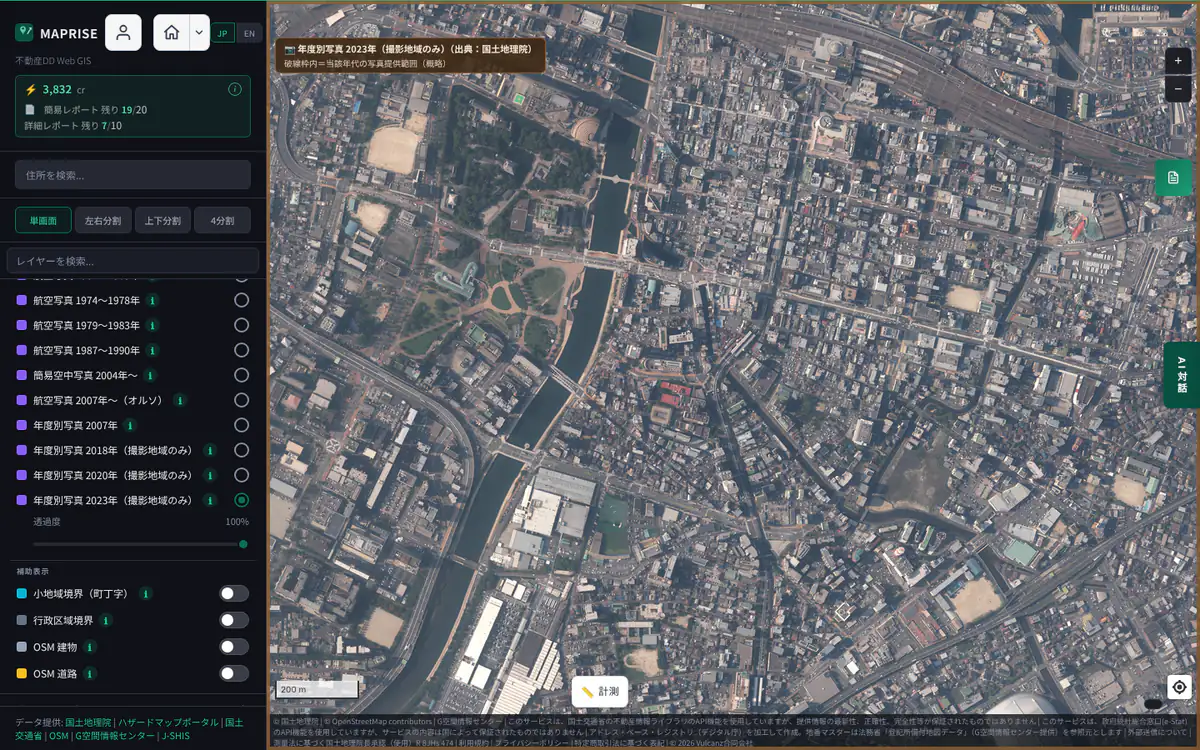
Screen example (MAPRISE) ・Place:Kokura Kita Ward, Kitakyushu (Momochihama is outside its coverage) ・Click the image to open it full size
Cautions common to all base maps
- Base maps are reference information. They are not survey results themselves and do not guarantee the latest on-site conditions. For rights, boundaries and asset value, also use the land register, an on-site check and expert advice.
- The GSI-based base maps (Standard, Pale, Blank, Color Elevation, Hillshade, Aerial Photo) are loaded on the fly from GSI by your browser. They are not stored or redistributed on our servers. GSI-side updates or outages may change what you see or temporarily prevent display.
- Zoomed in too far, the image is stretched and blurred because the source map has no finer detail. Each base map's "Range" notes the maximum zoom at which detail is available.
- A base map switches as soon as you choose it. When you switch between Standard, Pale, Aerial Photo and the Contour Map, or between periods of past aerial photos, the previous map stays on screen until the new map images arrive and is replaced as they come in (on a slow connection, old and new maps may appear mixed for a moment).
- No base map is restricted by plan. Only the fine 1 m and 2 m intervals of the Contour Map are a feature of the Starter plan and above (the 10 m and 5 m intervals are available on every plan).
The layers you can overlay on a base map are introduced in the Layer catalogue. Open the Layer catalogue / Open the Data Sources list