What you can do
| Feature | Details | Status |
|---|---|---|
| Measure | Click on the map to measure area and distance (polylines too). Area in sq m, tsubo and ha, with each side's length | Available |
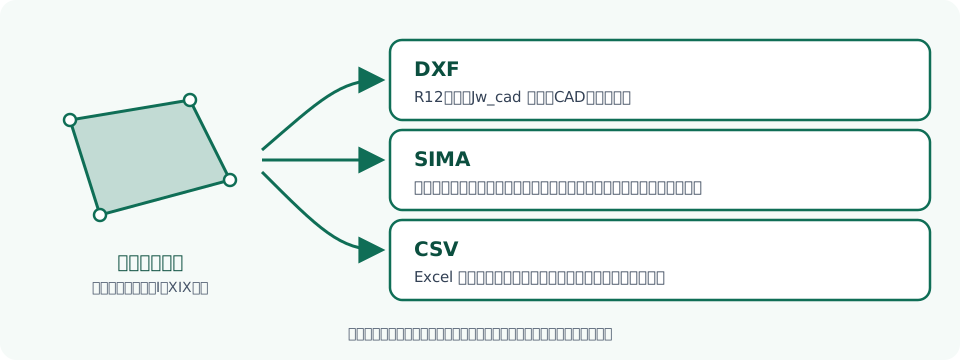
| Export | Export the measured parcel as DXF (R12), SIMA, JWW (Jw_cad) or CSV, converted to plane rectangular coordinates (zones I to XIX) | Available |
| Split / import | Split the measured parcel into two parts of a chosen area (a line parallel to the chosen edge; a calculation guide). Load a SIMA file and show it on the map | Available |
| Survey sketch (draft) | From the measured parcel and the neighboring lots of the registry map (lot numbers) shown on the map, make a draft drawing with side lengths, area, north arrow, scale bar and adjoining lot numbers, printed or exported as DXF at A4 or A3 and a chosen scale | Available (areas where the registry map is included) |
| A4 or A3, portrait or landscape, at 1:500, 1:1,000, 1:2,500, 1:5,000 or as on screen. A scale bar, sources and a notice are added | Available | |
| Read | Read the coordinate table of a land survey drawing (PDF), verify the area, then overlay it on the map | Available (free account sign-in required) |
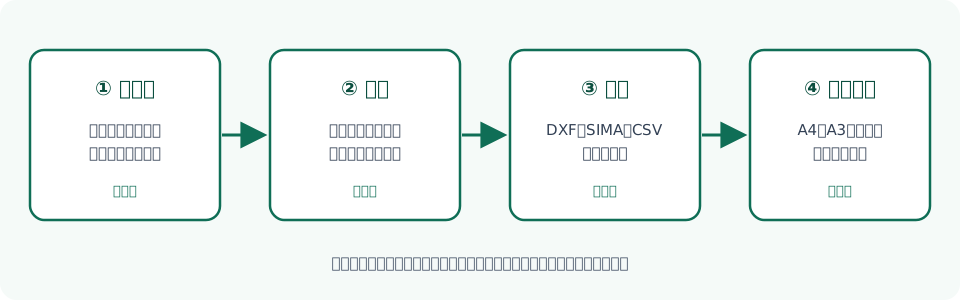
The available features are used from the "Measure" button at the bottom of the map screen: choose Area or Distance.
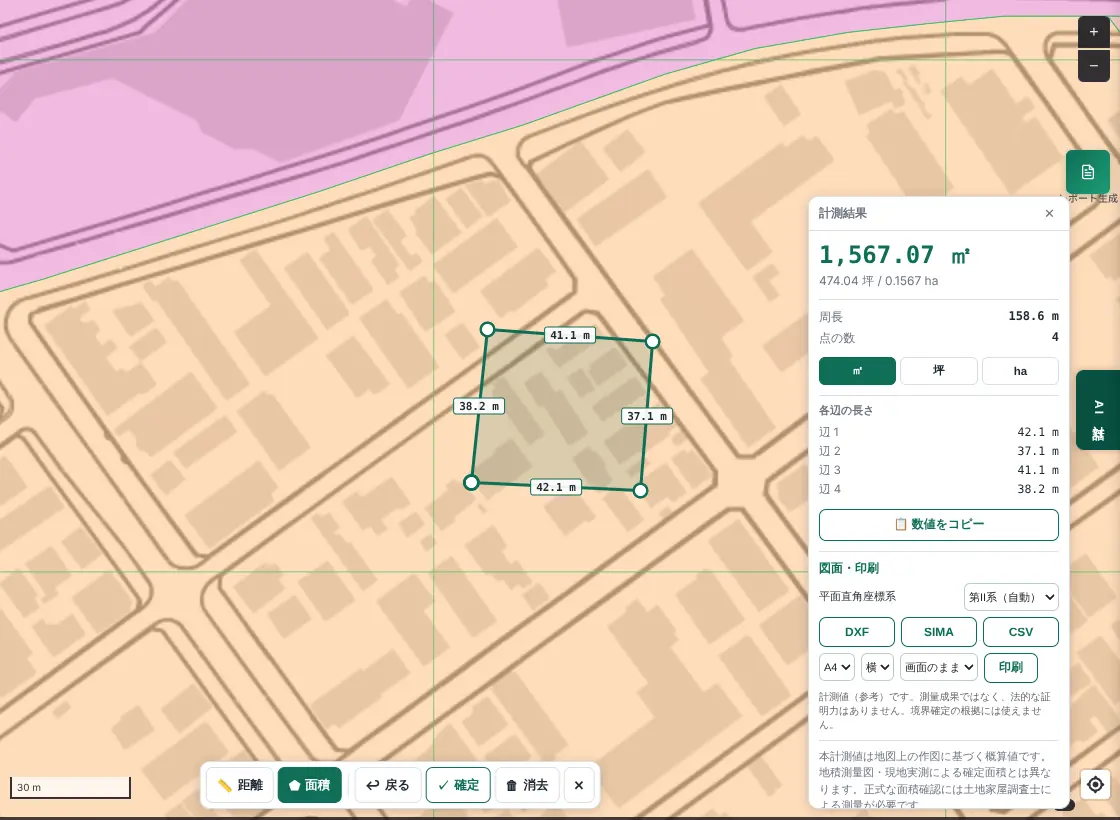
A real screen (in Fukuoka, measured with zoning layers overlaid). Continue to export and print from the panel on the right.
Intended users
| User | Main use |
|---|---|
| Administrative scriveners | Before filing for farmland conversion, development permits or building procedures, check the zone and a rough area of the site |
| Land and house surveyors | Desk check before visiting the site; drawings to explain to clients |
| Real estate appraisers | Check area, shape and surroundings; prepare location maps for reports |
| Judicial scriveners and lawyers | Explain the position and size of land to clients in inheritance, sale or dispute cases |
| Real estate companies and developers | Early screening of sites; compare areas of subdivision plans |
| Financial institutions and local governments | Check the scale and surroundings of collateral or public land |
Use cases
1. Preliminary check before a farmland conversion filing (administrative scrivener)
Overlay layers to see whether the site is in an urbanization promotion or control area, its zoning, and how farmland parcels line up. Draw around the site to measure a rough area and explain on screen in the consultation.
2. Desk check before survey (land and house surveyor)
Overlay registry maps and parcel polygons to confirm the approximate position of the site and its surroundings. Print a drawing to take to the site, at a set paper size and scale.
3. Explaining to clients in inheritance or sale consultations
Hand over one A4 or A3 sheet showing roughly how large the land is and what restrictions apply. Because it prints with hazards and zoning overlaid, the grounds for your explanation go with it.
4. Comparing subdivision plans and candidate sites (developers)
Draw around candidate sites and compare areas in tsubo, sq m or ha. Export the parcel to CAD and carry on into planning.
Today's pain points, and how this helps
| Pain point | Usual way | How MAPRISE helps |
|---|---|---|
| Visiting several offices and sites to check zones and restrictions | Check municipalities, legal affairs bureaus and map sites separately | Registry maps, zoning, urbanization zones and hazards overlaid on one map |
| Re-measuring area and distance each time | Pick dimensions off drawings or use another tool | Click to measure on the spot, on the overlaid map (switch sq m, tsubo, ha) |
| Retyping measured values into CAD or spreadsheets | Manual entry of coordinates and dimensions | Export to DXF, SIMA, JWW or CSV, cutting retyping and transcription errors |
| Making separate drawings for site visits and meetings | Paste screenshots or add by hand | Print at a chosen paper size and scale, with scale bar, sources and notice added |
| Explaining land to clients only verbally | Preparing materials takes time | Explain with the screen and a printout, with restrictions and hazards overlaid |
| Retyping coordinates from survey drawings by hand | Key in from the coordinate table | Read from a PDF and verify the area before overlaying on the map |
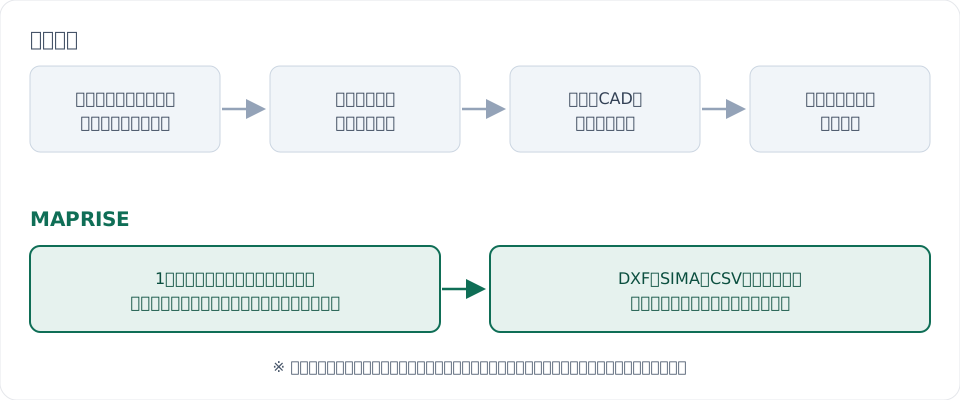
How MAPRISE can contribute
- Less legwork: research, measure, export and print on one screen, with less transcription between screens.
- Less variation: whoever measures, the same map, units and display are used.
- Easier to explain: measure in front of the client with restrictions and hazards overlaid, then print and hand it over.
- Easy to start: try it on the free plan, on a single preliminary check.
Handy ways to use it
- DXF into CAD such as Jw_cad: start a drawing from the measured parcel.
- SIMA into survey software: hand over coordinates.
- CSV into Excel: organize point numbers, coordinates, side lengths and area.
- A3 at a fixed scale: take 1:500 or 1:1,000 as a site-check drawing.
- Choose the zone: the plane rectangular zone is chosen automatically from the map position as a guide. The legal zone is set by municipality, so change it where needed.
Benefits of combining with existing layers
The key strength is that you measure on the same map you researched. MAPRISE has many layers, such as zoning, hazards, land prices and registry maps, and you can measure and print with them overlaid.
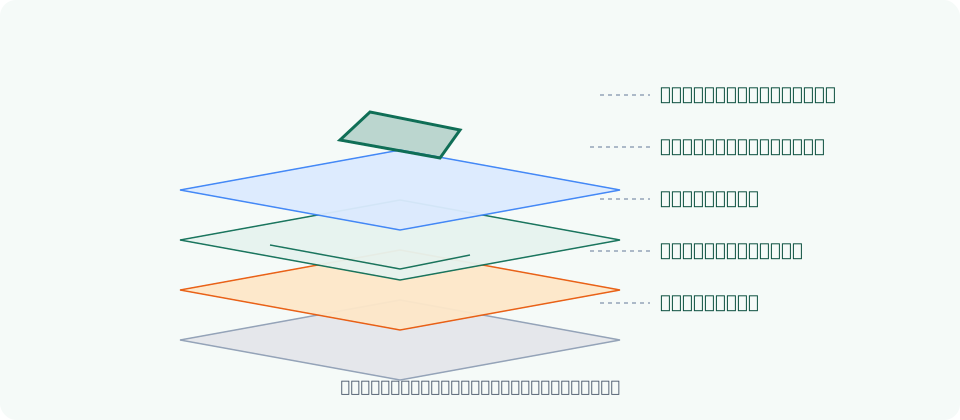
| Combination | What you learn or can do |
|---|---|
| Registry map and parcel polygons x measure | See the approximate position of the parcel and the size of the area you drew |
| Zoning and urbanization zones x measure | See which zones the site spans while measuring a rough area |
| Hazards (flooding, landslides) x print | Print a map with disaster risk overlaid as an explanatory handout |
| Land prices x area | Set nearby land price levels beside the site's area for review |
| Aerial photos x measure | Check area while viewing present land use |
Print the overlaid screen on a single A3 sheet so everyone at the meeting looks at the same map.
Three steps
- Research on the map: search an address and overlay the layers you need, such as registry maps, zoning and hazards.
- Measure: from "Measure" at the bottom, choose "Area", click the corners in order and press "Finish". The panel shows the area and each side's length.
- Export or print: use "DXF", "SIMA", "JWW" or "CSV" in the panel, or choose paper, orientation and scale and press "Print".
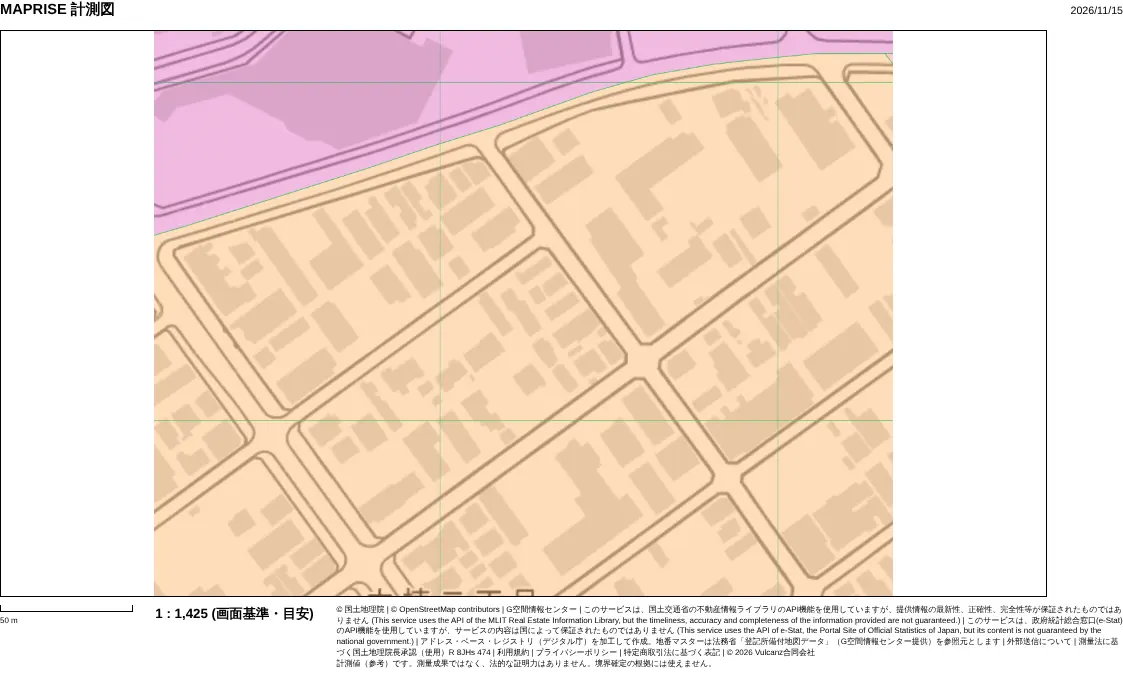
A print example (A4 landscape). The scale bar, scale, sources and notice are added automatically.
Reading land survey drawings (PDF)
A land survey drawing has a coordinate table giving boundary-point coordinates and area. To cut the effort of reading and retyping it by hand, MAPRISE reads the coordinates from a PDF and verifies the area before overlaying it on the map.
Conditions: sign in with a free account (not available to guests). There is a monthly limit; a free account can read up to 30 files a month (paid plans allow more). It does not use AI credits. PDFs up to 4MB.
How: choose "Survey drawing PDF" under "📄 Load a PDF or SIMA file" in the measurement panel (it works before you draw anything), and the parcel appears on the map with its area and side lengths. You can export it as DXF, SIMA, JWW or CSV (the coordinates read are exported as they are, without recomputing).
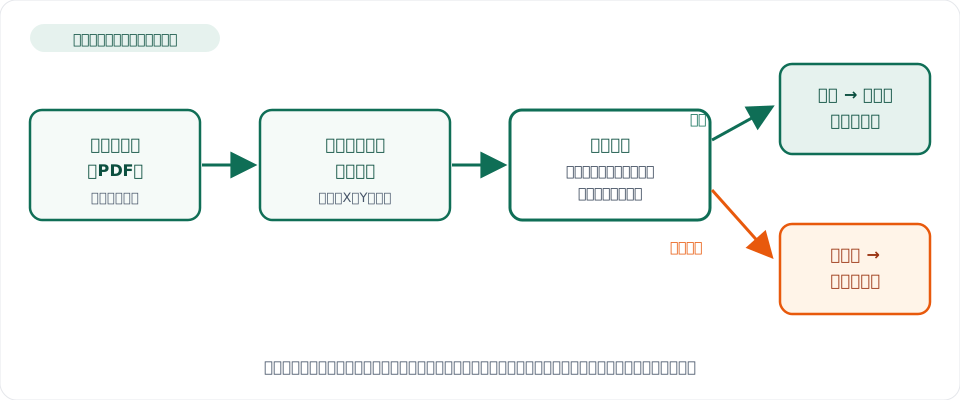
- It computes the area from the coordinates and does not show anything when it does not match the stated area (a design to avoid showing misreadings).
- It also shows nothing when the area cannot be read or the points self-intersect.
- To read it, the PDF is sent to an AI processed in Japan. MAPRISE servers do not store the PDF.
- Depending on scan quality, stamps or handwriting, some drawings cannot be read. When it cannot be read, no coordinates are shown. A displayed parcel is also reference only, not a survey result.
What it can and cannot do
| What it can do | What it cannot do |
|---|---|
| Preliminary research before a site visit; preparing client explanations | Replace a survey result, an appraisal report or a certified registry record |
| Rough distance and area measurement on the map | Be used as a figure with legal evidentiary value |
| Overlay registry maps and parcel polygons to see approximate positions | Determine boundaries. The absence of a line on the map does not mean there is no boundary |
| Reference display of zones, zoning and hazards | Serve as the basis for building confirmation applications or important-matter explanations |
Values in exported DXF, SIMA, JWW and CSV files and in printouts are measured on the map (reference only). A formal area check or boundary determination requires a survey by a land and house surveyor.
Frequently asked questions
Q. Can I use it for free?
A. Yes. On the free plan you can try map viewing and distance and area measurement. The available range varies by plan. See the pricing page.
Q. Is a measured area treated as the registered area?
A. No. Treat areas measured on the map as a guide. They do not replace the registered area or an area fixed by survey.
Q. Can I open the exported DXF in Jw_cad?
A. DXF is exported in R12 format. Results can vary by CAD product and version, so please try one file in your environment first.
Q. Can I export to JWW (Jw_cad files)?
A. Yes. Use "JWW" in the measurement card to export in the Jw_cad 8 format (version 700): an A3 landscape sheet at the smallest scale that fits the parcel, with the side lines, point numbers, side lengths, area and the plane rectangular zone. We have confirmed the file can be read back by an independent implementation, but we have not been able to confirm importing it in Jw_cad itself. If it does not open, please use DXF.
Q. Can I split a parcel by a given area?
A. Yes. In "Split by area" in the measurement card, choose the area of part A and the edge to run parallel to, and the parcel is divided by a line parallel to that edge. The areas of parts A and B are shown, and each can be displayed on the map. This is a reference calculation; areas for subdivision or registration must be fixed by a survey (for example by a licensed land and house surveyor).
Q. What should I do when a PDF cannot be read, or it says the cross-check does not match?
A. The screen shows likely causes and the next step. The main ones are:
- "The coordinates do not match the stated area": the difference between the area computed from the coordinates and the area stated on the drawing is shown. A digit, decimal point or sign may have been misread. Please try a clearer PDF of the table. Reading the same file again right away is not counted twice.
- "The coordinate zone could not be read": choose the zone on the screen and read again without choosing the file again.
- "Shown on the map, but away from where you are looking": the zone may be wrong. You can choose another on the screen.
- Monthly limit: it resets on the 1st of next month (Japan time). Loading SIMA is not limited.
If you have the coordinate data (SIMA), load it with "SIMA file". The zone is estimated automatically from the map position.
Q. Can I make a survey sketch?
A. You can make a draft survey sketch. In "Survey sketch (draft)" in the measurement card, choose the paper and scale, and the drawing is made from the measured parcel and the neighboring lots (lot numbers) of the registry map shown on the map. It works only in areas where the registry map is included (check "Registry Map (Lot Numbers)" in the layer catalog). The registry map has no certifying power and does not show actual conditions or boundaries. A formal survey sketch is made by a licensed land and house surveyor through a field survey.
Q. Which survey software can read SIMA?
A. It is exported in a common coordinate and parcel data format. Reading can vary by software version, so please confirm the import beforehand.
Q. Is the print scale accurate?
A. The screen is printed at the chosen scale on the basis of 96 dpi (1 screen pixel = 25.4/96 mm). If the map is larger than the paper, only the part that fits is printed. The scale for "as on screen" is a guide.
Q. Is the plane rectangular zone chosen correctly?
A. A guide zone is chosen from the map position. The legal zone is set by municipality, so on remote islands or near borders, check the public notice and change it if needed.
Q. Can I use the survey drawing reader?
A. You can use it now. Sign in with a free account (not available to guests). A free account can read up to 30 files a month, and paid plans allow more. It does not use AI credits.
Related pages
- For professionals — preliminary research for appraisal, survey, administrative and legal work
- Features — everything MAPRISE can do
- Layer catalog — the layers you can overlay