The August 2026 Chiba torrential rain and the September levee breaches around Lake Inba (Typhoon No. 25). We compared the flooded areas reported in the news with Meiji-era wetlands, geology, elevation, and the national flood and inland-flood inundation forecasts, to check how accurate the hazard maps were and where our own map falls short.
Hello, this is the MAPRISE development team.
We offer our deepest condolences to those who lost their lives in the August 2026 Chiba torrential rain and the September levee breaches around Lake Inba caused by Typhoon No. 25, and to their families and friends. Our heartfelt sympathies also go to everyone who is still living with the effects of flooding.
Purpose of this article
This article has two purposes.
- Raising awareness of disaster prevention. We use maps to check what kind of land the heavily damaged areas originally were.
- Comparing with published hazard maps. We compare the flood and inland-flood inundation forecasts published by the national and local governments with the flooded areas actually reported, and check how accurate they were.
We also want to be honest about how far MAPRISE's layers can take us in reading the history of the land, and where our own map still falls short.
What the public reports tell us
The flooding in Chiba came from two disasters of a different nature. The summary below is based on announcements by Chiba Prefecture and news reports. Figures differ depending on when and by whom they were compiled.
| Chiba torrential rain (urban, inland flooding) | Typhoon No. 25 (around Lake Inba) | |
|---|---|---|
| Period | August 13–14, 2026 | From September 22, 2026 |
| Main flooded areas | Chiba City Chuo Ward (Murata-cho, Soga, Kaname-cho), Inage Ward, Sakura City (Tamachi), Funabashi City, Oamishirasato City (around Oami Station) | Narita City (Funakata reclaimed land, Shimokata), Sakae Town in Inba District, Inzai City, Sakura City |
| Rainfall and water level | 115 mm in one hour and 367 mm in 24 hours in Chiba City | The Lake Inba water level reached 5.04 m, reported as the highest on record |
| Scale of damage | 13 deaths; more than 4,100 flooded buildings according to NHK (August 24) | At least 884 flooded homes (Chiba Prefecture, provisional figure as of September 24); about 5 square kilometers (estimated) flooded in Narita and Sakae, according to reports |
| Features | Inland flooding of roads, underpasses, and underground electrical equipment; river flooding such as the Murata River was also confirmed | The prefecture-managed levee of Kita-Inba-numa broke over about 100 m, and levees on the Kadokawa and Nagato rivers also partly broke |
The breach of the prefecture-managed Lake Inba levee is reported to be the first since the project was completed in 1969. The number of breach points varies: the prefecture's announcement names three (Kita-Inba-numa, the Kadokawa, and the Nagato), while news reports say three to four. A report dated October 11 also says that in some areas, flooding had not subsided even two weeks later.
How we compare, and what to keep in mind
Using the MAPRISE map, we look at the land of the reported flooded areas from four viewpoints.
- The Meiji-era state (layer: Meiji-era lowlands and wetlands)
- Geology (Geological Map (Seamless) and Flood Control Landform Classification Map)
- Elevation (Color-coded Elevation Map)
- Hazard maps (Flood Inundation Forecast, Planned Scale and Maximum Scale; Inland Flood Inundation Forecast)
Please note. This is a qualitative comparison made by eye, matching place names in the news with colors and shapes on the map. We did not overlay the actual flooded extent (such as inundation estimate maps published by the Geospatial Information Authority of Japan) as map data to compare areas. It does not give an exact overlap ratio.
1. The Meiji-era state — Lake Inba was larger, and surrounded by wetlands
First, a wide view around Lake Inba with the Meiji-era lowlands layer on.
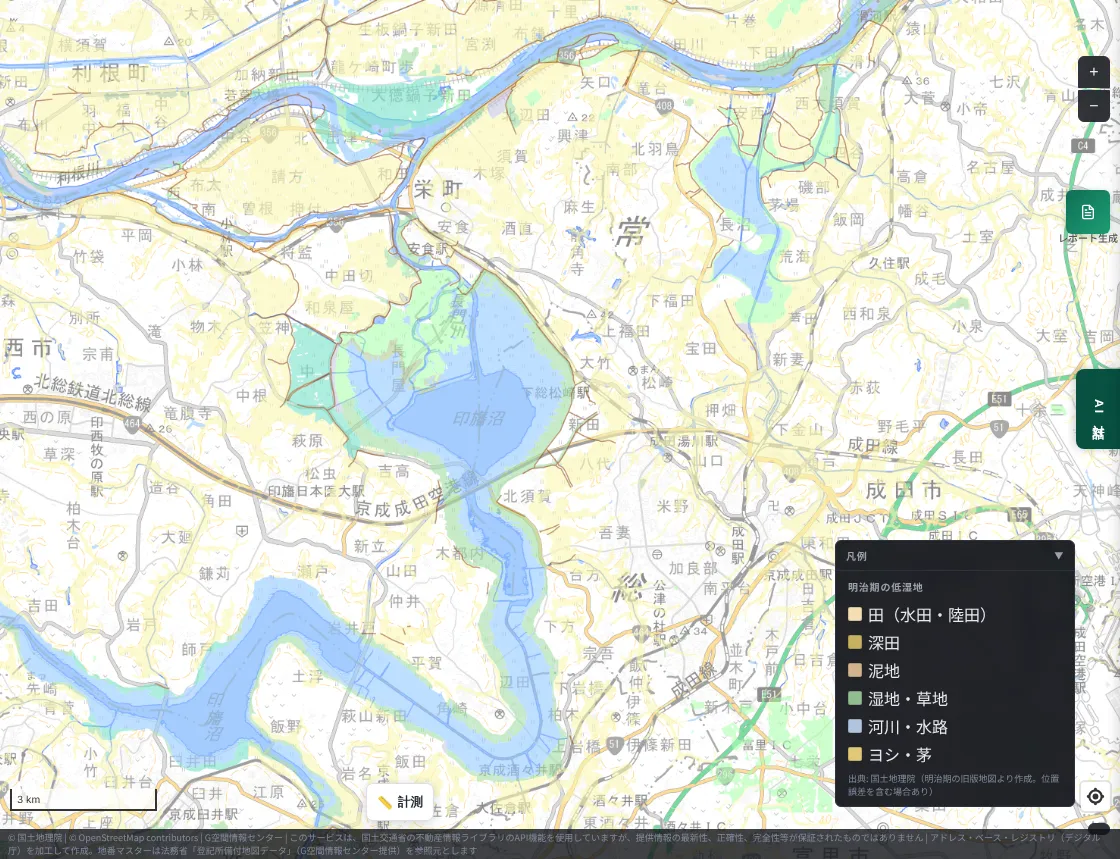
Light blue is Meiji-era rivers, channels, and water; green is wetland and grassland; yellow is paddy fields and similar land. The surroundings of Lake Inba, the Tone River banks, and the valleys extending north of Narita are widely shown as lowlands.
Now a closer look around Kita-Inba-numa and Sakae Town, where the levee broke.
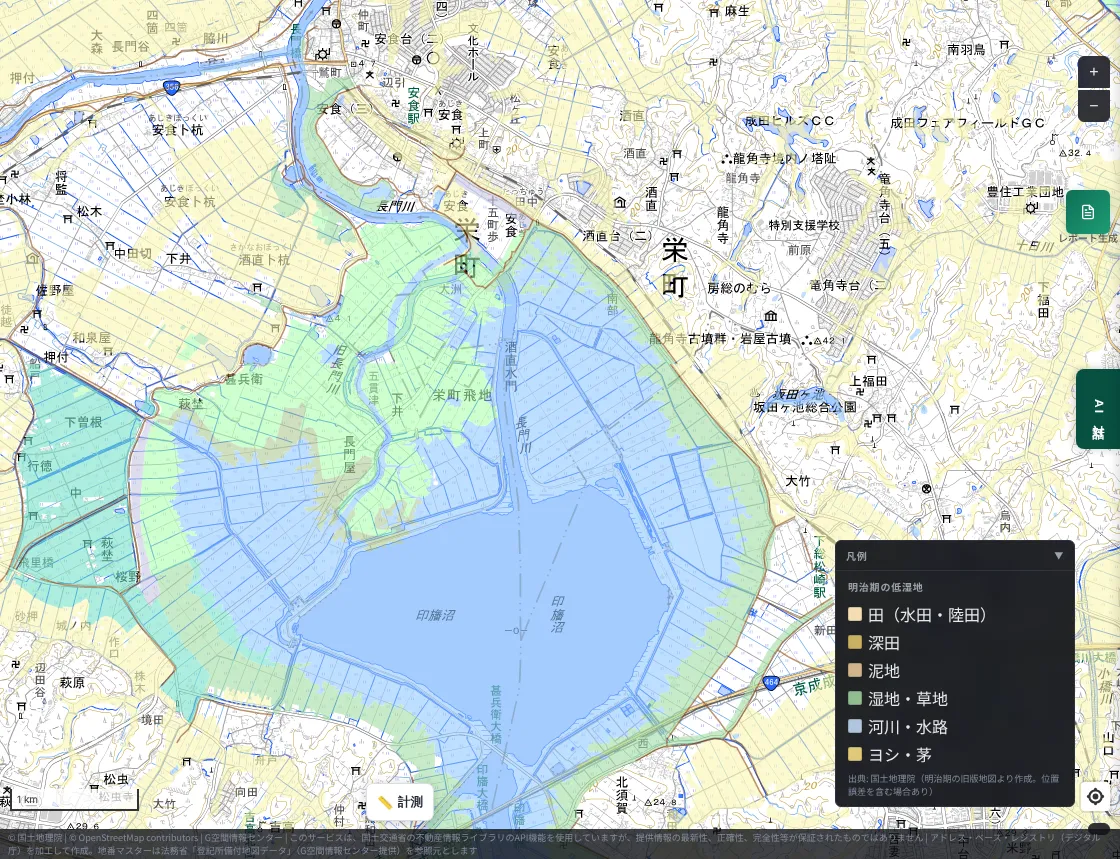
Around Kita-Inba-numa today there are grid-like paddies enclosed by embankments. On this screen, most of them were water or wetland in the Meiji era. Much of the land that is now farmland and housing was once lake and wetland.
Let us look at the Murata-cho area of Chiba City's Chuo Ward in the same way.
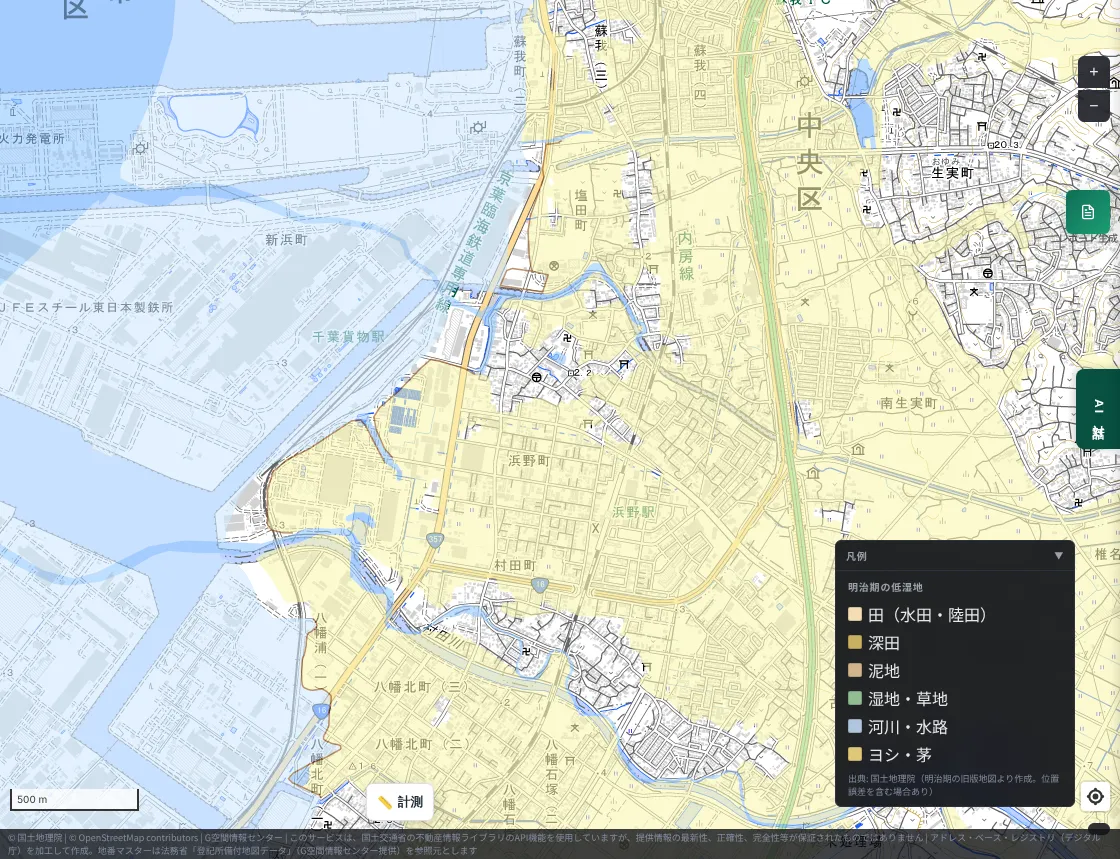
The inland side is solid yellow (paddy fields), and the seaward side, now lined with factories and a freight station, was water in the Meiji era. Murata-cho, which was hit in August, appears to be a built-up area on former paddy land.
What about around Tamachi in Sakura City (National Route 296)?
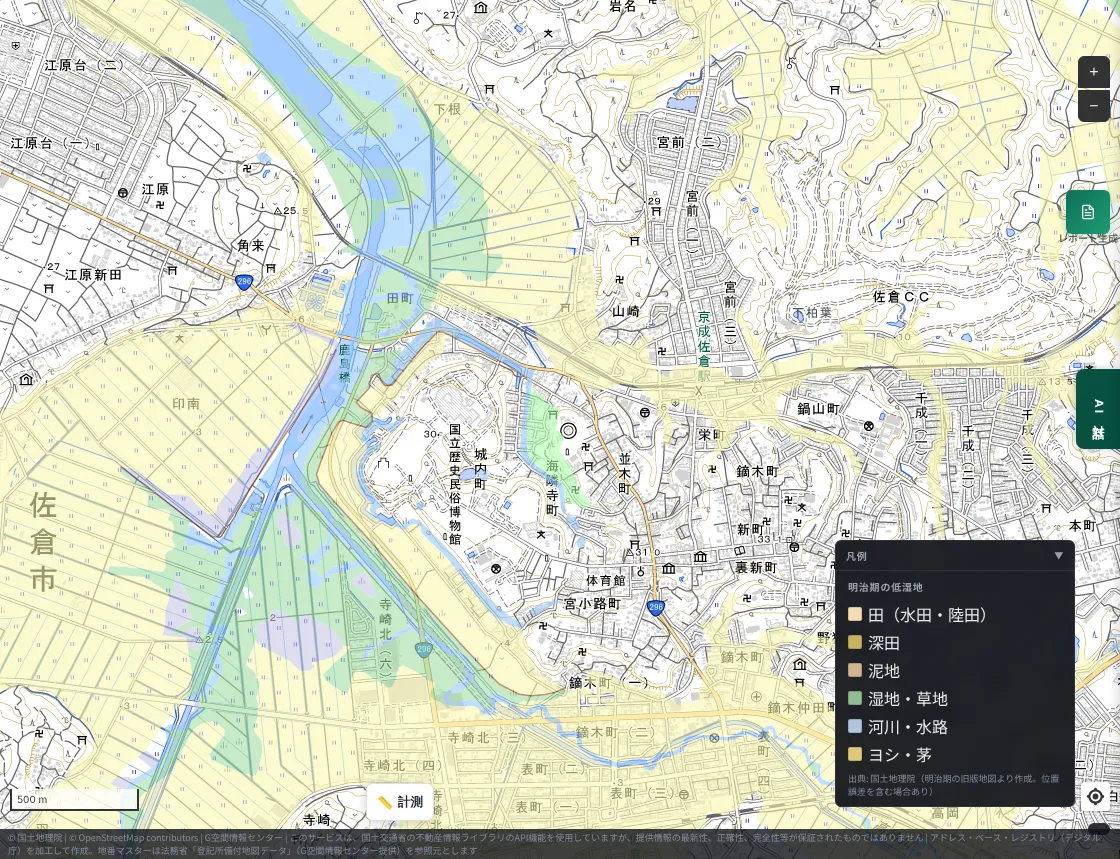
Wetland, grassland, and paddies continue like a belt along the Kashima River. The riverside lowland was a place where water gathered from the start.
2. Geology — the flooded lowlands rest on young sediments
This is the geological map (AIST Seamless Geological Map) around Lake Inba.
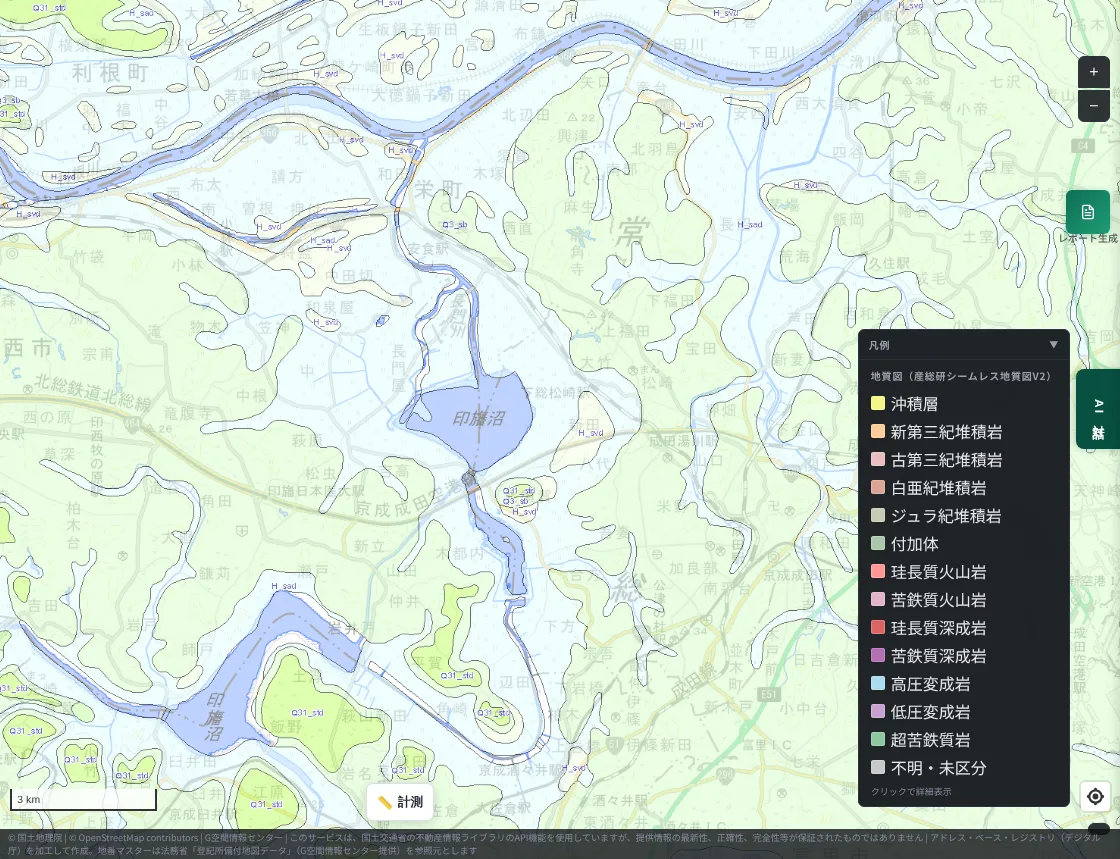
The pale blue areas are lowlands and the pale green areas are uplands. The lowlands branch along Lake Inba, the Nagato River, and the Tone River. The lowlands carry legend symbols starting with "H" and the uplands symbols starting with "Q3". These appear to correspond to Holocene (about 10,000 years ago to the present) and Late Pleistocene deposits respectively.
We clicked the geological map at points in the reported areas. At five lowland points — Sakae Town, Chiba City's Chuo Ward, Oamishirasato City, Sakura City, and northern Narita City — each returned "valley-floor plain, intermontane basin, river, and coastal-plain deposits," formed in the Holocene of the Quaternary Period of the Cenozoic Era. These are lands on relatively young, water-carried sediments.
We also looked at the Flood Control Landform Classification Map, which classifies terrain from a flood-control viewpoint.
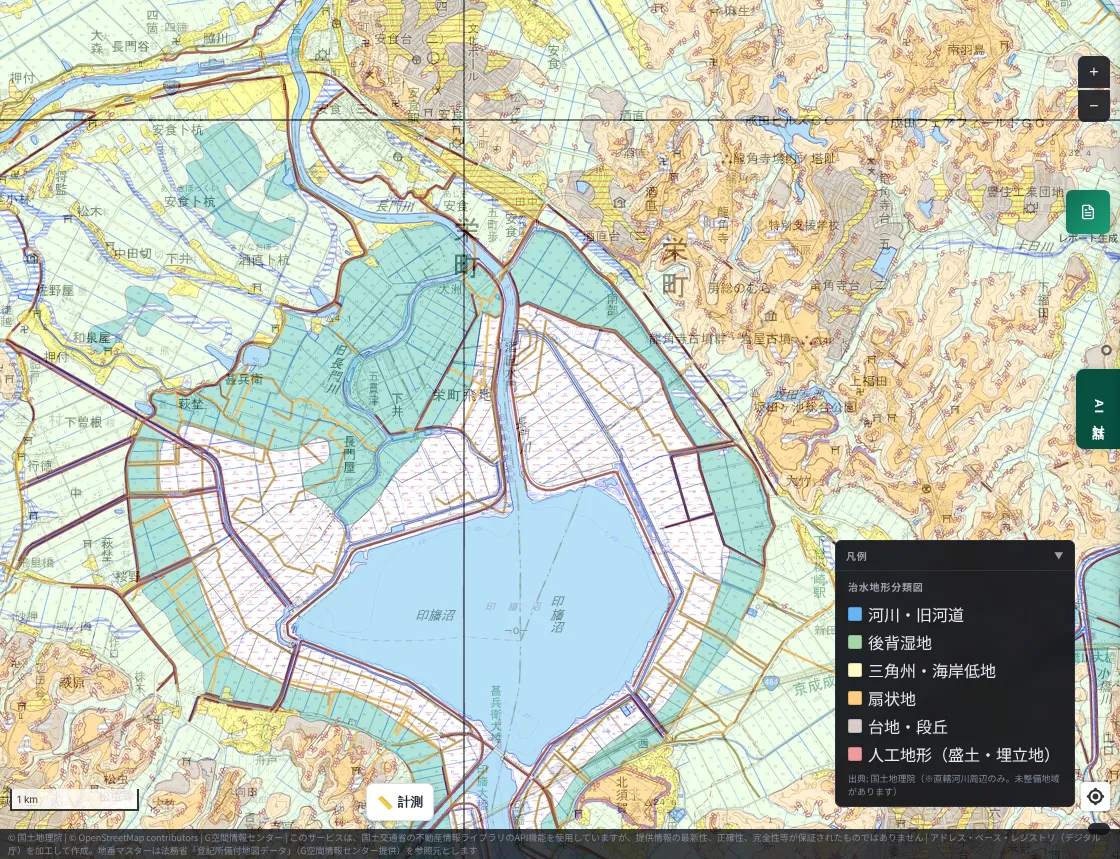
Around Kita-Inba-numa the land is occupied by back marsh (green) and artificial landform from reclamation (hatching). Back marsh is land where water tends to pool when a river floods. A blue band showing an old river channel is also visible northwest of the lake. The surrounding uplands and terraces, on the other hand, lie on higher ground.
3. Elevation — the land around the lake is a flat plain about 30 m below the uplands
Here is the Color-coded Elevation Map around Kita-Inba-numa. Blue-green is low and yellow-green is high.
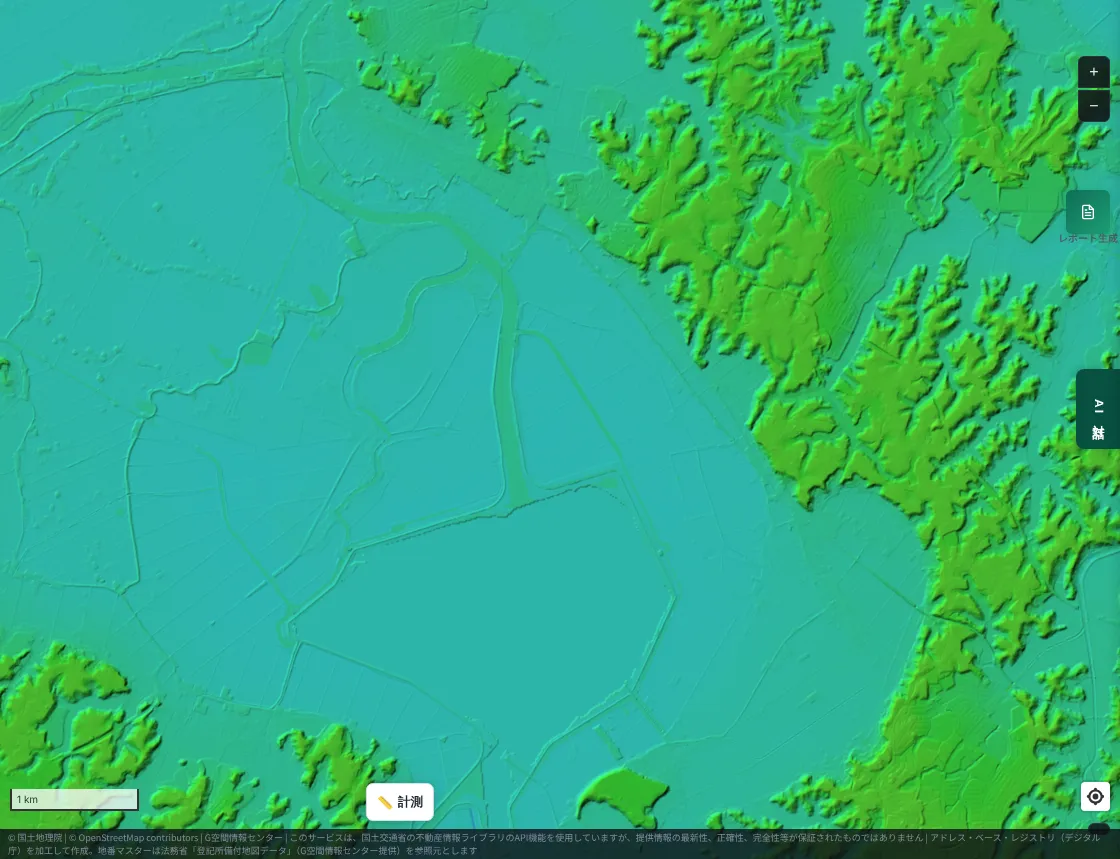
Around the lake is a blue-green plain with almost no relief, clearly separated from the uplands to the east.
We checked the elevation of representative points with the Geospatial Information Authority of Japan's elevation API (approximate values).
| Point | Approximate elevation |
|---|---|
| Sakae Town, lowland along the Nagato River | about 1–2 m |
| Reclaimed land on the west shore of Kita-Inba-numa | about 3 m |
| Upland near Ryukakuji | about 32 m |
| Upland in Narita City | about 34 m |
| Chiba City Chuo Ward, Murata-cho | about 2 m |
| Chiba City Chuo Ward, near Hamano Station | about 3 m |
Lowlands are 1–3 m and uplands are over 30 m. Even within the same town, the difference between lowland and upland is around 30 m, and the flood risk is completely different.
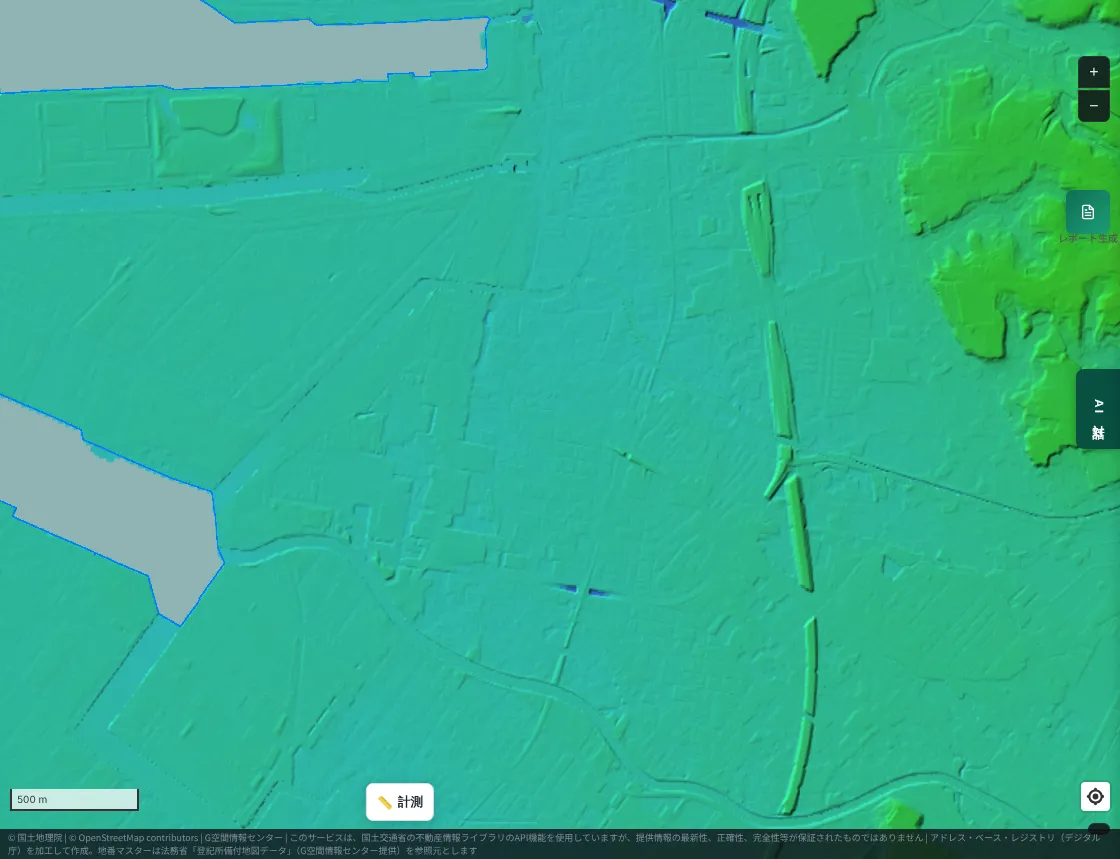
The Murata-cho area of Chiba City is likewise an almost flat plain.
4. Comparison with hazard maps
Finally, we compare the national flood inundation forecasts (MAPRISE displays data from the Ministry of Land, Infrastructure, Transport and Tourism's Hazard Map Portal Site) with the news reports.
Around Lake Inba: the flooded areas appear to roughly overlap the forecast areas
First, a wide view of the Flood Inundation Forecast (Maximum Scale).
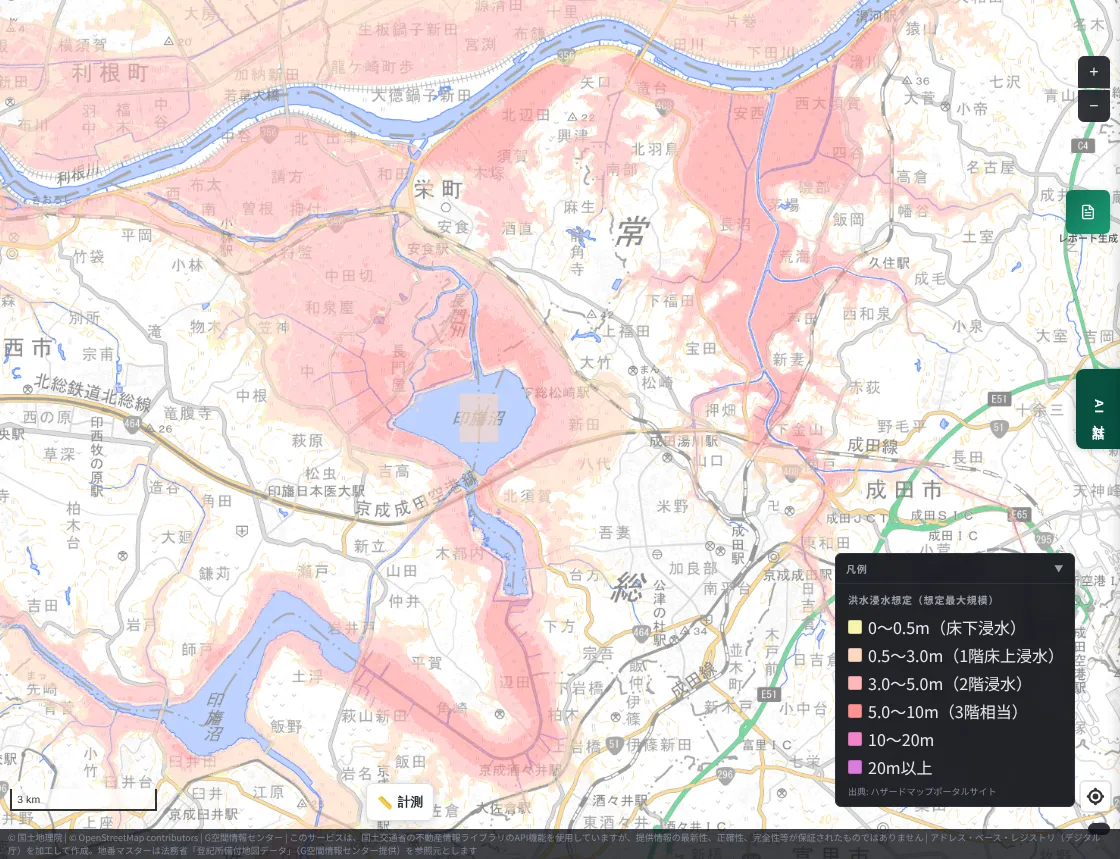
The lowlands along Kita-Inba-numa, Nishi-Inba-numa, the Nagato River, and the Tone River, and the valleys north of Narita, are widely inside the forecast area. This appears to roughly overlap the reports of flooding in the lowlands of Narita, Sakae, and Inzai.
Now a closer look around Kita-Inba-numa and Sakae Town. First, the maximum scale.
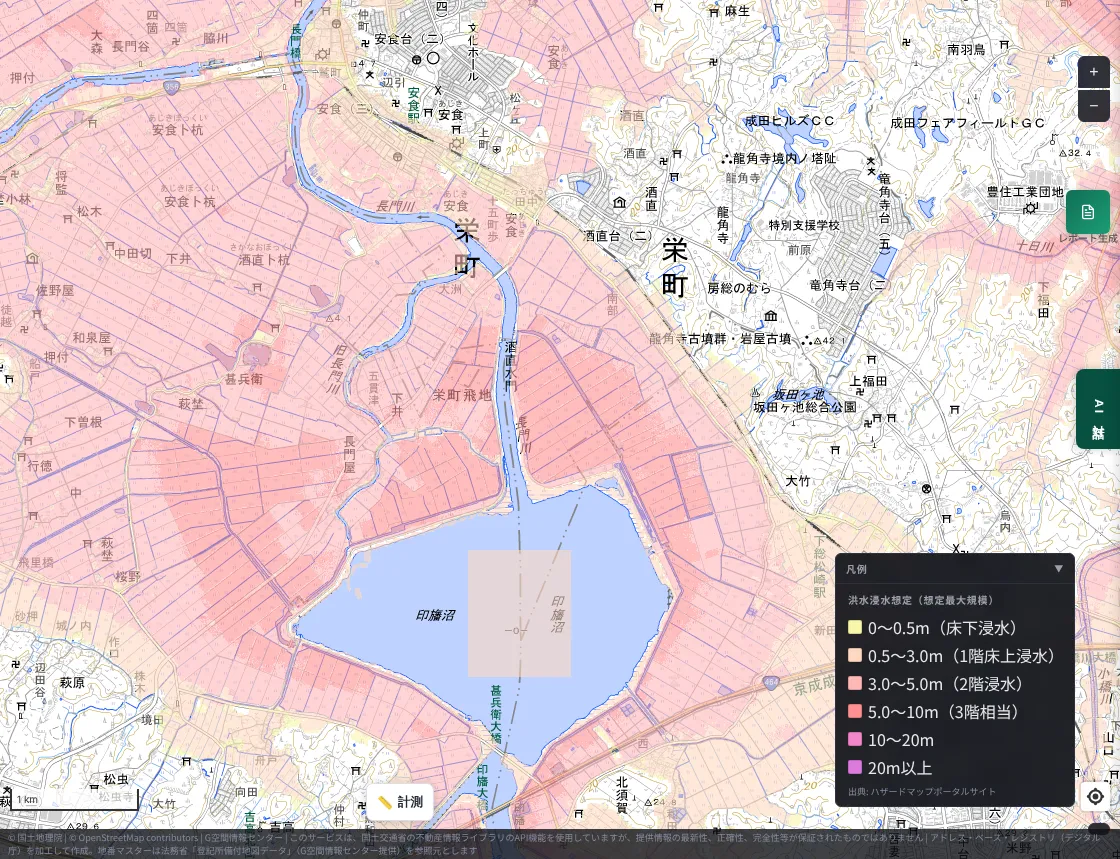
Next, the planned scale, which assumes more frequent rainfall.
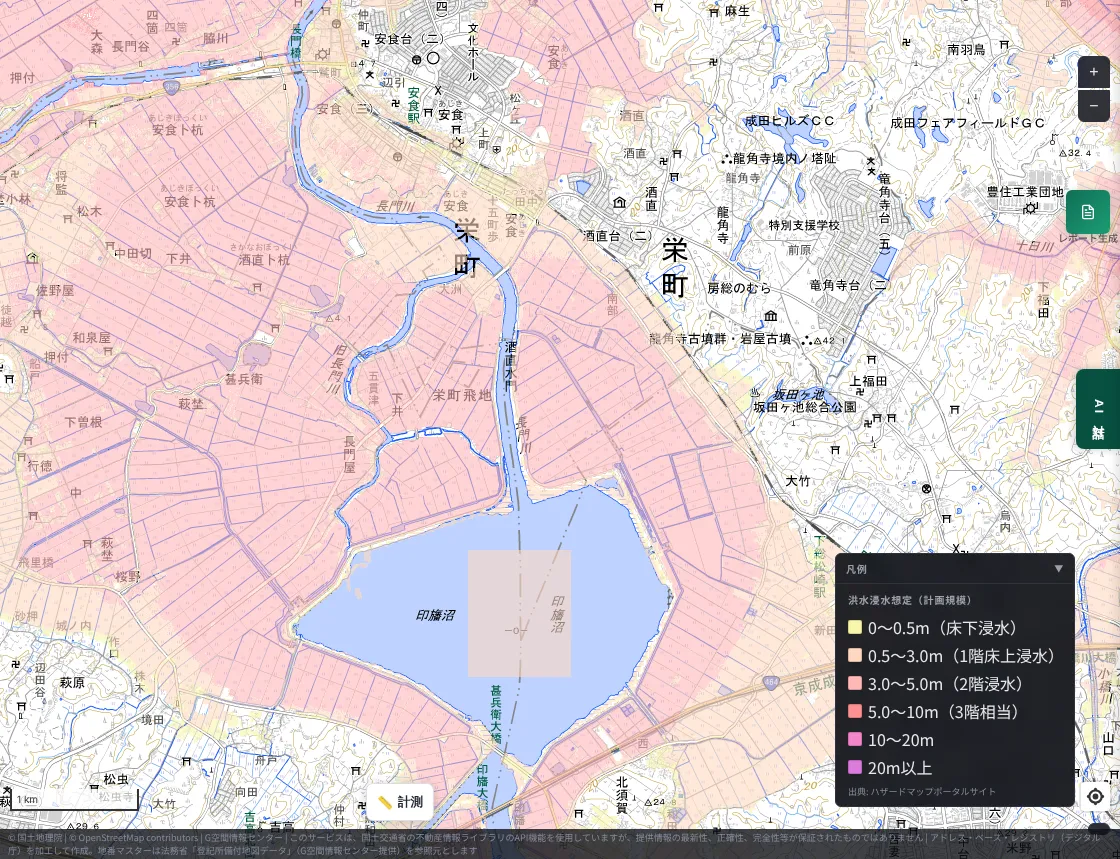
Even at the planned scale, almost the whole lowland around the lake is inside the forecast area. In this area, flooding was forecast not only for "rare, extreme rain" but also for more frequent heavy rain. This is consistent with the results from viewpoints 1–3: former wetland, young sediments, and low elevation.
However, a flood inundation map alone cannot tell where and when a levee will break, or how to communicate it to residents. The Chiba Nippo reported that information on the breaches was not shared promptly from Chiba Prefecture with Narita City and Sakae Town, causing confusion over evacuation. Knowing "dangerous places" on a map and building a system that delivers fast-changing information, such as a levee breach, appear to be separate challenges.
Chiba City: river-flood forecasts alone cannot capture urban flooding
What about the Murata-cho area of Chuo Ward? First, the maximum scale.
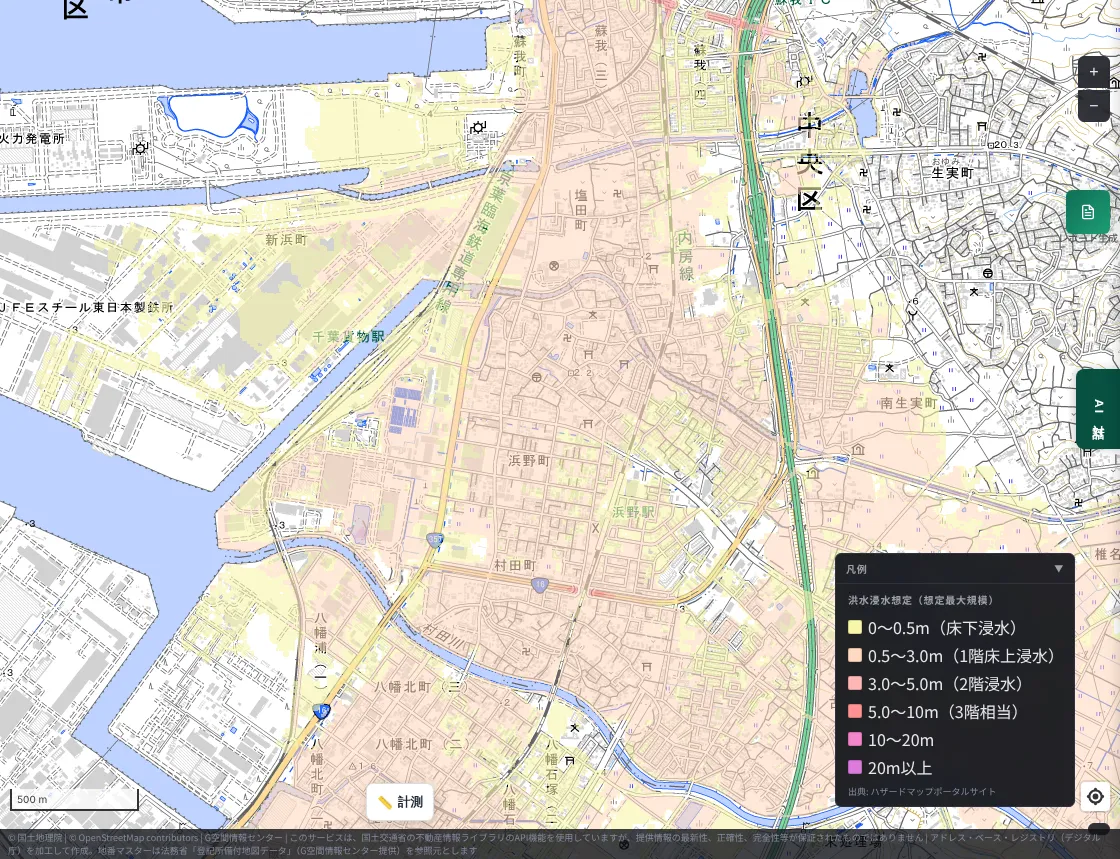
At the maximum scale, almost the entire inland side is covered in the color for roughly 0.5–3 m of flooding. The planned scale, however, looks like this.
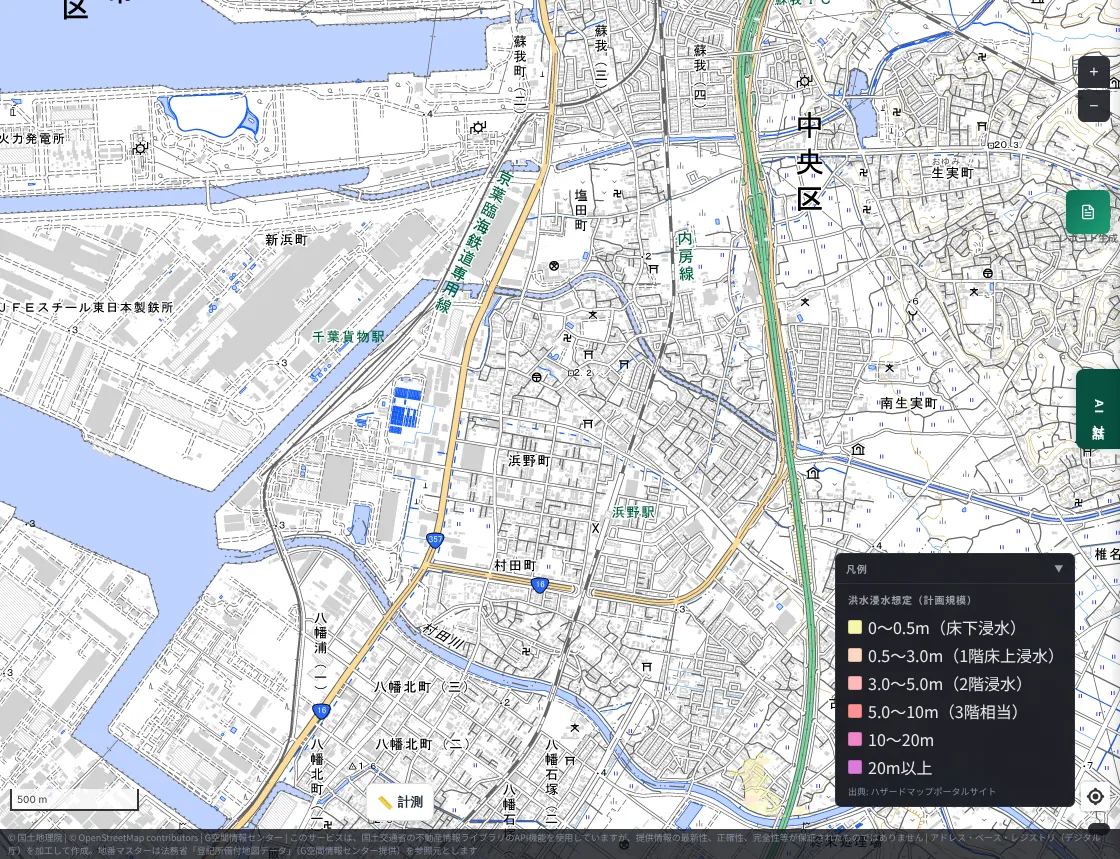
In the same area, no forecast color appears at all at the planned scale. Even if flooding is not forecast for the river-overflow rain of the planned scale, it is forecast widely at the maximum scale. The August rain was mainly inland flooding of roads and underpasses (flooding of the Murata River was also confirmed). River-flood forecasts alone appear to make it hard to read the danger of inland flooding in the middle of a city.
Inland flood forecasts, and reported flooding "outside the forecast area"
For inland flooding in urban areas, MAPRISE also has an Inland Flood Inundation Forecast layer. However, in the Chiba City area we captured, nothing was displayed.
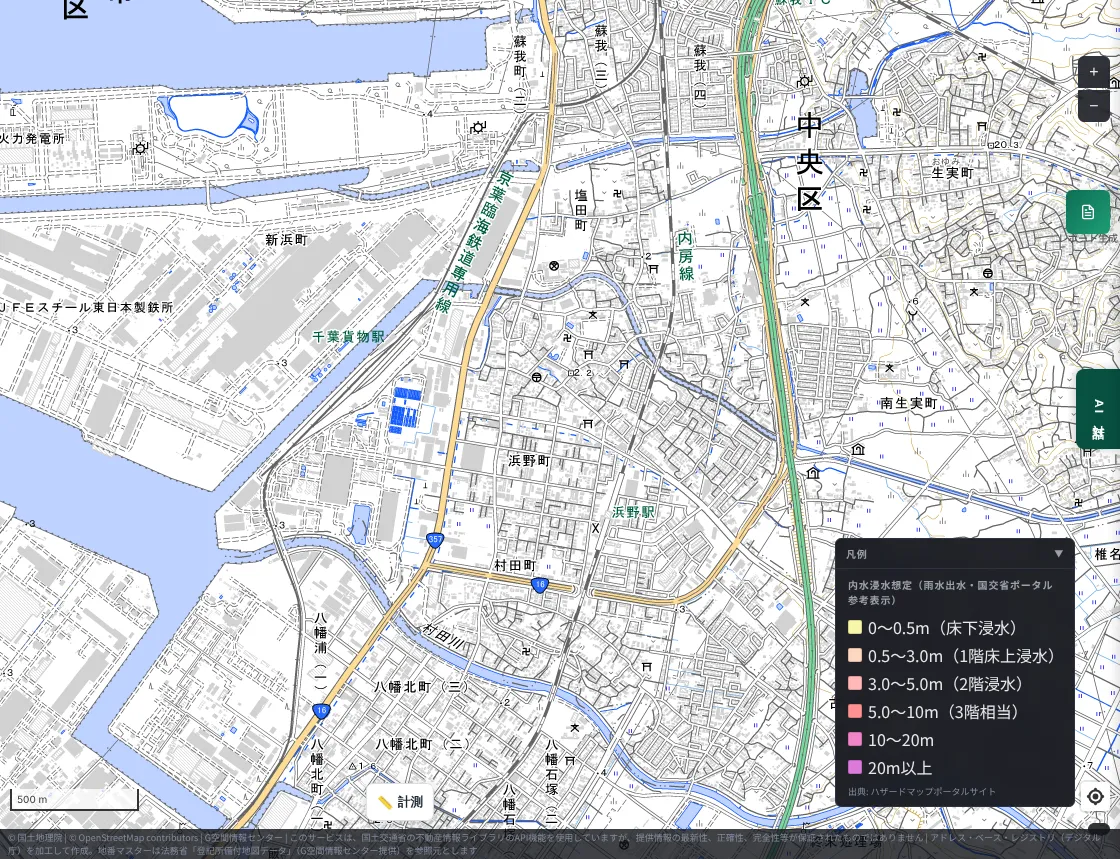
This is because the Inland Flood Inundation Forecast layer covers only a limited set of municipalities (the layer description also states that areas without data do not mean there is no inland flood risk). Meanwhile, a column by Tokio Marine dR introduces that Chiba City has published a rainwater drainage (inland flood) inundation forecast map assuming 153 mm of rain per hour. Chiba City's inland flood forecast is currently not viewable on MAPRISE. This is our own shortcoming, and we will consider expanding coverage.
The following points have been made about the accuracy of published forecasts.
- According to Tokio Marine dR's analysis, flooding was reported in Chiba City even outside the maximum-scale inland flood forecast area. The reason is thought to be that the actual distribution and intensity of rain differed from the assumption. Rainfall in Chiba City was 115 mm in one hour, about twice the 65.1 mm (priority areas) and 53.4 mm (general areas) assumed in the city's stormwater policy.
- In Oamishirasato City, the actual flooded area roughly matched the flood inundation forecast area of the Nanbuku River system south of the Sotobo Line, but the area north of it was outside the forecast area. Inland flooding and tributary flooding that had not been assumed are thought to have combined.
- An analysis by Weathernews (about 20,000 damage reports) is reported to suggest that about one in two affected people was outside the flood inundation forecast area. The method of analysis has not been published, however, so we do not know how "outside the area" was determined.
Around Tamachi in Sakura City
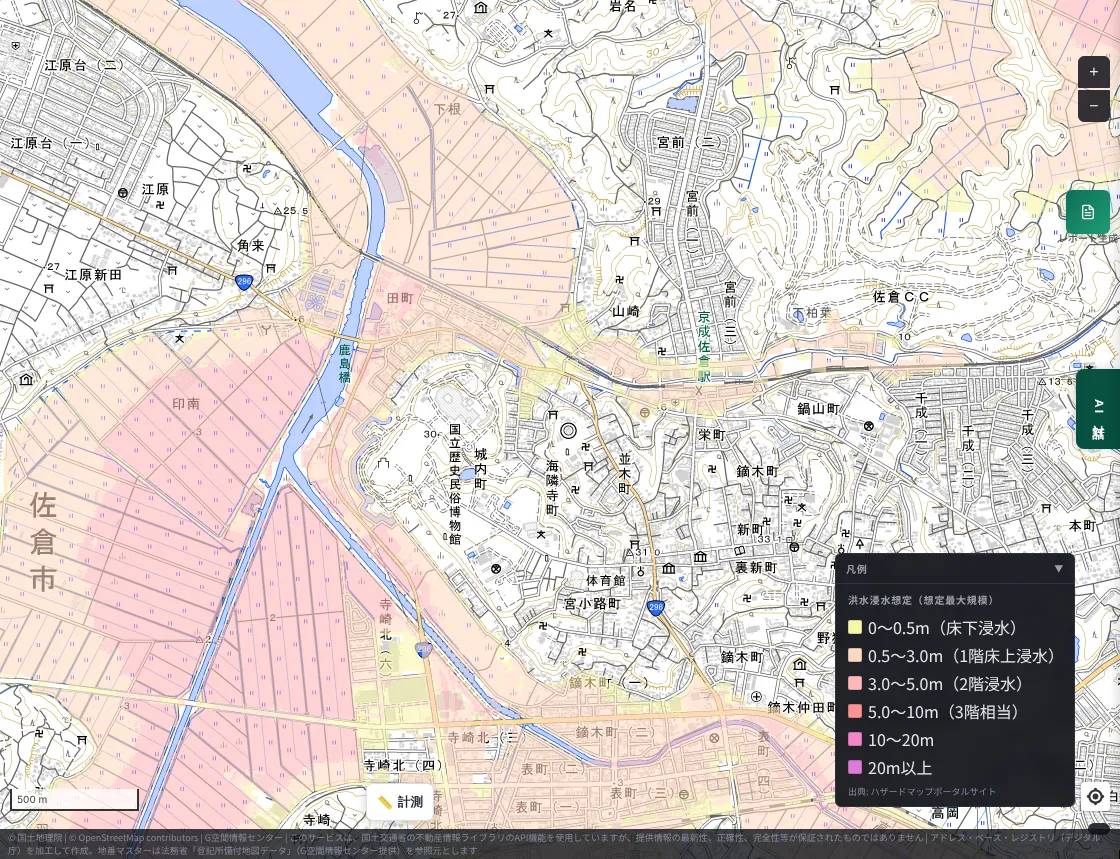
Tamachi in Sakura City, where a taxi was flooded on National Route 296 in the August rain, lies inside the forecast area along the Kashima River. Meanwhile, even within Sakura City, the top of the upland falls outside the forecast area. Here too, terrain and forecasts appear to correspond.
What the comparison showed
- The history of the land is a clue to flood risk. Meiji-era wetlands and water, Holocene sediments, and low elevation overlapped well with the reported flooded areas. On the reclaimed land around Lake Inba in particular, all four viewpoints pointed in the same direction.
- The national flood inundation forecast looked broadly sound for river flooding. Around Lake Inba, the area was inside the forecast even at the planned scale.
- Urban inland flooding cannot be captured by forecasts alone. In Chiba City, rain exceeding the assumption and flooding of unassumed forms are said to have occurred.
- Low land can flood even outside the forecast area. Being outside the area does not mean being safe.
- MAPRISE has shortcomings too. Its inland flood inundation forecast does not yet cover Chiba City.
What you can do in daily life
- Look at the land around your home or workplace not only through the forecast colors, but together with elevation, former land use (Meiji-era wetlands), and landform classification.
- Even outside forecast areas, water gathers in places lower than their surroundings, underpasses, and underground spaces.
- In heavy rain, check evacuation information from your local government together with real-time information such as river water levels. A hazard map is a map for "preparing in ordinary times."
- Disaster procedures differ by area. Be sure to check the hazard maps and disaster information published by your own municipality.
Limitations, stated honestly
- The comparison in this article is qualitative, matching place names in the news with the map. It is not an analysis that overlays the actual flooded extent as map data.
- The "Meiji-era lowlands and wetlands" layer was created by the Geospatial Information Authority of Japan from old Meiji-era maps and may contain positional offsets. It covers main plains only.
- The geological map, landform classification map, and color-coded elevation map are guides to how the land was formed. They do not guarantee the safety of any individual site.
- The flood inundation forecast is based on data from the Hazard Map Portal Site of the Ministry of Land, Infrastructure, Transport and Tourism and is a forecast under assumed conditions such as the pattern of rainfall. Please check the latest information in publications of your local government and the Ministry.
- Damage figures differ depending on when and by whom they were compiled. Please check the latest official announcements.
- The number and circumstances of the levee breaches are still being investigated and verified, and may be updated by future official announcements.
Closing
We sincerely pray for the swift recovery of everyone affected. We hope to treat this disaster as an opportunity to learn that floods can occur "even outside the forecast," and we will keep working so that MAPRISE's maps help people think about disaster prevention starting from the history of the land.
Questions and comments are welcome at info@maprise.jp.
Sources
- Regarding the breach of the Kita-Inba-numa levee / Chiba Prefecture
- Over 880 homes flooded as Lake Inba and others overflow (Jiji Press)
- Typhoon No. 25 breaks Lake Inba levee in three places, flooding wide areas including Narita (Livedoor News)
- Exclusive: Prefecture did not promptly share the breaches (Chiba Nippo Online via Yahoo! News)
- Feature: Levee breach at Lake Inba in Chiba, 28 years after the flood (TeNY via Yahoo! News)
- Lake Inba levee breach floods wide area (Tarosoku)
- Chiba torrential rain: two more deaths confirmed, toll at 13 (NHK)
- Chiba torrential rain: 13 dead, 4,139 buildings flooded (NHK)
- August 2026 Chiba torrential rain (Wikipedia)
- August 2026 Chiba torrential rain: overview of flood damage and preparing for urban flooding (Tokio Marine dR)
- August 2026 Chiba torrential rain: lessons from one in two being outside the forecast area (Fukushima Bosai HIH)
- Maps and data: Elevation API (Geospatial Information Authority of Japan) (processed and displayed in MAPRISE; providers and licenses are listed on our Data sources page, and the data you can view on the map on our Layer catalogue)
The maps in this article show MAPRISE's Meiji-era lowlands and wetlands (Geospatial Information Authority of Japan), Geological Map (Seamless) (National Institute of Advanced Industrial Science and Technology), Flood Control Landform Classification Map (Geospatial Information Authority of Japan), Color-coded Elevation Map (Geospatial Information Authority of Japan), and Flood Inundation Forecast and Inland Flood Inundation Forecast (Hazard Map Portal Site, Ministry of Land, Infrastructure, Transport and Tourism). The damage overview is based on announcements by Chiba Prefecture and news articles; figures change with the time of compilation. The comparison between flooded areas and map layers is qualitative and based on place names.
Tags: #Chiba #Lake Inba #Chiba heavy rain #Typhoon No. 25 #Hazard maps #Flood inundation forecast #Inland flooding #Meiji-era wetlands #Geology #Elevation #Disaster prevention
Other-language share text (exception cases)
Quick share above follows our platform-locked language policy (X-family in Japanese, LinkedIn in English). The four panes below let you grab the opposite-language body when needed — e.g. introducing an English post to a Japanese audience on X, or posting a Japanese article to LinkedIn in Japanese. Each pane offers both a copy button and a direct intent link.
📝 千葉の浸水地域を、MAPRISEの地図レイヤーで読み解く ― 明治期の低湿地・地質・標高・ハザードマップとの比較
2026年8月の千葉豪雨と、9月の台風25号による印旛沼周辺の堤防決壊。報道で伝えられた浸水地域を、明治期の低湿地、地質、標高、国の洪水・内水の浸水想定と見比べ、ハザードマップの精度と、私たちの地図の課題を確かめました。
https://maprise.jp/ja/blog/chiba-flood-2026-hazard-layers/ #千葉県 #印旛沼
🆕 新しいブログ記事を公開しました。

《千葉の浸水地域を、MAPRISEの地図レイヤーで読み解く ― 明治期の低湿地・地質・標高・ハザードマップとの比較》

2026年8月の千葉豪雨と、9月の台風25号による印旛沼周辺の堤防決壊。報道で伝えられた浸水地域を、明治期の低湿地、地質、標高、国の洪水・内水の浸水想定と見比べ、ハザードマップの精度と、私たちの地図の課題を確かめました。

👉 詳しくはこちら: https://maprise.jp/ja/blog/chiba-flood-2026-hazard-layers/
📝 Reading Chiba's Flooded Areas with MAPRISE Layers — Meiji-Era Wetlands, Geology, Elevation, and Official Hazard Maps
The August 2026 Chiba torrential rain and the September levee breaches around Lake Inba (Typhoon No. 25). We compar…
https://maprise.jp/en/blog/chiba-flood-2026-hazard-layers/ #Chiba #LakeInba
🆕 New on the MAPRISE blog.

《Reading Chiba's Flooded Areas with MAPRISE Layers — Meiji-Era Wetlands, Geology, Elevation, and Official Hazard Maps》

The August 2026 Chiba torrential rain and the September levee breaches around Lake Inba (Typhoon No. 25). We compared the flooded areas reported in the news with Meiji-era wetlands, geology, elevation, and the national flood and inland-flood inundation forecasts, to check how accurate the hazard maps were and where our own map falls short.

👉 Read the full post: https://maprise.jp/en/blog/chiba-flood-2026-hazard-layers/

#Chiba #LakeInba #Chibaheavyrain #TyphoonNo.25 #Hazardmaps
Related posts
- Rivers That Flow Above the City — Ceiling Rivers (Tenjogawa) and Living Behind a Levee (Hanshin, Shiga, Nagoya, and Tokyo's Arakawa)2026-10-12
- Did the Rich Move Uphill to Avoid Floods? Testing 'Yamanote vs Shitamachi' in Tokyo, Nagoya, Osaka and Fukuoka with Four Maps2026-10-24
- Reading Takeda Shingen's Flood Control and the Shingen Levee on a Map ― Ryuo's Terrain, Meiji-Era Paddies and Kai City Today (MAPRISE)2026-10-13