Japan has an old saying: the wealthy live in the 'Yamanote' (uptown hills) and ordinary people in the 'Shitamachi' (lowland downtown). Did the rich simply move to high ground to avoid floods? We lined up elevation, land prices, crime and zoning in MAPRISE's 4-way split view for four cities, with numbers.
Hello from the MAPRISE development team.
In Japan people say, "the wealthy live in the Yamanote, ordinary people in the Shitamachi." Every time I hear it I wonder about one simple thing: did wealthy families build on hills and high ground to stay out of the flood?
This time we checked that with MAPRISE maps. In each of Tokyo, Nagoya, Osaka and Fukuoka we picked a frame that contains both high and low ground, and lined up four layers in the 4-way split view:
- Top left: colour-coded contours (elevation). Warm colours (red, brown) are high; cool colours (blue, green) are low.
- Top right: land prices, from MLIT's Official Land Prices and Prefectural Land Price Survey (2024), coloured by price.
- Bottom left: crime occurrences, from National Police Agency open data.
- Bottom right: zoning. Green and blue shades are exclusively residential zones; pink is commercial.
The short version: the idea that exclusively residential districts gather on high ground showed up clearly in Tokyo, Nagoya and Fukuoka. But "land is pricier on high ground" did not hold: in all four cities the highest land prices were in commercial districts around stations on low ground. Whether floods were the reason cannot be settled from a map. Details below.
First: where "Yamanote" and "Shitamachi" come from, and where the flood theory stands
As far as we could find, the picture is this:
- Edo/Tokyo's "Yamanote" is the eastern edge of the Musashino Plateau; "Shitamachi" is the Tokyo lowland. In early Edo, the castle and samurai estates were placed on the plateau and merchant quarters on reclaimed lowland.
- However, we found no historical source that says people moved uphill specifically to avoid floods. The placement of estates is usually explained by distance from the castle and rank.
- The plateau was also a hard place to get water. The Tamagawa Aqueduct (1653) ran along high ground to bring water into the city, while wells on reclaimed lowland are said to have turned brackish.
- From the mid-Edo period, land ran short: samurai estates appeared in the lowlands and merchant districts in the uptown, and the "high ground = samurai, low ground = townspeople" pattern blurred.
- After the Meiji Restoration, former samurai estates passed to officials, military officers and business leaders. In the Hanshin area, railways, views and health ("healthy country living") are said to have driven the housing boom at the foot of the Rokko mountains.
So "uphill to avoid floods" is easy to understand, but we could not find solid support for it. Water supply, distance from the castle, railways, views, ground conditions and hygiene all seem to have played a part. This summary is based on public materials and explanations; we could not check every primary source.
Instead of history, then, we look at what today's map shows.
The frames, and how the numbers were made
Each city's four maps cover the same area of roughly 10 km east–west by 5.5 km north–south (see the scale bar at the lower left of each pane). Colours are assigned automatically within each view, so you cannot compare colours between cities: the pale green in Osaka is as low as the blue in Tokyo.
On top of the maps, we computed:
- Elevation: from the Geospatial Information Authority of Japan's elevation API, point by point.
- Land prices: for each point on screen, the median price per square metre by elevation band. "Residential" points mention housing and not shops or offices; "commercial" points mention shops, offices, banks, hotels and the like.
- Crime: the number of occurrence points per roughly 400 m grid cell, averaged by elevation band.
- Zoning: the zone at each cell's centre, as a share by elevation band.
Elevation bands are under 5 m, 5–15 m and 15 m or more.
1. Tokyo: residential districts on the plateau, commercial districts on the lowland
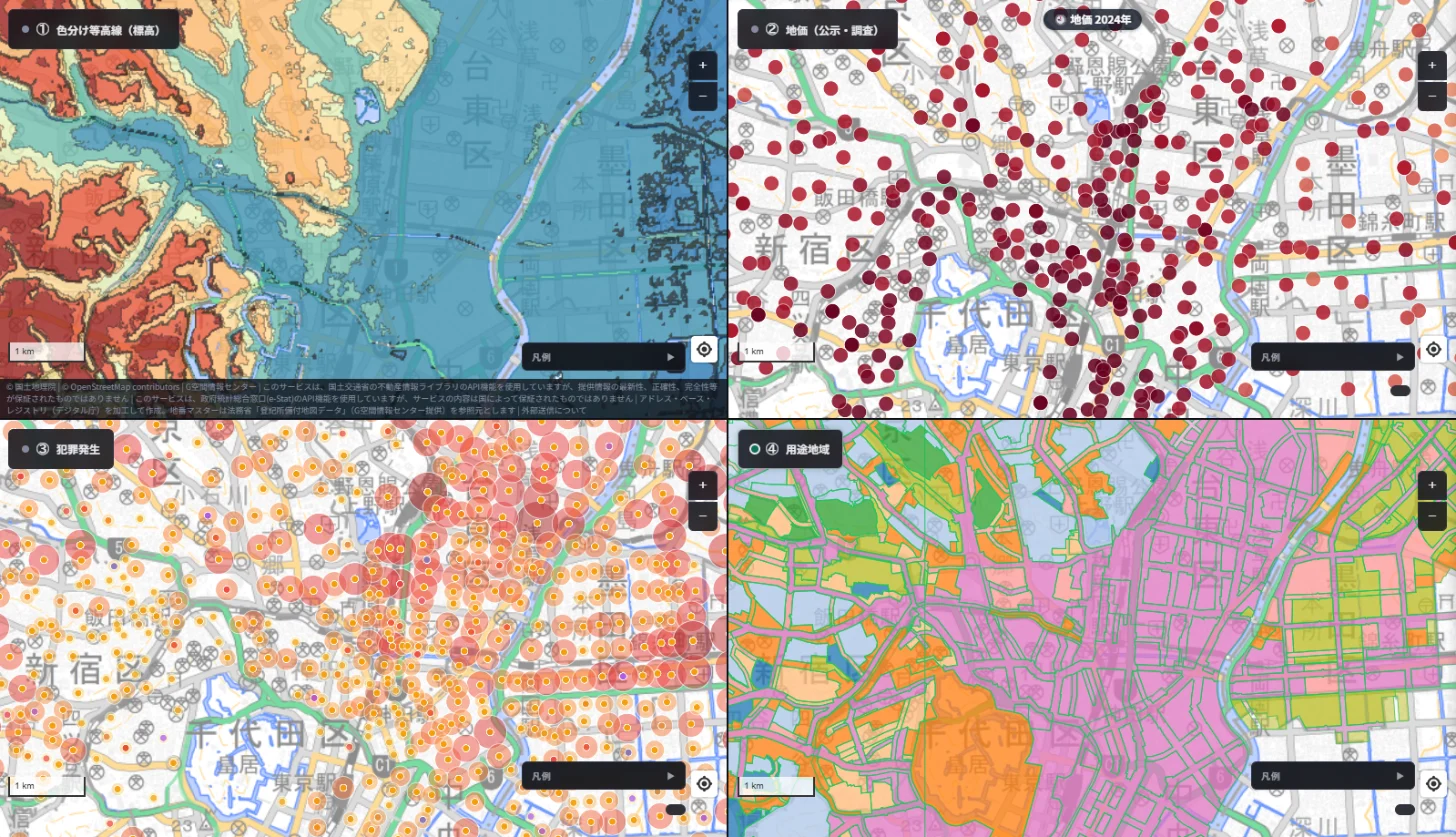
Representative points: Bancho is about 30 m, Hongo about 23 m and Mejiro about 25 m. Nihonbashi and Ginza are about 4 m, and so is Asakusa.
- Elevation: the plateau (Shinjuku and Bunkyo side) is red-brown, cut by valleys; Taito and Sumida in the east are blue lowland. "Yamanote" and "Shitamachi" are clearly separate landforms.
- Land prices: the dark red dots (highest prices) cluster from Marunouchi through Nihonbashi and Ginza, on lowland. There are points on the plateau too, but in lighter colours.
- Crime: large circles appear more often from the centre toward the east (Chuo and Taito side), where downtown districts sit.
- Zoning: the plateau has noticeable Category 1 low-rise (dark green) and mid/high-rise (blue) exclusively residential zones. The lowland is mostly pink commercial, with some industrial zones.
In numbers:
- Share of exclusively residential zones: 43% at 15 m or more, 11% at 5–15 m, 0% below 5 m.
- Median residential land price: about 670,000 yen/m² below 5 m, about 1.1 million at 5–15 m and about 1.44 million at 15 m or more. It rises with height (13, 9 and 39 points).
- The highest commercial price was about 37.6 million yen/m² on lowland below 5 m, against about 7.7 million at 15 m or more.
- Crime points per cell: 17.0 below 5 m, 8.7 at 5–15 m, 5.8 at 15 m or more.
Tokyo fits the "wealthy housing on high ground" idea best. Even so, the highest land prices are in lowland office districts, not on the hills.
2. Nagoya: Sakae sits on a plateau, Nagoya Station on low ground, hills to the east
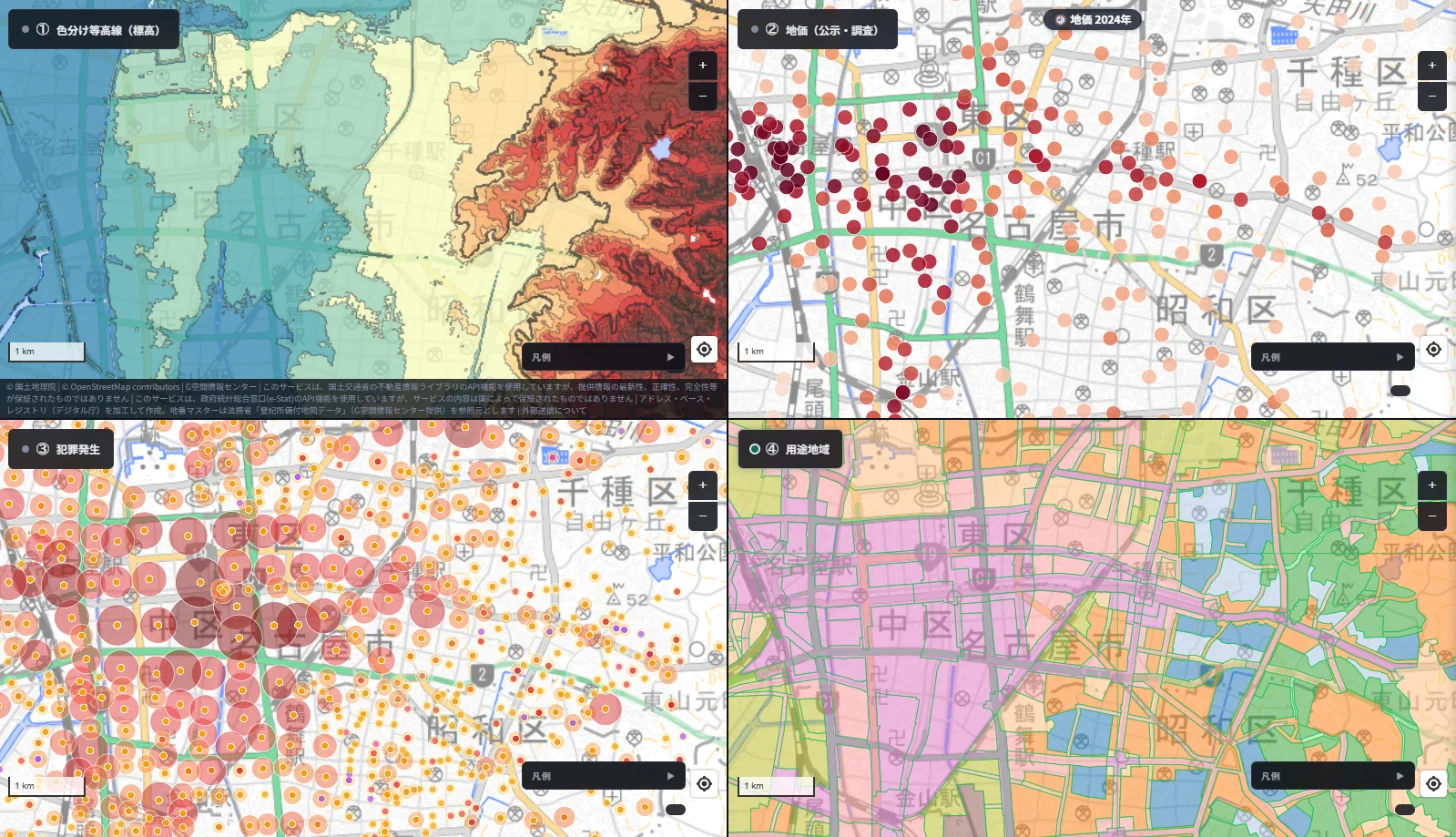
Representative points: Nagoya Station is about 2 m, Sakae about 13 m, Nagoya Castle about 12 m and Kakuozan in the east about 48 m.
- Elevation: from west to east it steps up: lowland, a plateau (the level of Nagoya Castle and Sakae), then hills (Higashiyama, Kakuozan).
- Land prices: dark dots cluster around Nagoya Station and Sakae. The eastern hills are pale.
- Crime: large circles gather in the downtown from the station to Sakae (left side); in the east only small circles are scattered.
- Zoning: pink commercial on the left; green, blue and other residential zones across the eastern hills.
In numbers:
- Share of exclusively residential zones: 41% at 15 m or more, 5% at 5–15 m, 0% below 5 m.
- Median residential land price: about 240,000 yen/m² below 5 m (12 points), about 410,000 at 5–15 m (17) and about 330,000 at 15 m or more (50). There is almost no relationship with elevation (rank correlation −0.11).
- The highest commercial price: about 19.9 million yen/m² below 5 m, about 1.7 million at 15 m or more.
- Crime points per cell: 18.6 below 5 m, 26.6 at 5–15 m, 5.8 at 15 m or more.
What stands out in Nagoya is that Sakae, the city centre, is not on lowland but on a plateau (about 13 m). The low ground is around Nagoya Station. "Low ground = ordinary people" simply does not fit here.
3. Osaka: the height of the Uemachi Plateau, and commercial districts on the lowland
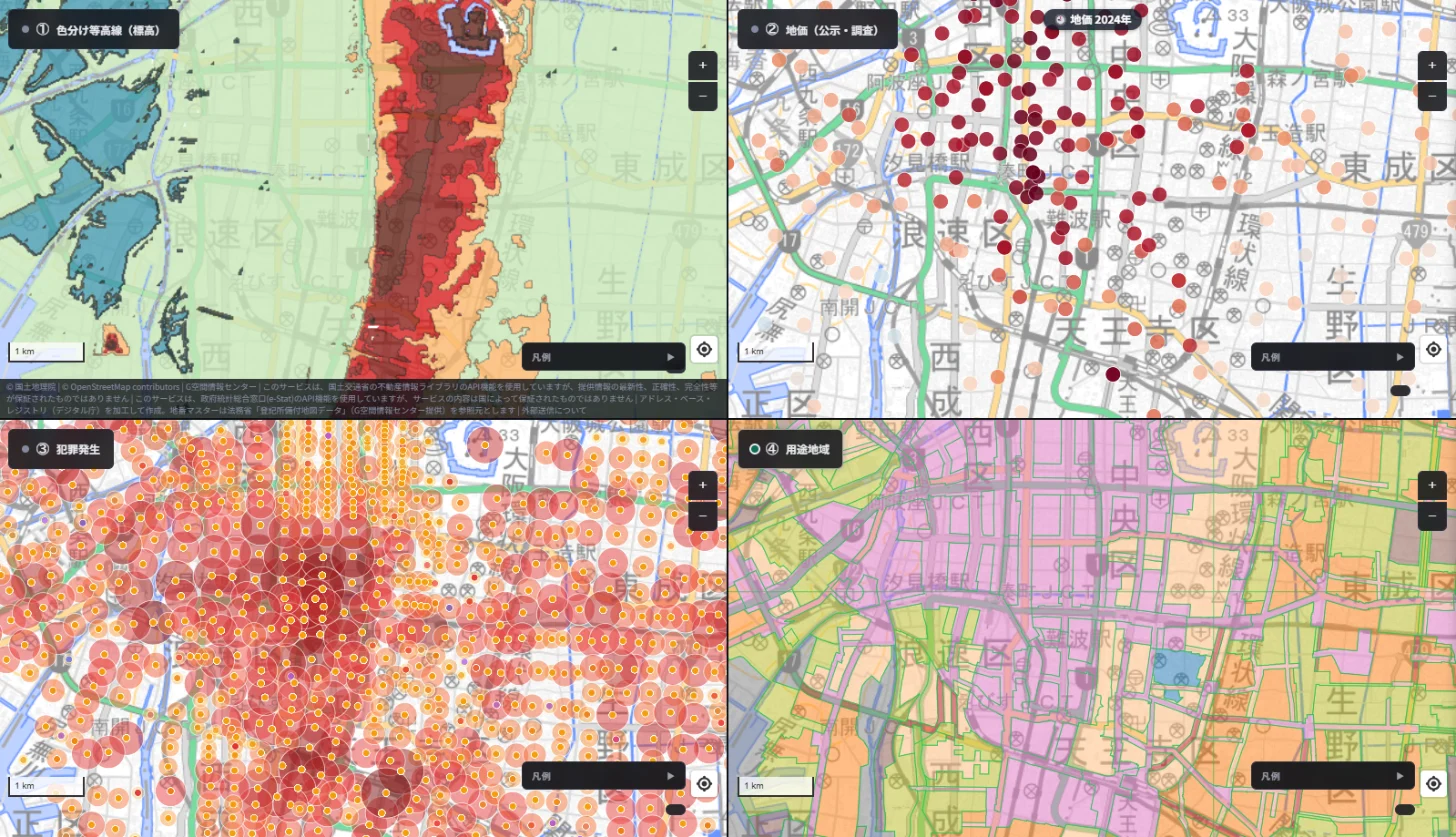
Representative points: Osaka Castle is about 38 m and Tennoji about 17 m. Umeda is about 0.4 m, Hommachi about 2 m and Namba about 3 m.
- Elevation: the north-south red-brown band is the Uemachi Plateau. Semba and Namba to the west are almost at sea level, and the blue patches are the lowest spots.
- Land prices: the dark dots cluster not on the plateau but on the lowland west of it, from Semba to Namba.
- Crime: large circles gather around Namba (lowland).
- Zoning: the lowland has broad commercial and industrial zones; the plateau mixes residential and commercial. Exclusively residential zones such as Category 1 low-rise are nearly absent from this frame.
In numbers:
- Median residential land price: about 260,000 yen/m² below 5 m (46 points), about 660,000 at 5–15 m (8) and about 680,000 at 15 m or more (5). The upper bands have few points, so treat them as a rough guide (rank correlation +0.19).
- The highest commercial price: about 25.8 million yen/m² below 5 m, about 4.2 million at 15 m or more.
- Crime points per cell: 41.4 below 5 m, 32.6 at 5–15 m, 33.1 at 15 m or more, so there is little visible difference by elevation.
Osaka shares the pattern of high land prices in lowland commercial districts, but crime is not noticeably lower on the plateau, so "high ground is quiet" cannot be asserted from this result.
4. Fukuoka: housing on the hills is actually priced lower
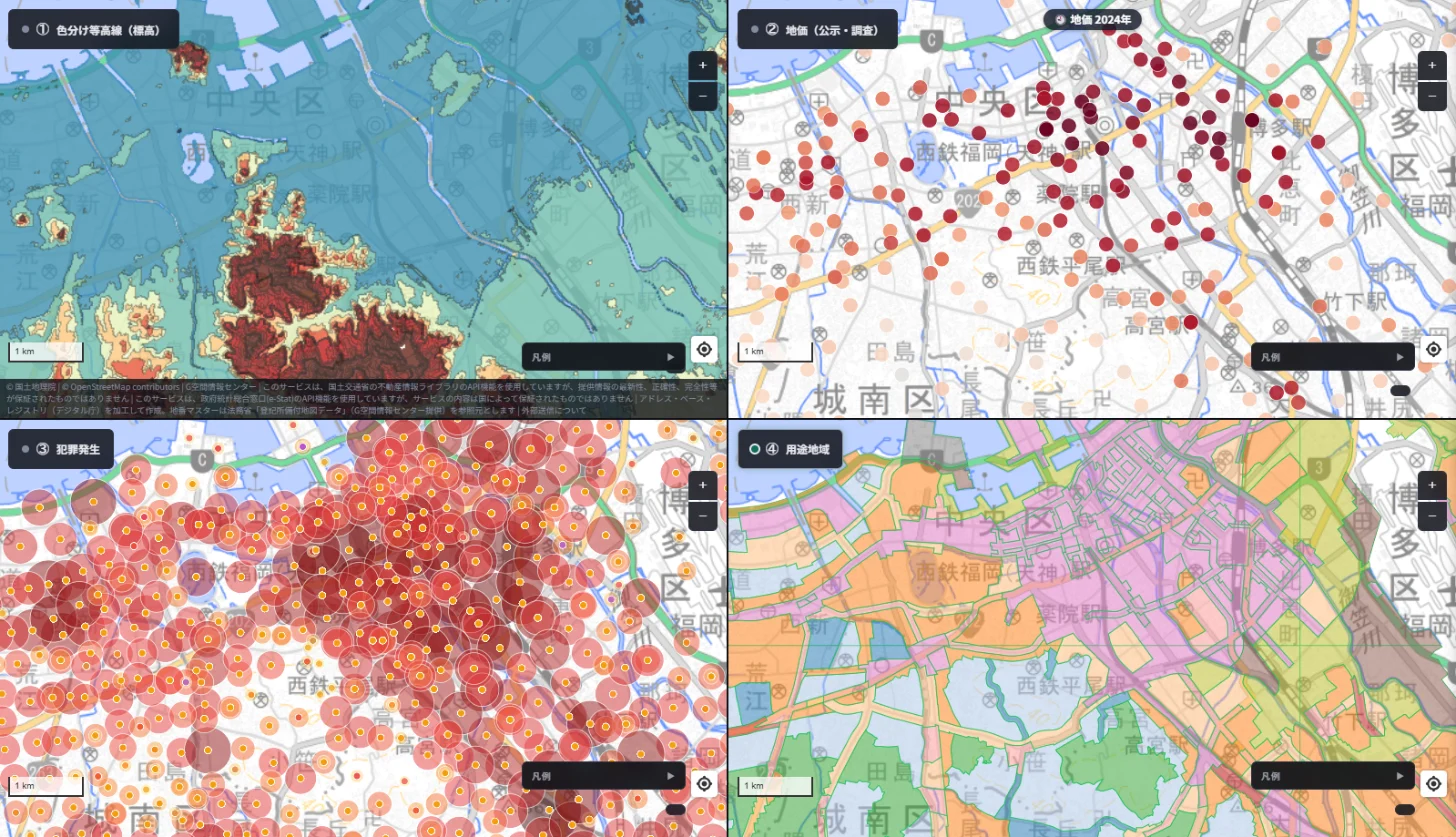
Representative points: Takamiya is about 35 m and Sakurazaka about 25 m. Tenjin and Ohori Park are about 4 m, Hakata Station about 4 m, and Nishijin and Yakuin about 3 m.
- Elevation: central Fukuoka is nearly flat lowland along Hakata Bay. Hills spread in red-brown to the south around Takamiya and Hirao.
- Land prices: the dark dots cluster on the lowland from Tenjin to Hakata Station. The hills look pale.
- Crime: large circles concentrate around Tenjin, Nakasu and Hakata Station.
- Zoning: commercial pink in the north; exclusively residential green and blue across the southern hills.
In numbers:
- Share of exclusively residential zones: 93% at 15 m or more, 17% at 5–15 m, 10% below 5 m. Of the four cities, this is where exclusively residential districts are most concentrated on high ground.
- Median residential land price: about 560,000 yen/m² below 5 m (44 points), about 280,000 at 5–15 m (40) and about 200,000 at 15 m or more (19). The lower the ground, the higher the price (rank correlation −0.65).
- Crime points per cell: 76.6 below 5 m, 41.5 at 5–15 m, 12.4 at 15 m or more.
Fukuoka shows "quiet residential hills," but not "higher ground, higher prices." Residential land in the lowland near Tenjin and Yakuin is priced higher, and in this frame those city-centre points outrank the hillside housing.
The four cities at a glance
| Tokyo | Nagoya | Osaka | Fukuoka | |
|---|---|---|---|---|
| Exclusively residential share (15 m+ / under 5 m) | 43% / 0% | 41% / 0% | 4% / 0% | 93% / 10% |
| Residential price trend | Rises with height | Almost none | Rough guide only (few points) | Lower ground is pricier |
| Elevation band of the highest commercial price | Under 5 m | Under 5 m | Under 5 m | Under 5 m |
| Crime points (per cell) | More on lowland | More on lowland and plateau, fewer in hills | Little difference | More on lowland |
Testing the hypotheses: what can and cannot be said
Hypothesis 1: High ground gathers calm, exclusively residential districts. Clearly supported in Tokyo, Nagoya and Fukuoka. In Osaka, the Uemachi Plateau is narrow and exclusively residential zones are scarce in this frame, so we could not confirm it.
Hypothesis 2: Where the wealthy live, meaning where land is expensive, is high ground. Not supported as stated. In all four cities the highest prices were in lowland commercial districts near stations. Even for housing alone, price tracks elevation only in Tokyo; the link is weak in Nagoya and reversed in Fukuoka. Note also that land price is the price of land, not a measure of wealth.
Hypothesis 3: Lowlands have more crime. Counts looked higher on the lowland in Tokyo, Fukuoka and Nagoya. But that is most naturally explained by stations, entertainment districts and crowds being there, not by elevation itself. Counts also depend on resident numbers and foot traffic, so they do not compare the safety of areas.
Hypothesis 4: People moved uphill to avoid floods. Low ground is more prone to flooding, so the idea is plausible. But we did not overlay flood history or flood hazard maps here, and we found no historical source citing floods as the reason. My own view is that floods may have been one reason, but they cannot be the whole explanation. Water supply, views, ground, railways, hygiene and who took over the land after the Meiji period all seem to have combined into today's map.
More to the point, a map shows only what happens to be on high ground today. It cannot tell us why people chose to live there.
Limits of this article
- Each city is one screen of roughly 10 km by 5.5 km, not a city-wide trend.
- Land prices come from Official Land Price and Prefectural Survey points. Bands with few points (such as Osaka at 15 m and above) are a rough guide. The "residential" and "commercial" split is mechanical, based on each point's recorded use, and misclassification is possible.
- Crime figures are counts of occurrences recorded on the map, not rates. The scope and years published differ by prefecture, so counts cannot be compared between cities.
- Elevations come from the Geospatial Information Authority of Japan. The representative points are approximate locations we chose, so differences of a few metres are possible.
- Contour colours are assigned per view, so they cannot be compared between cities.
- The Yamanote/Shitamachi history is a summary of public materials and explanations; some primary sources were not checked.
You can run the same comparison for your own area or a site you are researching by lining up elevation, land prices, crime and zoning in the 4-way split view (Starter plan and above). Questions and comments are welcome at info@maprise.jp.
Images are map portions cut from MAPRISE's 4-way split view. The pane titles were rewritten for clarity. Elevation data comes from the Geospatial Information Authority of Japan, land prices from MLIT's Official Land Prices and Prefectural Land Price Survey (2024), crime from National Police Agency open data, and zoning from urban planning data, all processed by Vulcanz LLC as reference information; they do not guarantee the value or safety of any individual parcel. Parts of the maps are provided by OpenStreetMap contributors and the Geospatial Information Authority of Japan.
Tags: #Yamanote #Shitamachi #Elevation #Land prices #Crime #Zoning #4-way split view #Tokyo #Nagoya #Osaka #Fukuoka
Other-language share text (exception cases)
Quick share above follows our platform-locked language policy (X-family in Japanese, LinkedIn in English). The four panes below let you grab the opposite-language body when needed — e.g. introducing an English post to a Japanese audience on X, or posting a Japanese article to LinkedIn in Japanese. Each pane offers both a copy button and a direct intent link.
📝 「山の手は裕福、下町は庶民」は水害のせいなのか ― 東京・名古屋・大阪・福岡を、標高・地価・犯罪・用途の4枚の地図で確かめる
昔から言われる「山の手」と「下町」。裕福な人は水害を避けて高台に住んだ、という説明は本当でしょうか。MAPRISEの4分割表示で、色分け等高線・地価・犯罪発生・用途地域を東京・名古屋・大阪・福岡で同じ範囲に並べ、標高との関係を数字も添えて確かめました。
https://maprise.jp/ja/blog/yamanote-shitamachi-elevation/ #山の手 #下町
🆕 新しいブログ記事を公開しました。

《「山の手は裕福、下町は庶民」は水害のせいなのか ― 東京・名古屋・大阪・福岡を、標高・地価・犯罪・用途の4枚の地図で確かめる》

昔から言われる「山の手」と「下町」。裕福な人は水害を避けて高台に住んだ、という説明は本当でしょうか。MAPRISEの4分割表示で、色分け等高線・地価・犯罪発生・用途地域を東京・名古屋・大阪・福岡で同じ範囲に並べ、標高との関係を数字も添えて確かめました。

👉 詳しくはこちら: https://maprise.jp/ja/blog/yamanote-shitamachi-elevation/
📝 Did the Rich Move Uphill to Avoid Floods? Testing 'Yamanote vs Shitamachi' in Tokyo, Nagoya, Osaka and Fukuoka with Four Maps
Japan has an old saying: the wealthy live in the 'Yamanote' (uptown hills) and ordinary people in the…
https://maprise.jp/en/blog/yamanote-shitamachi-elevation/ #Yamanote #Shitamachi
🆕 New on the MAPRISE blog.

《Did the Rich Move Uphill to Avoid Floods? Testing 'Yamanote vs Shitamachi' in Tokyo, Nagoya, Osaka and Fukuoka with Four Maps》

Japan has an old saying: the wealthy live in the 'Yamanote' (uptown hills) and ordinary people in the 'Shitamachi' (lowland downtown). Did the rich simply move to high ground to avoid floods? We lined up elevation, land prices, crime and zoning in MAPRISE's 4-way split view for four cities, with numbers.

👉 Read the full post: https://maprise.jp/en/blog/yamanote-shitamachi-elevation/

#Yamanote #Shitamachi #Elevation #Landprices #Crime
Related posts
- Who Looks After the Slope and Retaining Wall Beneath a Cliff-Top Property? ― The Zushi Accident, and Yellow Zones Across Japan on a Split-Screen Elevation Map2026-10-24
- Minpaku Rules Differ From Town to Town — Strict Areas and Patchwork Areas on the Minpaku Ordinances Layer2026-10-15
- Reading Chiba's Flooded Areas with MAPRISE Layers — Meiji-Era Wetlands, Geology, Elevation, and Official Hazard Maps2026-10-12