Instead of planning everything out before starting, sometimes you just build and think as you go. That's how this trial came together: plotting the land and buildings that listed companies based in Fukuoka Prefecture disclose in their Annual Securities Reports, right on the map — with a direct link back to the source PDF for each one.
Hello from the MAPRISE development team. Today isn't a data-layer announcement so much as a reflection on how we build things.
Plan first, or build first?
When building something, you can decide everything up front before you start, or you can just start moving your hands and figure it out as you go. Generally speaking, if you're optimizing for cost-effectiveness, planning things out carefully before starting tends to be the more efficient path — it cuts down on wasted rework and puts resources where they belong.
That said, honestly, there's a joy in "building while you think" that stands on its own. Set aside for a moment whether it turns out to be useful — there's real excitement in wondering "what's this going to turn into?", and real pleasure in the act of figuring out how to make it happen. That's a kind of value efficiency alone doesn't capture.
This time, we want to share one small trial that came out of exactly that "build while you think" process.
Pulling fixed-asset data out of listed companies' Annual Securities Reports
Every listed company files an Annual Securities Report (yuho) each year. Buried inside is a section called "Status of Facilities," which lists, office by office, the land and buildings a company owns — location, area, and book value — in fairly granular detail.
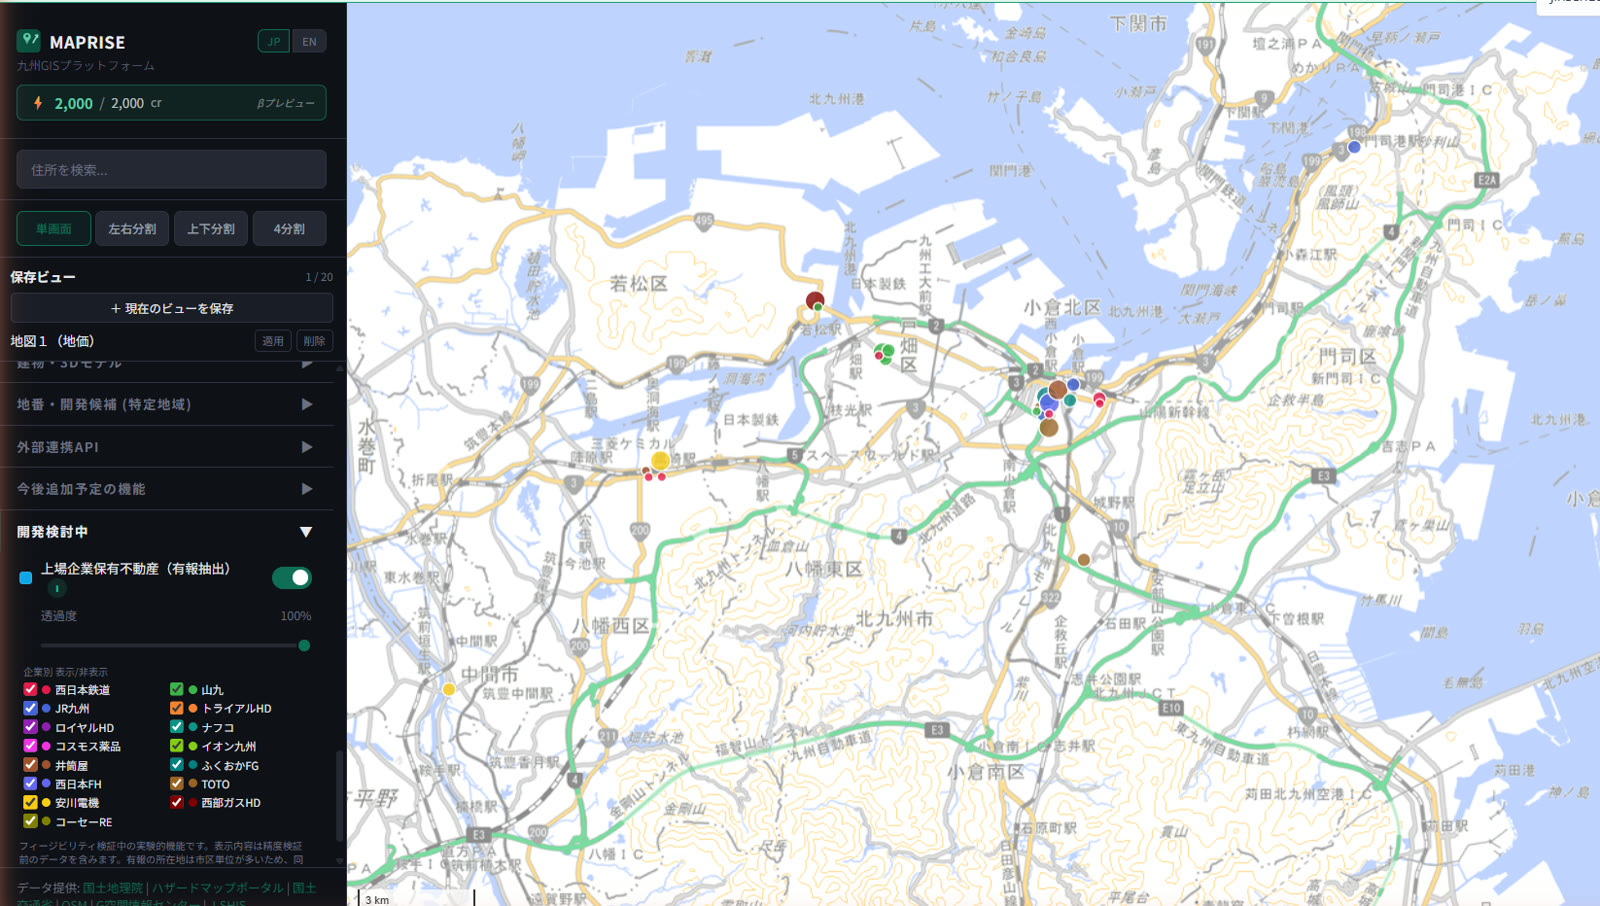
We read through these reports for listed companies based in Fukuoka Prefecture and plotted their holdings on the map, by company and by site, with marker size reflecting scale.
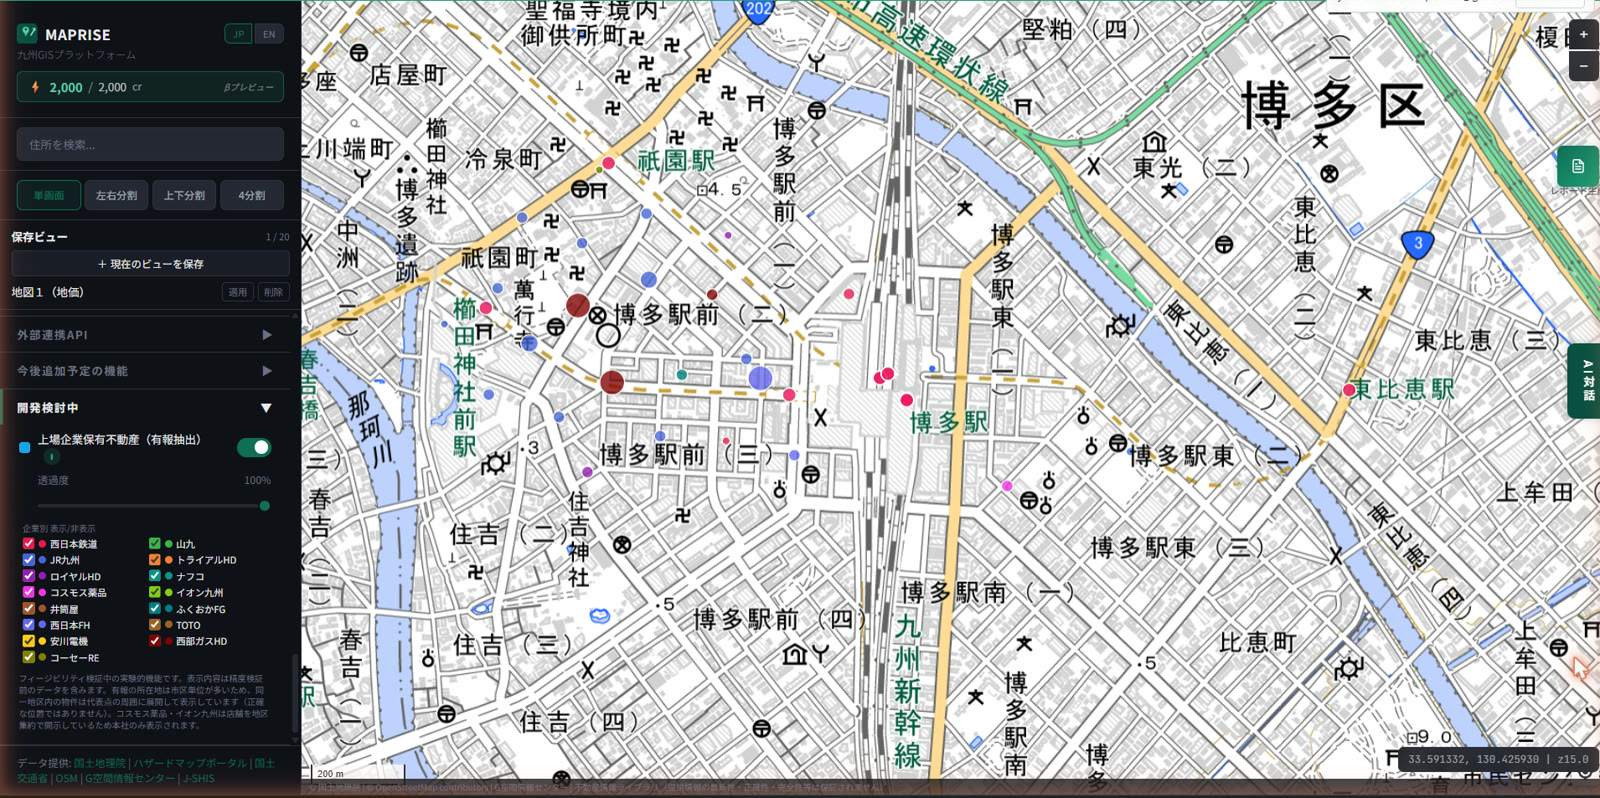
The "In development" section of the left panel lets you toggle each company on or off individually. The companies covered are all listed firms with a presence in Fukuoka Prefecture — Nishi-Nippon Railroad, JR Kyushu, Royal Holdings, Cosmos Pharmaceutical, Izutsuya, Nishi-Nippon Financial Holdings, Yaskawa Electric, Kose RE, Sankyu, Trial Holdings, Nafco, Aeon Kyushu, Fukuoka Financial Group, TOTO, Saibu Gas Holdings, and more.
Click a marker and the details for that site open up.
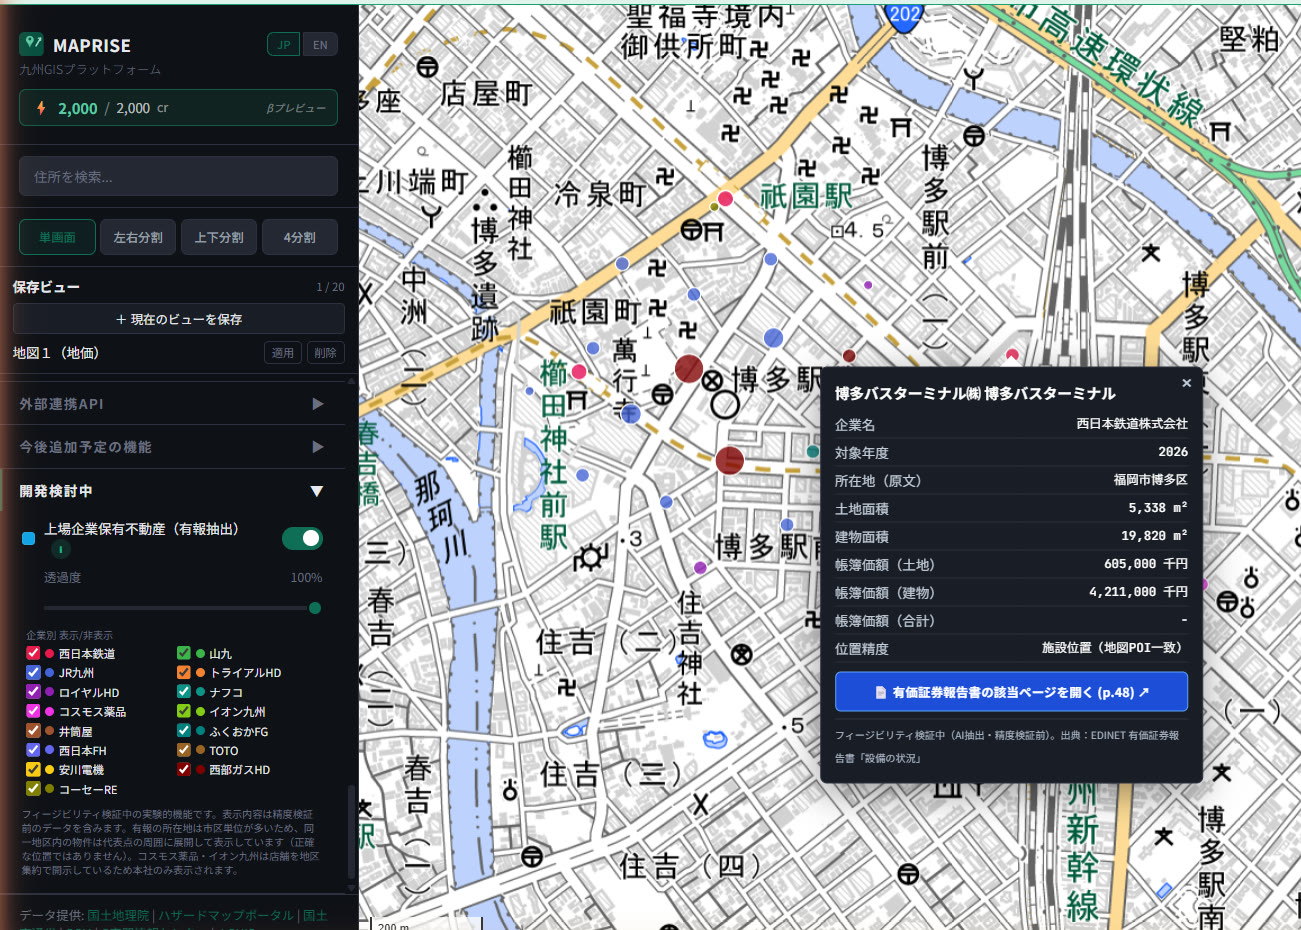
Alongside figures like company name, fiscal year, location (as recorded verbatim), land area, building area, and book value (land / buildings), we added a button: "Open the corresponding page of the Annual Securities Report." Click it, and the exact page of the actual PDF filed with EDINET (the Financial Services Agency's disclosure document portal) opens directly.
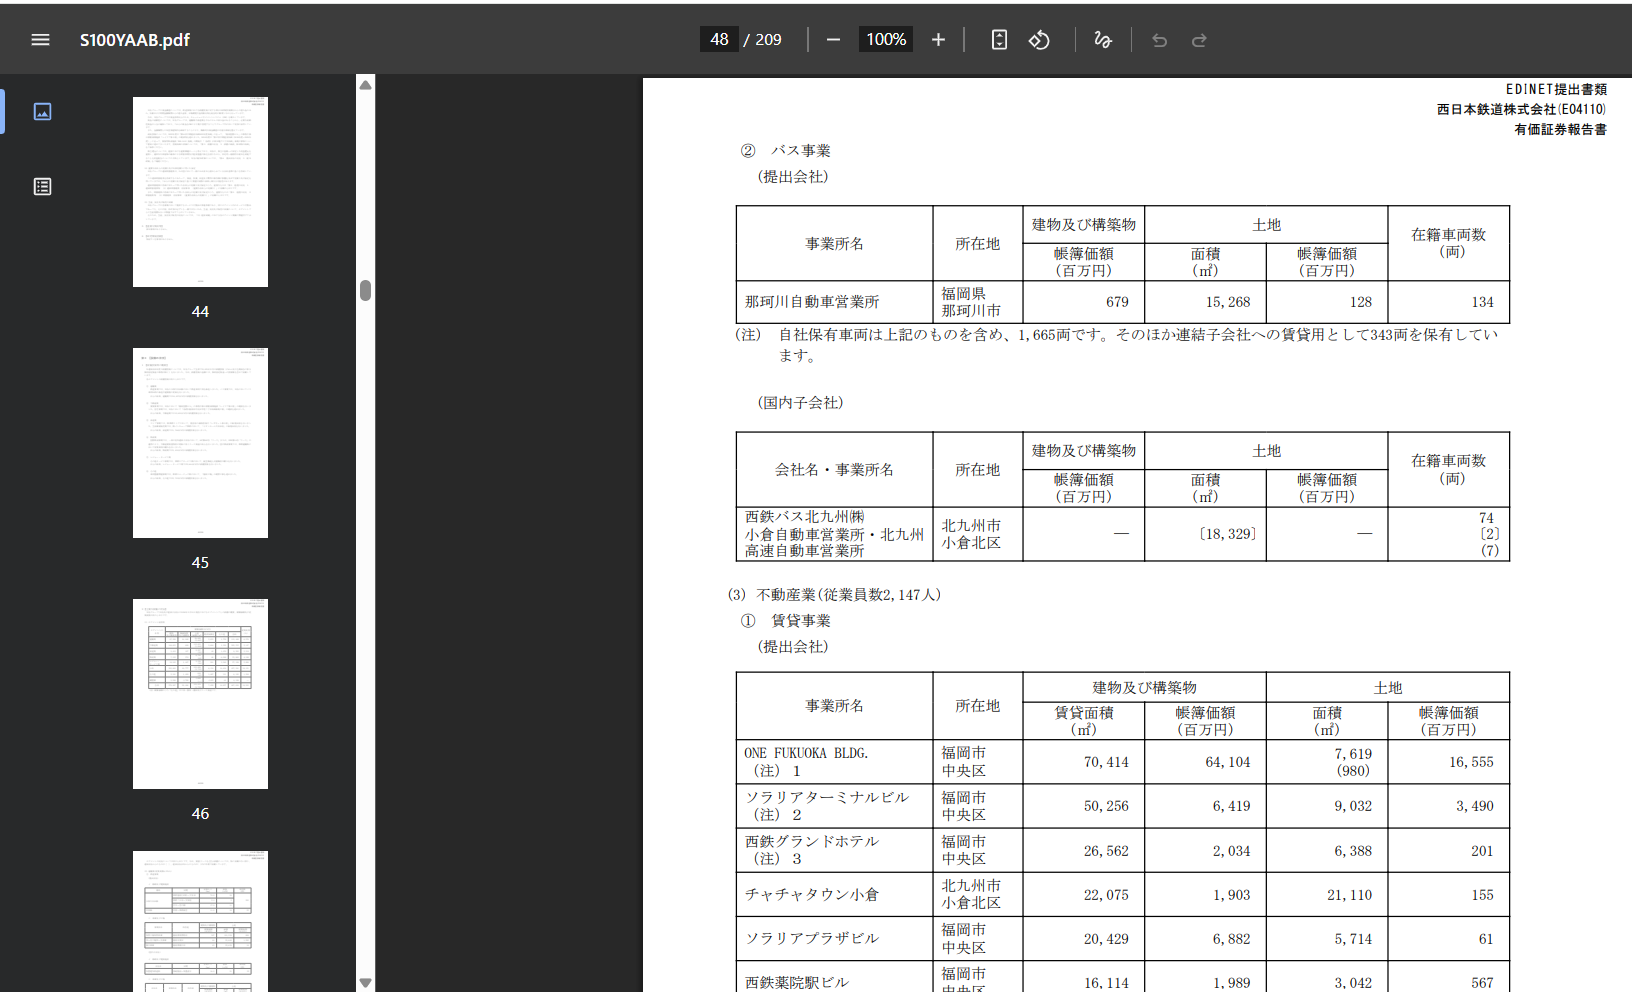
Every single marker on the map corresponds to a specific figure, sitting somewhere in a disclosure document that can run hundreds of pages. Being able to connect "a point on the map" to "the exact page of the primary source" with one click was one of the things this trial set out to test.
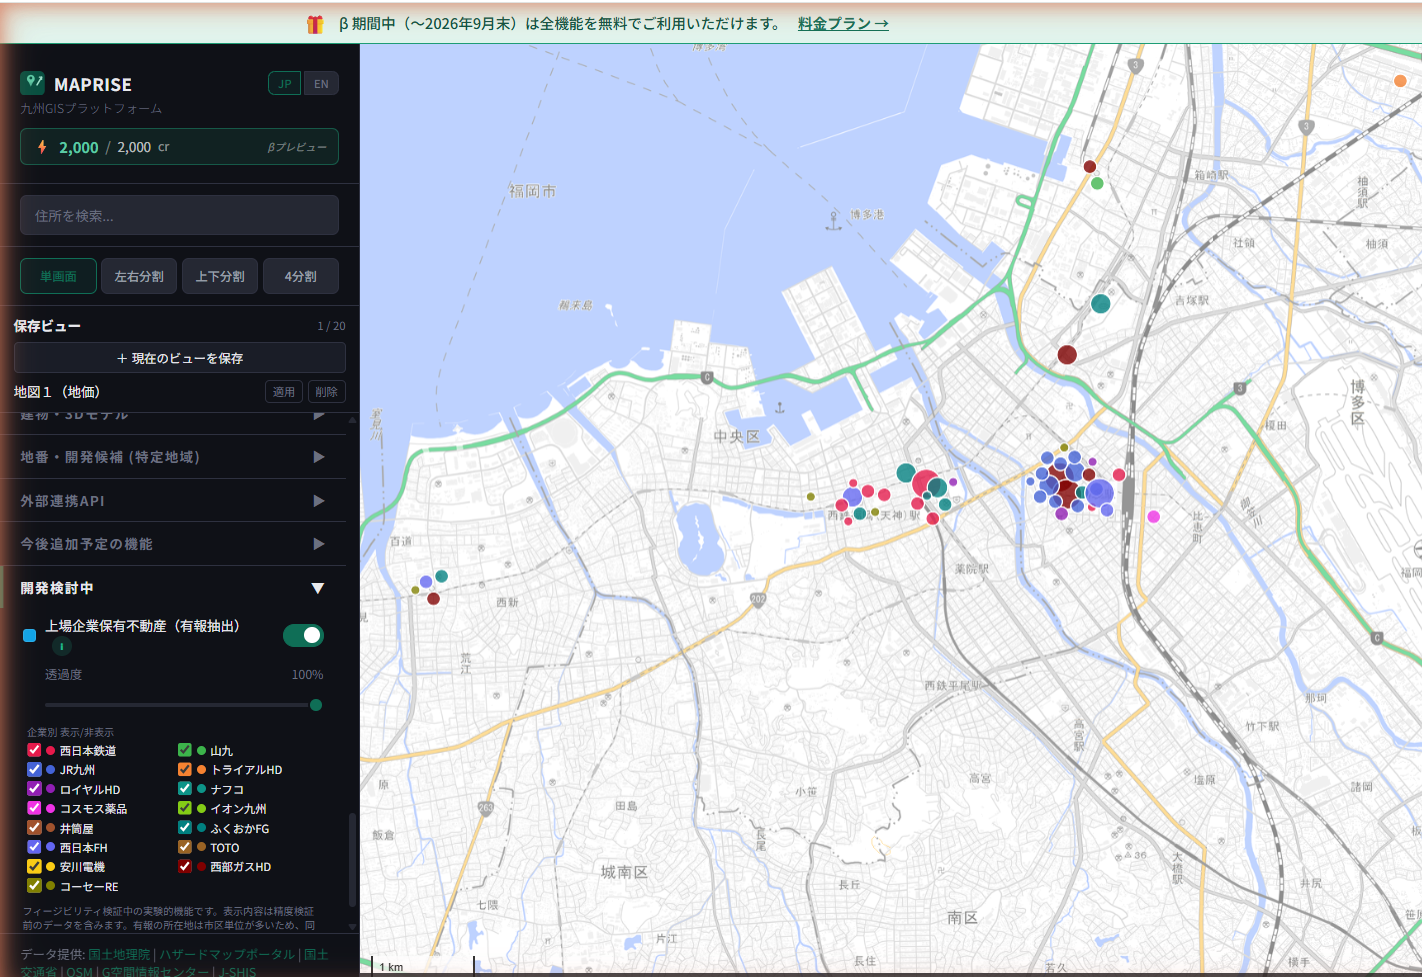
Zoom out beyond central Fukuoka City, and sites are scattered more sparsely across the wider area.
This is a trial of "what's possible," not an "answer"
One thing we want to be upfront about: this is still an experimental feature under feasibility testing. What's displayed includes data that hasn't yet gone through accuracy verification. Locations recorded in securities reports are often only precise down to the municipality level, so multiple sites within the same district are scattered around a representative point (they don't indicate an exact map location). Some companies also disclose their stores aggregated at the prefecture level, in which case only the head-office location is shown. We've noted this directly on the map as well.
The main point of building this feature wasn't to systematically mine listed companies' IR disclosures for some investment insight. Rather, it was to show that handling unstructured primary-source material — hundreds of pages of disclosure documents — comprehensively through a map interface, in a way that still lets you trace back to the original source, isn't actually that big a lift for our engineering.
Where could this go from here?
Honestly, we don't yet have a clear answer for exactly whose work this feature will end up serving. But a few possibilities come to mind (none of these are intended as a basis for investment decisions — they're reference-only use cases for surveying footprint and asset scale): a credit officer at a financial institution wanting a bird's-eye view of a company's real-estate footprint within Fukuoka Prefecture; a corporate planning staffer trying to track how a competitor or business partner's sites are spreading; or perhaps a municipal or research-institute staffer who wants to grasp, as an area, the scale of assets held by major local companies.
Whether this small experiment — born from "could we pull this off?" — ends up genuinely useful to someone, or grows into something else entirely, we don't know yet. But we want to keep chasing the kind of possibilities you can only see by building while you think. On the theme of a major plant's real impact on land prices, how TSMC's arrival moved prices in Kikuyo Town, Kumamoto covers similar ground.
This is an experimental feature under feasibility testing. What's displayed includes data that hasn't yet gone through accuracy verification. Location data is an approximation based on municipality-level records and does not indicate a precise map location. Data source: Annual Securities Reports via EDINET (Financial Services Agency). The company names and real estate holding information presented in this article are based on publicly available securities reports submitted to the FSA's EDINET system, independently compiled and visualized by MAPRISE. There is no business partnership or endorsement relationship between the featured companies and MAPRISE.
Tags: #Trial #EDINET #Annual Securities Report #In development #Listed companies
Other-language share text (exception cases)
Quick share above follows our platform-locked language policy (X-family in Japanese, LinkedIn in English). The four panes below let you grab the opposite-language body when needed — e.g. introducing an English post to a Japanese audience on X, or posting a Japanese article to LinkedIn in Japanese. Each pane offers both a copy button and a direct intent link.
📝 「こんなことできるかな?」の挑戦 ― 上場企業の有価証券報告書から不動産情報を拾って地図に置いてみた
計画を固めてから作るのではなく、手を動かしながら考える。そんな作り方で、福岡県下の上場企業が有価証券報告書に記載している固定資産(土地・建物)の情報を地図上にプロットするトライアル機能を作ってみました。一次情報のPDFへのリンクも添えた、実験的な取り組みのご紹介です。
https://maprise.jp/ja/blog/listed-company-real-estate-experiment/ #トライアル #EDINET
🆕 新しいブログ記事を公開しました。

《「こんなことできるかな?」の挑戦 ― 上場企業の有価証券報告書から不動産情報を拾って地図に置いてみた》

計画を固めてから作るのではなく、手を動かしながら考える。そんな作り方で、福岡県下の上場企業が有価証券報告書に記載している固定資産(土地・建物)の情報を地図上にプロットするトライアル機能を作ってみました。一次情報のPDFへのリンクも添えた、実験的な取り組みのご紹介です。

👉 詳しくはこちら: https://maprise.jp/ja/blog/listed-company-real-estate-experiment/

#EDINET
📝 "Could we pull this off?" — plotting listed companies' real-estate holdings from their securities reports
Instead of planning everything out before starting, sometimes you just build and think as you go. That's how this trial came tog…
https://maprise.jp/en/blog/listed-company-real-estate-experiment/ #Trial #EDINET
🆕 New on the MAPRISE blog.

《"Could we pull this off?" — plotting listed companies' real-estate holdings from their securities reports》

Instead of planning everything out before starting, sometimes you just build and think as you go. That's how this trial came together: plotting the land and buildings that listed companies based in Fukuoka Prefecture disclose in their Annual Securities Reports, right on the map — with a direct link back to the source PDF for each one.

👉 Read the full post: https://maprise.jp/en/blog/listed-company-real-estate-experiment/

#Trial #EDINET #AnnualSecuritiesReport #Indevelopment #Listedcompanies