TSMC's move into Kumamoto has sent land prices in Kikuyo Town moving fast. Using MAPRISE's price-change-rate map and per-point price trend charts, we compared the Kikuyo Hikarinomori area directly against an ordinary residential neighborhood elsewhere in Kumamoto City. A numbers-first look at the impact of a major plant arriving.
Hello from the MAPRISE development team. This time we're taking on one of the most closely watched topics in Kyushu right now: land prices in Kikuyo Town, Kumamoto Prefecture, as Taiwan's TSMC — one of the world's largest semiconductor makers — expands into the area.
TSMC's arrival, and the town of Kikuyo
TSMC (Taiwan Semiconductor Manufacturing Company) has built a chip fabrication plant in Kikuyo Town, Kikuchi District, Kumamoto Prefecture, through JASM (Japan Advanced Semiconductor Manufacturing), a joint venture with Sony Group and others. The first fab began operating in 2024, and plans for a second are moving forward. As you'd expect, it's drawn enormous attention, both domestic and international, as a major hub for the semiconductor industry.
An investment of this scale is bound to ripple through the surrounding real-estate market. We wanted to see how much land prices had actually moved — not through impressions, but through maps and data. So we opened up MAPRISE's land-price layers and took a look.
The price-change-rate map: color density around Kikuyo
MAPRISE has a layer that color-codes each official land-price survey point by its year-over-year change rate. We lined up two different years' data side by side in a split screen.
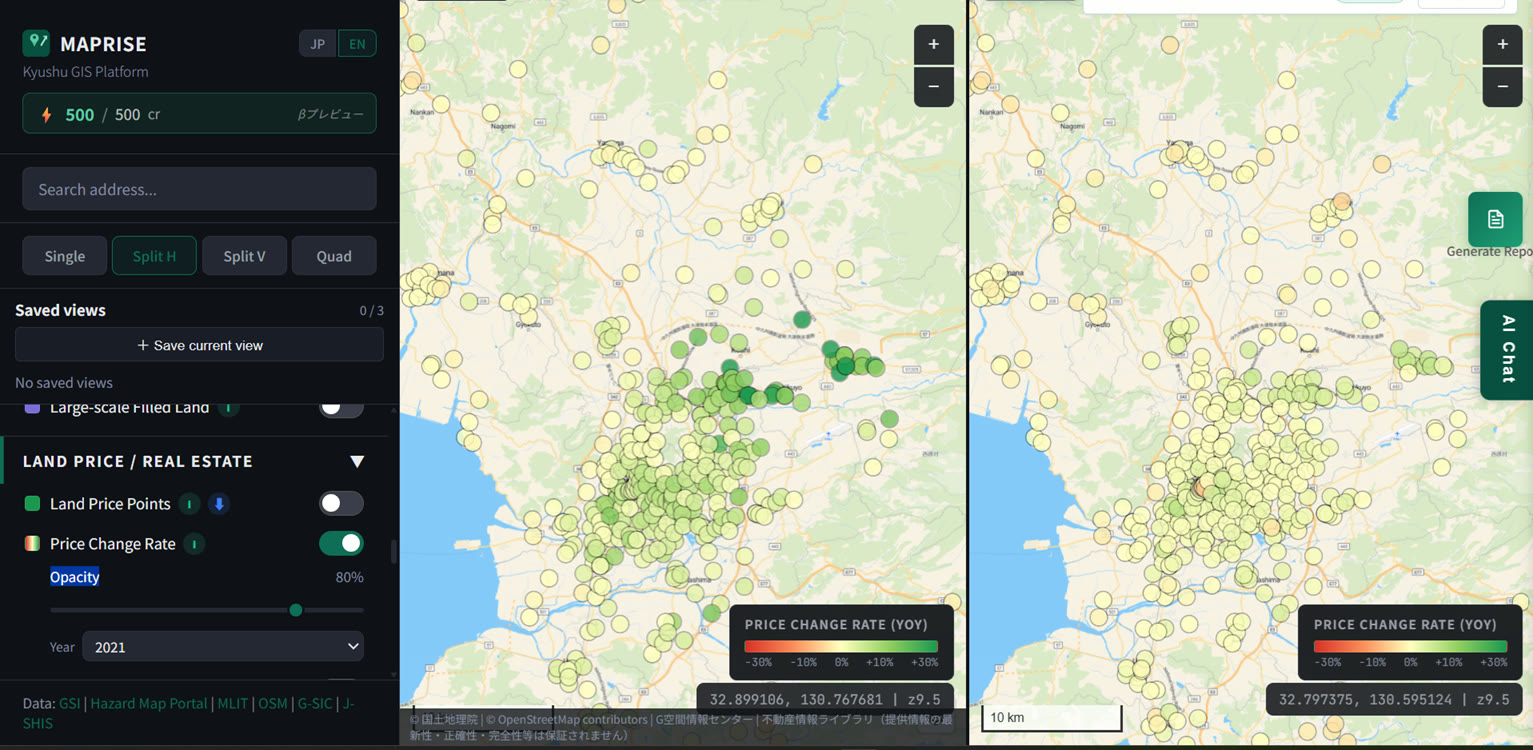
The legend runs from red to green across a range of roughly -30% to +30%, with darker green meaning a higher rate of appreciation. In the left panel, you can clearly see a dense cluster of dark-green points centered on Kikuyo. Of course, color density alone is just an impression, so we clicked into a few individual points to pull actual numbers.
Kikuyo vs. Kumamoto City, in concrete numbers
First, a point in the Kikuyo Hikarinomori area, close to the TSMC plant.
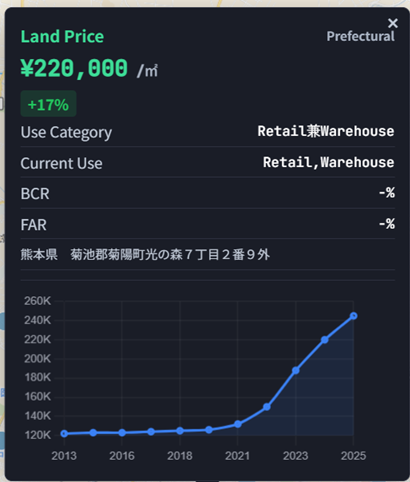
The point is at Hikarinomori 7-chome 2-9 and others, Kikuyo Town, Kikuchi District, Kumamoto Prefecture (a Kumamoto Prefectural Land Price Survey point), classified as "retail combined with warehouse." The displayed price is ¥220,000/m², up 17% year over year. The accompanying trend chart shows the price sitting flat in the ¥120,000/m² range from 2013 through 2020, then turning sharply upward starting in 2021 — reaching the ¥220,000 range in 2023 and climbing to around ¥260,000 by 2025. It's striking how neatly that inflection point lines up with the timing of TSMC's announcement and the start of operations.
Now let's compare that against an ordinary residential neighborhood elsewhere in Kumamoto City.
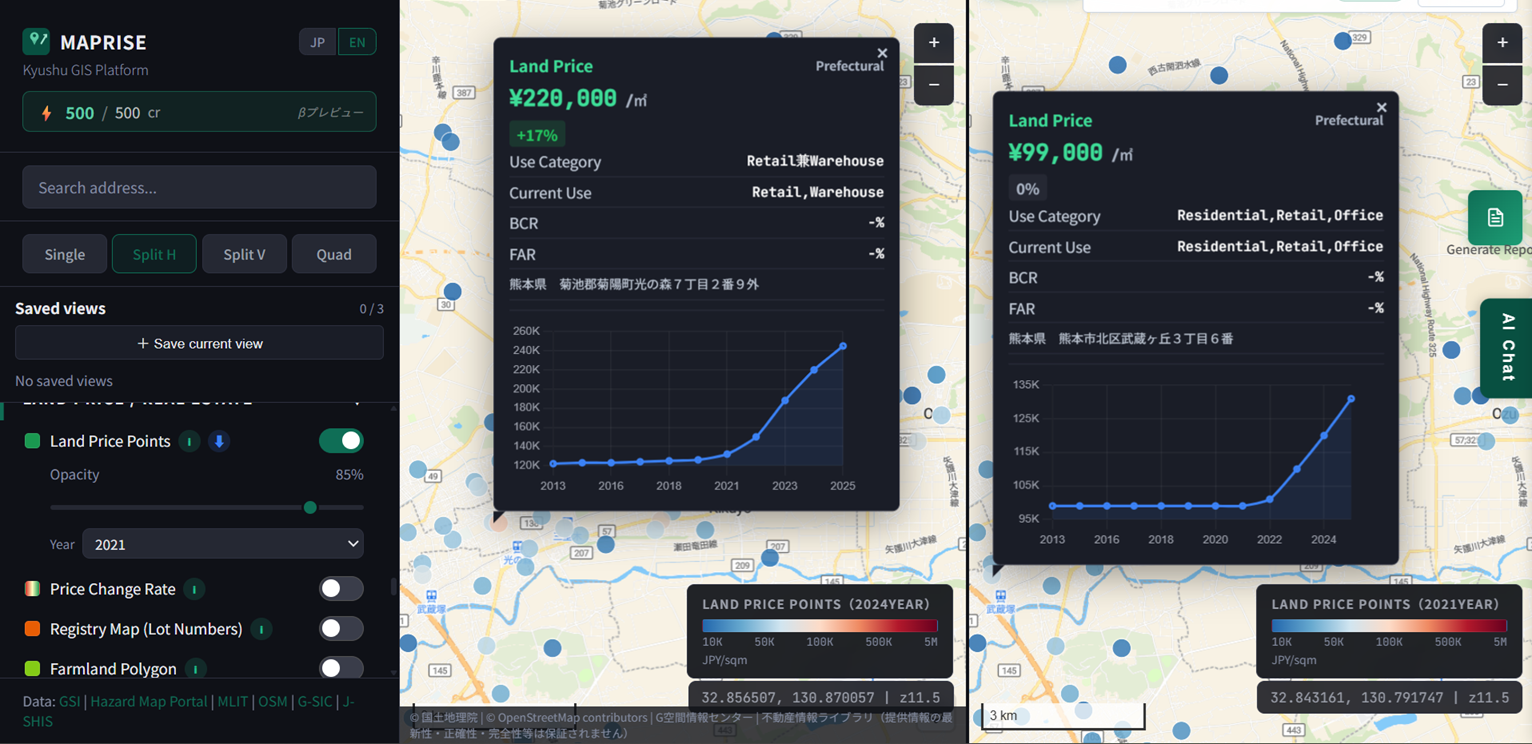
The comparison point is at Musashigaoka 3-chome 6, Kita Ward, Kumamoto City — classified as "residential, retail, office," a residential neighborhood not so different in character from Kikuyo Hikarinomori. The displayed price is ¥99,000/m², 0% year over year. Its trend chart sits essentially flat in the ¥95,000–100,000/m² range from 2013 all the way to 2021, then rises gradually to reach around ¥135,000 by 2024 — a real increase, but a world apart from Kikuyo's surge.
Two points, both within Kumamoto Prefecture, both ordinary residential areas — and yet one is up 17% in a single year while the other is flat. That contrast tells you, in hard numbers, just how concentrated TSMC's impact has been on this one specific area.
Zooming out to see the shape of the town
Finally, we pulled back to a single-panel view of the wider area.
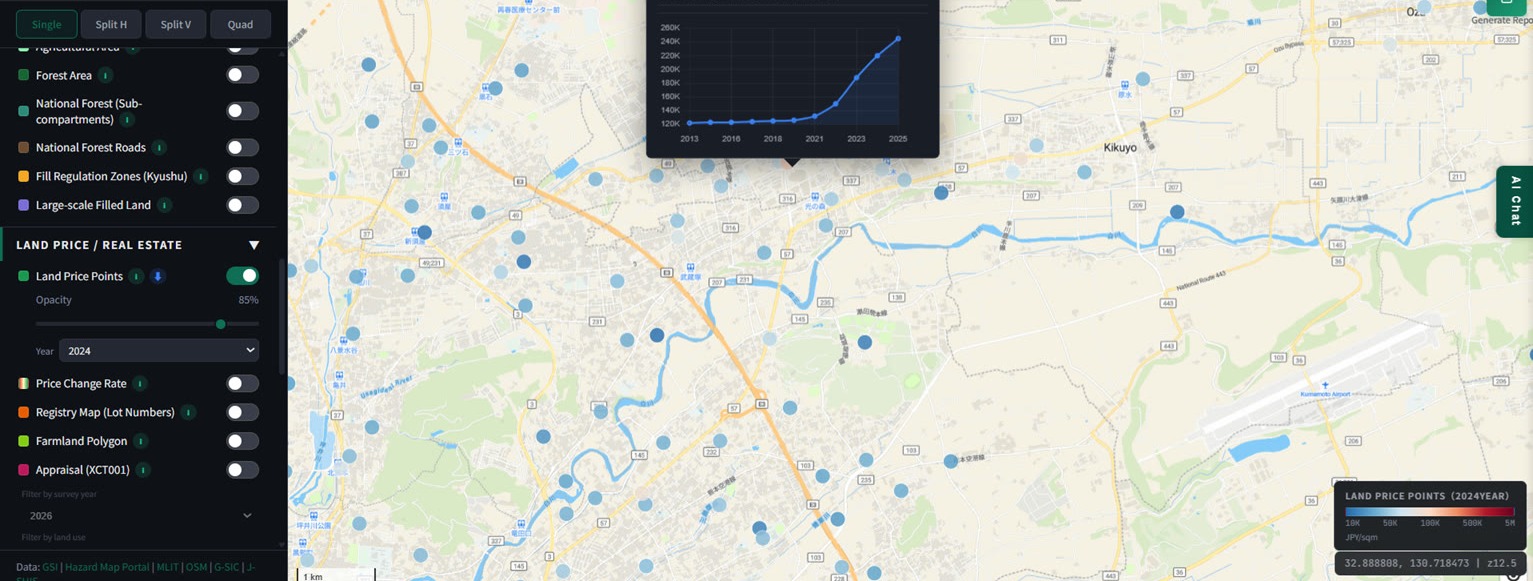
Kikuyo sits close to Kumamoto Airport, and the points showing price appreciation aren't confined to right around the plant — they spread out from there across a wider area. In MAPRISE, you can toggle the "land price points" layer on and off, switch between survey years, and switch over to the price-change-rate layer, all from the left-hand menu. Click any single point and its popup gives you the price, use classification, current use, and — as shown above — a multi-year trend chart, all in one place.
Numbers are something to read, not just take at face value
What we've shown here is a comparison of two specific points, based on publicly available official land-price and prefectural survey data. Land-price movement involves many factors beyond a single plant's arrival, and it varies point to point. Rather than a blanket takeaway like "all of Kikuyo is surging," the more useful approach is to check point by point on the map — "this spot moved like this, so what about the area around it?" That's the kind of tool we hope MAPRISE can be.
We'll keep tracking the changes happening across Kyushu right now, through maps and data. For how official appraisals back up these figures, see the two-appraiser land appraisal layer; for actual transaction and contract prices, see transaction price vs. contract price.
The land-price data in this article is reference information based on MLIT's Official Land Price Publication and the Kumamoto Prefectural Land Price Survey. It does not guarantee future price movement at any individual point. For investment or transaction decisions, please consult a real-estate appraiser or other qualified professional.
Source: MLIT Official Land Price Publication, Kumamoto Prefectural Land Price Survey
Tags: #TSMC #Kikuyo Town #Land price #Semiconductors #Kumamoto Prefecture
Other-language share text (exception cases)
Quick share above follows our platform-locked language policy (X-family in Japanese, LinkedIn in English). The four panes below let you grab the opposite-language body when needed — e.g. introducing an English post to a Japanese audience on X, or posting a Japanese article to LinkedIn in Japanese. Each pane offers both a copy button and a direct intent link.
📝 TSMC進出で地価はどう動いたか ― 熊本県菊陽町を地図とグラフで見てみた
台湾TSMCの熊本進出で、菊陽町の地価が大きく動いています。MAPRISEの価格変動率マップ・地価ポイントの推移グラフを使って、菊陽町光の森エリアと熊本市内の通常の住宅地とを実際に比較してみました。数字で見る「進出インパクト」の記録です。
https://maprise.jp/ja/blog/tsmc-kikuyo-land-price/ #TSMC #菊陽町
🆕 新しいブログ記事を公開しました。

《TSMC進出で地価はどう動いたか ― 熊本県菊陽町を地図とグラフで見てみた》

台湾TSMCの熊本進出で、菊陽町の地価が大きく動いています。MAPRISEの価格変動率マップ・地価ポイントの推移グラフを使って、菊陽町光の森エリアと熊本市内の通常の住宅地とを実際に比較してみました。数字で見る「進出インパクト」の記録です。

👉 詳しくはこちら: https://maprise.jp/ja/blog/tsmc-kikuyo-land-price/

#TSMC
📝 How TSMC's arrival moved land prices — mapping and charting Kikuyo Town, Kumamoto
TSMC's move into Kumamoto has sent land prices in Kikuyo Town moving fast. Using MAPRISE's price-change-rate map and per-point price trend charts, we…
https://maprise.jp/en/blog/tsmc-kikuyo-land-price/ #TSMC #KikuyoTown
🆕 New on the MAPRISE blog.

《How TSMC's arrival moved land prices — mapping and charting Kikuyo Town, Kumamoto》

TSMC's move into Kumamoto has sent land prices in Kikuyo Town moving fast. Using MAPRISE's price-change-rate map and per-point price trend charts, we compared the Kikuyo Hikarinomori area directly against an ordinary residential neighborhood elsewhere in Kumamoto City. A numbers-first look at the impact of a major plant arriving.

👉 Read the full post: https://maprise.jp/en/blog/tsmc-kikuyo-land-price/

#TSMC #KikuyoTown #Landprice #Semiconductors #KumamotoPrefecture