Built from MLIT's PLATEAU 3D city model, this layer color-codes roughly 1.55 million buildings across 17 Kyushu cities in three ways — by use, by seismic standard, and by height. We walk through each mode, who it helps across our five target industries, and the AI mode that analyzes six-scenario collapse probability from a single building click.
Hello from the MAPRISE development team. This time, we want to walk through the "PLATEAU Buildings" layer in a bit more depth.
What is PLATEAU?
PLATEAU is an open dataset of 3D city models that Japan's Ministry of Land, Infrastructure, Transport and Tourism (MLIT) has been building out. For cities across the country, it compiles and publishes position, height, use, and structural data for individual buildings as three-dimensional data. MAPRISE has ingested this data for 17 Kyushu cities — Fukuoka, Kitakyushu, Kumamoto, Sasebo, Kurume, and more — making roughly 1.55 million buildings directly usable on the map. Being able to color-code and filter a building dataset at this scale, building by building, is the foundation this layer is built on.
The same 1.55 million buildings, seen through three color modes
What sets the PLATEAU Buildings layer apart is that the same building data can be viewed through three switchable color modes: by use, by seismic standard, and by height.
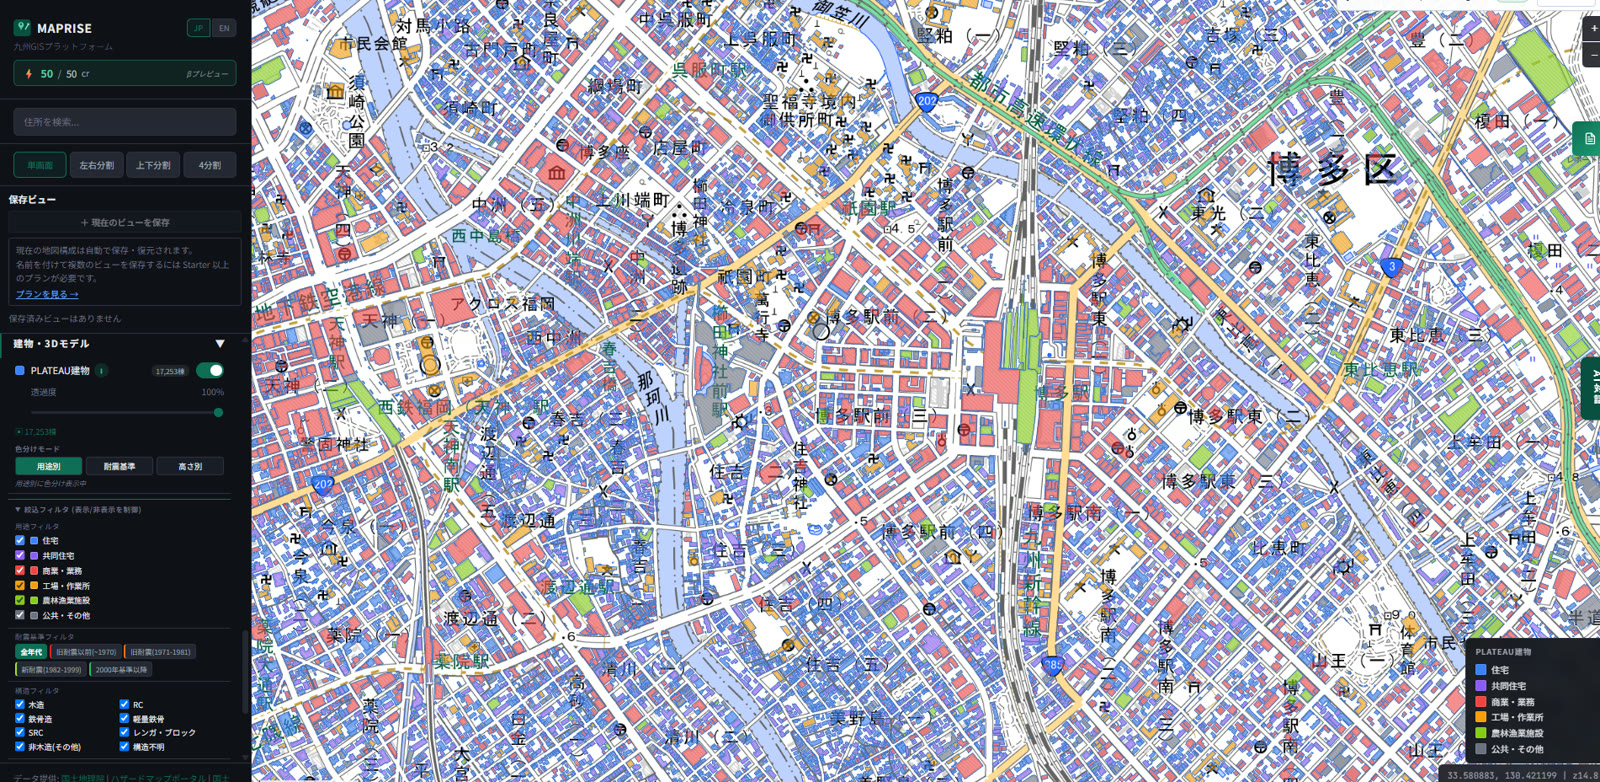
1. By use
The baseline mode colors buildings by use, across six categories: residential (blue), multi-family housing (purple), commercial/business (red), factory/workshop (orange), agriculture/forestry/fishery facilities (green), and public/other (gray).
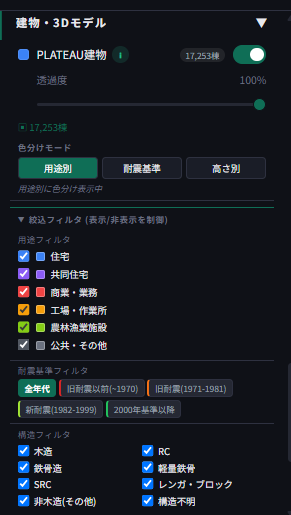
What makes this more useful is that you can filter by seismic-standard era and structure type at the same time as use. For example, you can toggle down to just "wood-framed residential buildings" or just "RC commercial/business buildings," leaving only the building attributes you actually need on the map.
2. By seismic standard
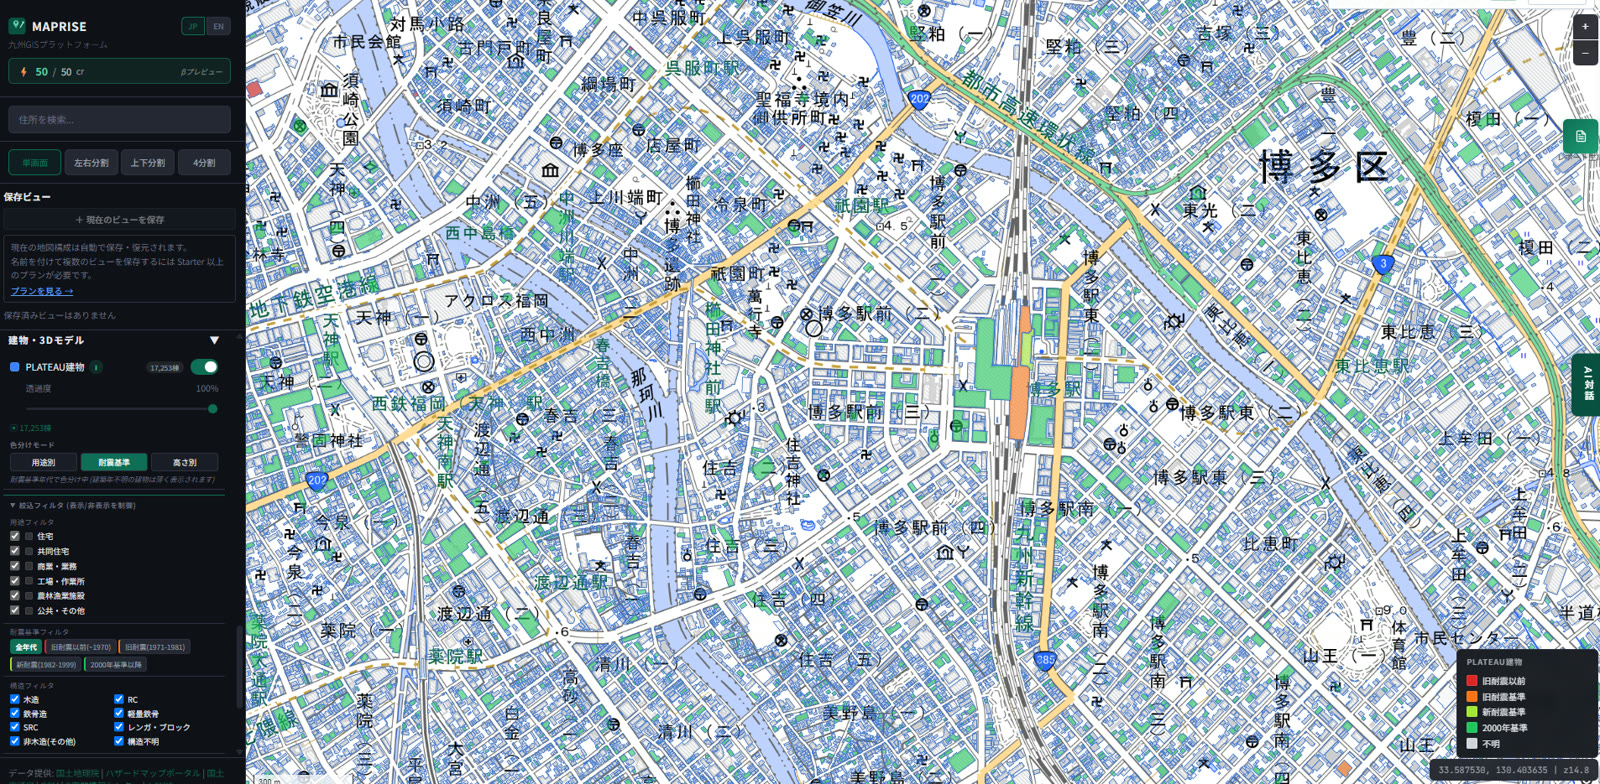
The second mode colors buildings by seismic standard era: pre-old-standard (before 1970), old seismic standard (1971–1981), new seismic standard (1982–1999), post-2000 standard, and unknown — five categories in total.

The point of this mode isn't really to inspect individual buildings — it's to screen the seismic-standard situation across an area, as a whole. You can see at a glance, from the color distribution, how densely pre-old-standard buildings cluster in a given area, or conversely, where post-2000-standard buildings dominate.
3. By height
The third mode colors buildings by height, across a fine gradient: 0–3m, 3–6m, 6–10m, 10–15m, 15–25m, 25–40m, 40–60m, and 60m+.
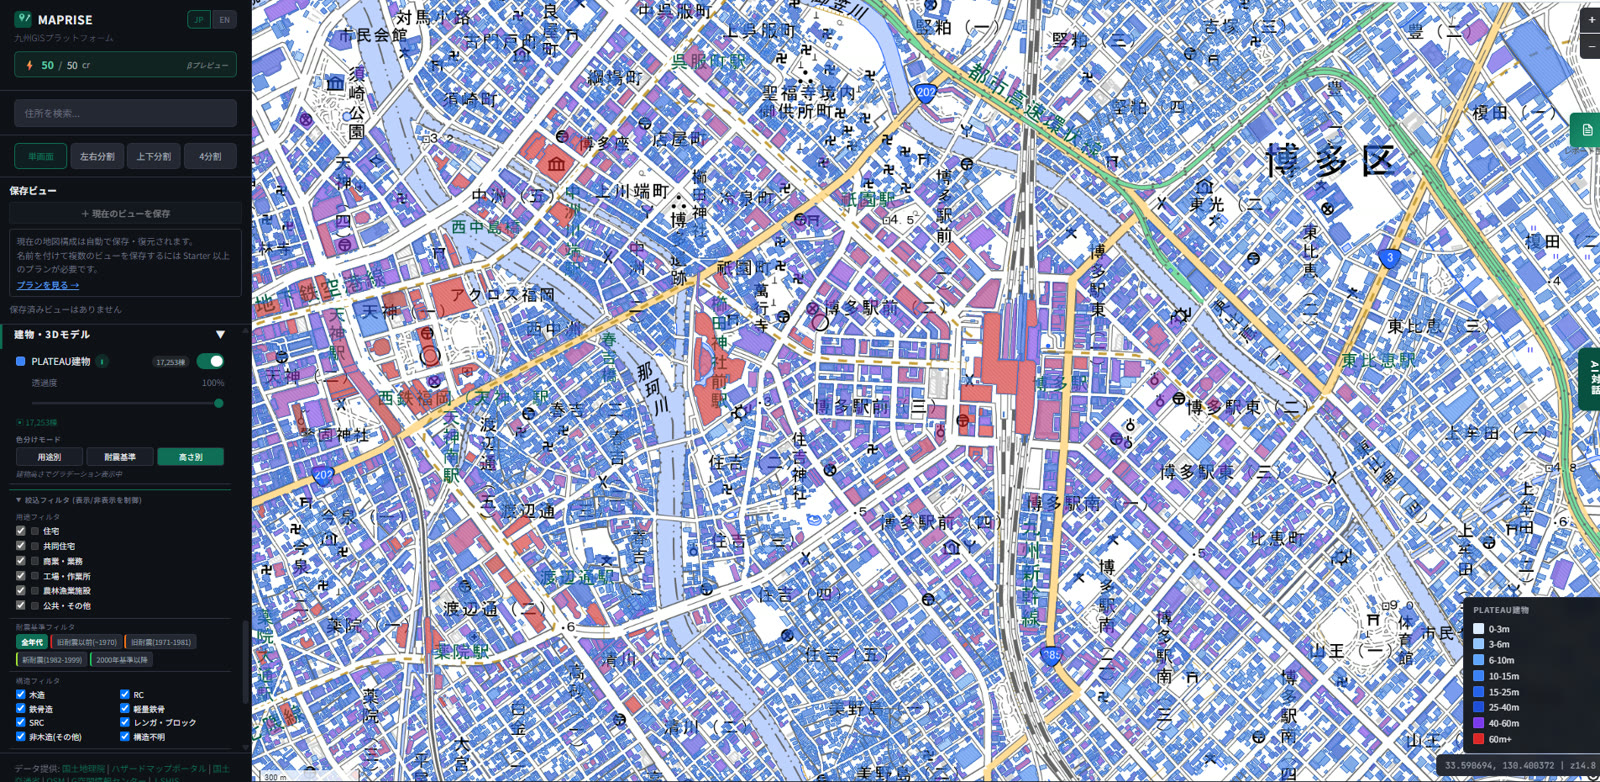
You can immediately see, as a color gradient, how a low-rise residential area gives way to clusters of taller buildings right around a station or along a main road.
Click any building for its individual details
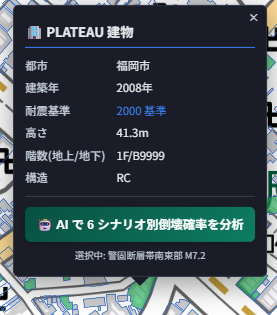
In any color mode, clicking a single building opens a popup with that building's specific details — city, year built, seismic standard, height, floors (above/below ground), and structure. You get the overall pattern from the area view, then click through to check specific buildings that catch your eye.
Who this helps
MAPRISE's go-to-market centers on five customer segments: real estate brokers, developers/funds, banks (lending), legal & appraisal professionals, and local government. Here's how we see the PLATEAU Buildings layer fitting into each one.
For real estate brokers, it lets you check a building's structure and age — information you need for a mandatory disclosure statement — on the map before a site visit. The seismic-standard color mode can also serve as material for explaining an area's overall rebuilding pattern or asset age to a client.
For developers/funds, it's a way to grasp the distribution of building use and height across a candidate area as a whole, during the early stages of site evaluation. Pinpointing where a cluster of high-rises meets a low-rise residential area feeds directly into development planning.
For banks (lending), being able to instantly check the seismic standard and structure of a building serving as collateral is a useful piece of primary information during underwriting. The seismic-standard distribution across the surrounding area also helps assess risk for the collateral area as a whole.
For legal & appraisal professionals, efficiently checking the structure, age, and height of a subject building and its surroundings should be useful during an appraisal or land-history investigation.
For local government (urban planning / disaster preparedness), being able to survey a jurisdiction's building stock by seismic standard is foundational material for prioritizing areas in disaster-preparedness planning or seismic-retrofit promotion. Identifying areas dense with pre-old-standard buildings is exactly the problem this color mode addresses.
From a building click, AI analyzes six-scenario collapse probability
The PLATEAU Buildings layer has one more layer of depth. Click a building, and from the popup you can select "Analyze 6-scenario collapse probability with AI." The AI then analyzes that building's collapse probability under each of six earthquake scenarios modeled for Kyushu: the Kego Fault Zone Southeast segment (M7.2), the combined Futagawa–Hinagu Fault Zone (M8.0), the Nankai Trough megathrust earthquake (M9.1), the Hyuganada earthquake (M7.6), the combined Nishiyama Fault Zone (M7.6), and the Beppu–Haneyama Fault Zone (M7.5).
This analysis combines the subject building's structure and construction-era data (from PLATEAU building data) with the scenario-specific collapse probability and instrumental seismic intensity linked to that building (from earthquake-response simulation data). It identifies the nearest building record within 150m of the clicked point before analyzing, so the result reflects the actual building at the location you clicked. It also lets you compare against the median collapse probability of surrounding buildings of the same structure type within a 100m radius — giving you a sense of how that building stacks up relative to its neighbors.
This is normally a credit-consuming AI analysis feature, but during our beta period (through the end of October 2026), anyone can use it free of charge. Get the area-wide pattern from the color-coded map, then click through to a specific building and go deeper with an AI-driven number. Give that whole flow a try.
PLATEAU building data is sourced from MLIT's 3D city model. Seismic-standard classifications and collapse-probability analysis results are reference information only and do not guarantee the seismic performance of any individual building. For an actual seismic assessment or retrofit decision, please consult a licensed architect or other qualified professional.
Tags: #PLATEAU #3D city model #Seismic standards #Earthquake simulation #AI
Other-language share text (exception cases)
Quick share above follows our platform-locked language policy (X-family in Japanese, LinkedIn in English). The four panes below let you grab the opposite-language body when needed — e.g. introducing an English post to a Japanese audience on X, or posting a Japanese article to LinkedIn in Japanese. Each pane offers both a copy button and a direct intent link.
📝 九州約155万棟の建物を、3つの視点で読み解く ― PLATEAU建物レイヤーの使い方
国土交通省のPLATEAU(3D都市モデル)をもとに、九州17都市・約155万棟の建物を「用途別」「耐震基準別」「高さ別」の3パターンで色分け表示できるレイヤーをご紹介します。想定される業種別の活用シーンと、建物クリックからAIが6シナリオ別の倒壊確率を分析するモードについてもあわせて解説します。
https://maprise.jp/ja/blog/plateau-buildings-3d/ #PLATEAU #3D都市モデル
🆕 新しいブログ記事を公開しました。

《九州約155万棟の建物を、3つの視点で読み解く ― PLATEAU建物レイヤーの使い方》

国土交通省のPLATEAU(3D都市モデル)をもとに、九州17都市・約155万棟の建物を「用途別」「耐震基準別」「高さ別」の3パターンで色分け表示できるレイヤーをご紹介します。想定される業種別の活用シーンと、建物クリックからAIが6シナリオ別の倒壊確率を分析するモードについてもあわせて解説します。

👉 詳しくはこちら: https://maprise.jp/ja/blog/plateau-buildings-3d/

#PLATEAU #AI
📝 Reading 1.55 million Kyushu buildings through three lenses — how to use the PLATEAU Buildings layer
Built from MLIT's PLATEAU 3D city model, this layer color-codes roughly 1.55 million buildings across 17 Kyushu cities in three…
https://maprise.jp/en/blog/plateau-buildings-3d/ #PLATEAU #3Dcitymodel
🆕 New on the MAPRISE blog.

《Reading 1.55 million Kyushu buildings through three lenses — how to use the PLATEAU Buildings layer》

Built from MLIT's PLATEAU 3D city model, this layer color-codes roughly 1.55 million buildings across 17 Kyushu cities in three ways — by use, by seismic standard, and by height. We walk through each mode, who it helps across our five target industries, and the AI mode that analyzes six-scenario collapse probability from a single building click.

👉 Read the full post: https://maprise.jp/en/blog/plateau-buildings-3d/

#PLATEAU #3Dcitymodel #Seismicstandards #Earthquakesimulation #AI
Related posts
- You don't need to memorize 50+ layers — one-click Purpose Presets turn on exactly what you need2026-07-26
- Why every official land appraisal has two appraisers — looking behind Japan's Land Price Publication with MAPRISE2026-07-04
- "Transaction price" vs. "contract price" — do you know the difference? MAPRISE's real-estate price map now tells them apart by icon shape2026-07-04