MAPRISE now has an "Aircraft Overflight Frequency (Reference)" layer. For each cell of about 500 m, it shows by color how many aircraft per day pass nearby. We display five airports — Haneda, Narita, Kansai, Itami and Fukuoka — and look at how they differ.
Hello from the MAPRISE team.
We have just released a new layer, "Aircraft Overflight Frequency (Reference)". For each cell of about 500 m, it shows by color how many aircraft per day pass nearby (within 1 km, slant distance).
When looking at a property or a plot of land, people often check sunlight and flood risk, but it is hard to find out where airplanes fly. So in this post we display five airports on the layer and share what we noticed.
What the layer shows
These are reference values compiled from flight tracks collected by a volunteer ADS-B receiver network, over 24 days (two days per month, October 2025 to September 2026). Colors range from "Rare (under 1 flight/day)" to "Very frequent (50+ flights/day)". Click a cell to see flights within 1 km and 2 km, flights directly overhead, low flights and the share at night.
Please keep three points in mind.
- In areas with weak receiver coverage, the layer shows "cannot be determined" or similar. This does not mean zero flights.
- Aircraft that do not transmit ADS-B, such as small aircraft and military aircraft, are not included.
- The layer does not show noise levels or the statutory aircraft noise zones.
Haneda: red spreading across an area
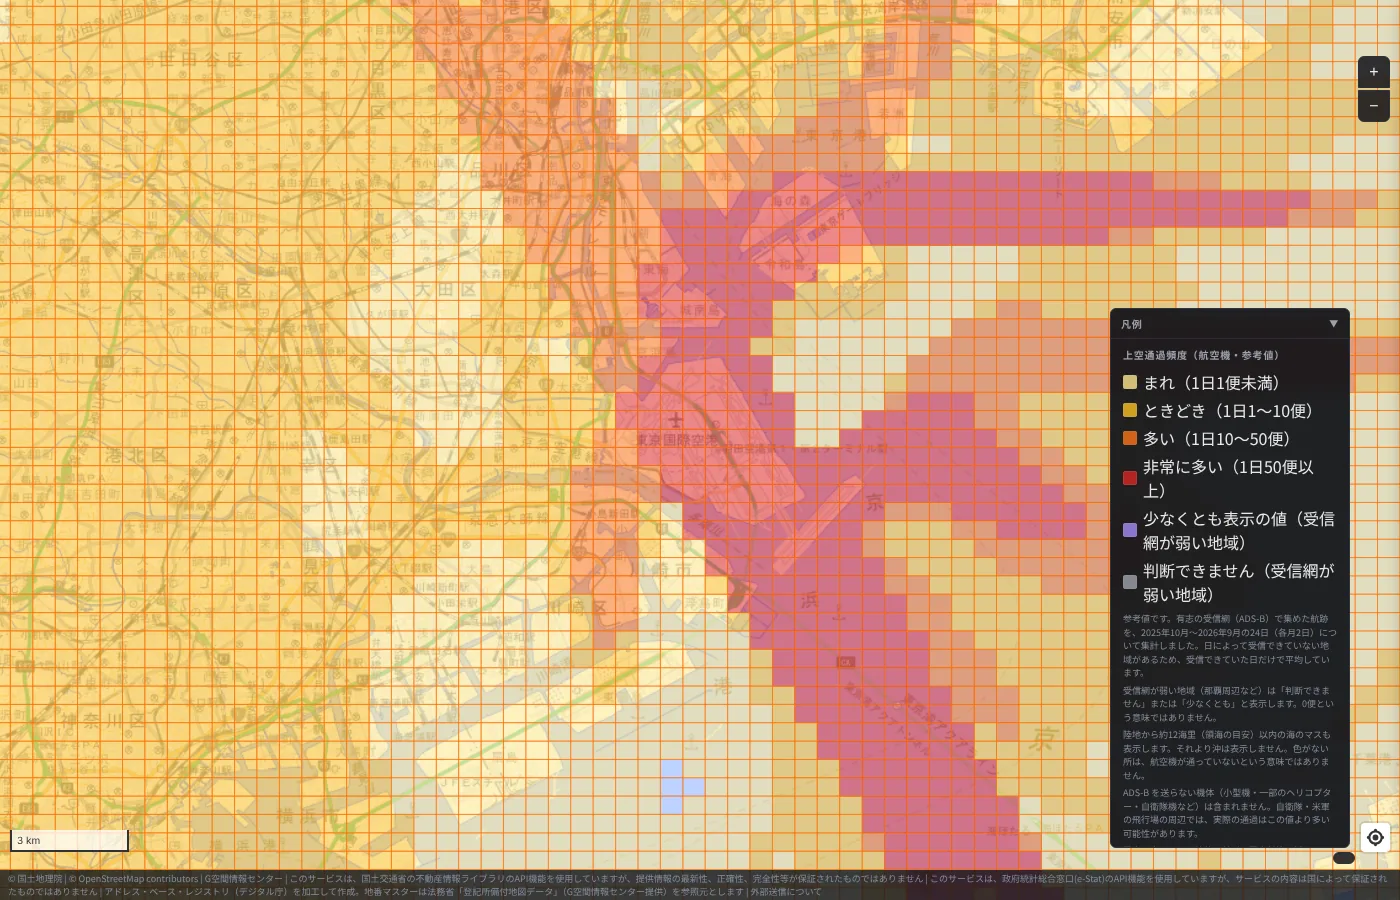
Haneda is Japan's busiest airport. Red cells line up over the reclaimed land with the runways, with orange all around. Clicking a runway cell showed 238 flights per day within 1 km. This layer also shows sea cells within about 12 nautical miles of land (a rough guide to territorial waters); off Haneda, a red band extends south over Tokyo Bay, and another band continues to the east.
What caught our eye is that color also spreads toward Shinagawa, Ota and Kawasaki. A new flight path has been in operation since March 29, 2020, and in the afternoon during south-wind operation, approaches over central Tokyo are reportedly used. We think the spread of color may reflect this operation.
Narita: one long band
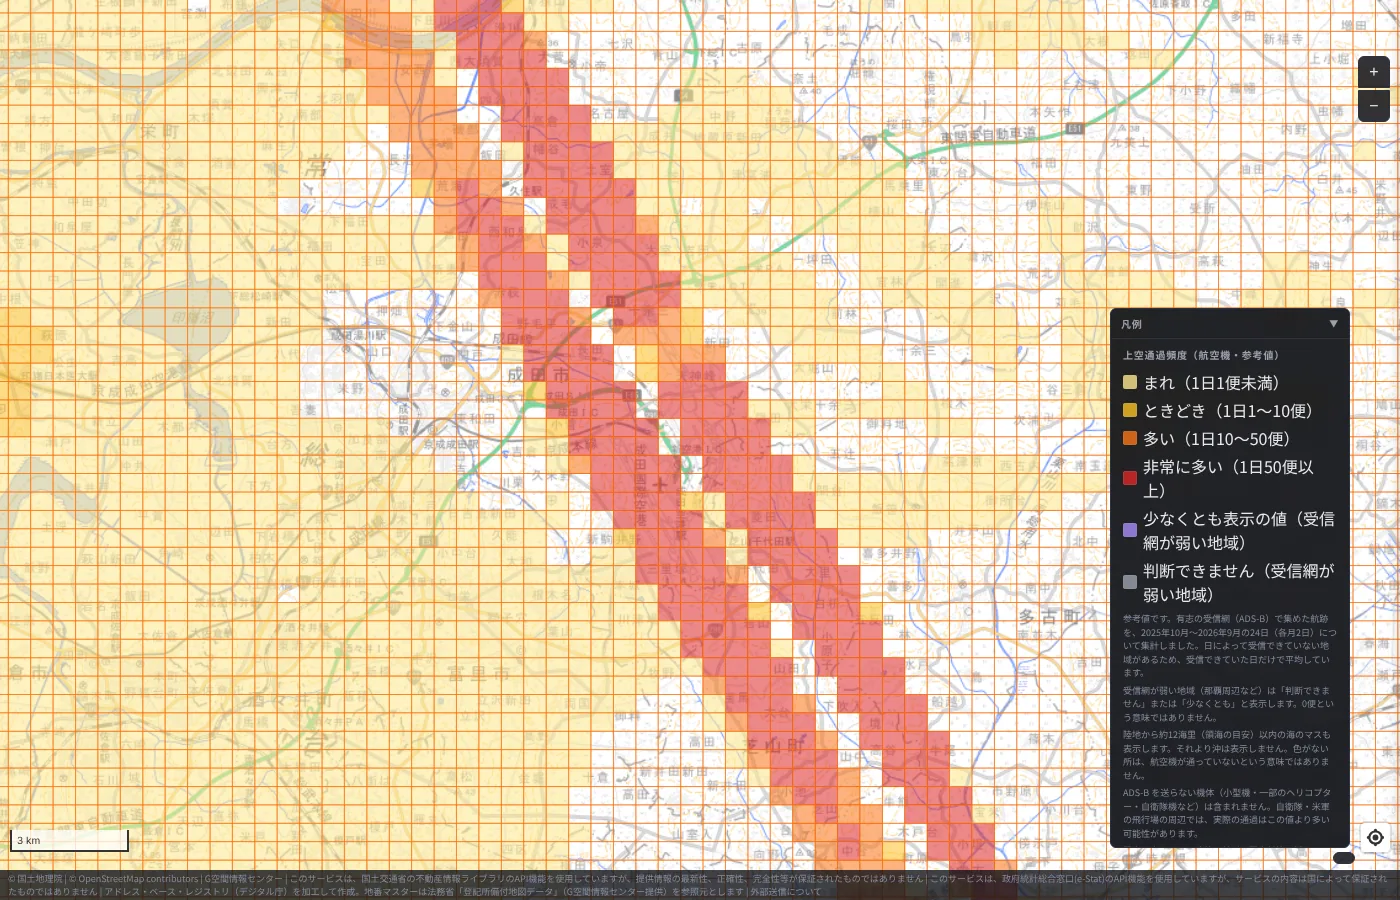
Narita looks completely different from Haneda. A thin red band stretches along the runway direction to the edge of the screen. The surroundings are mostly pale, so only the "road" the aircraft follow stands out.
Since opening, Narita has in principle not allowed takeoffs and landings from 23:00 to 6:00. From October 27, 2019, Runway A operations were extended to midnight. A new Runway C is scheduled to open in March 2029, and the shape of this band may change in the future.
Kansai: an island in the sea
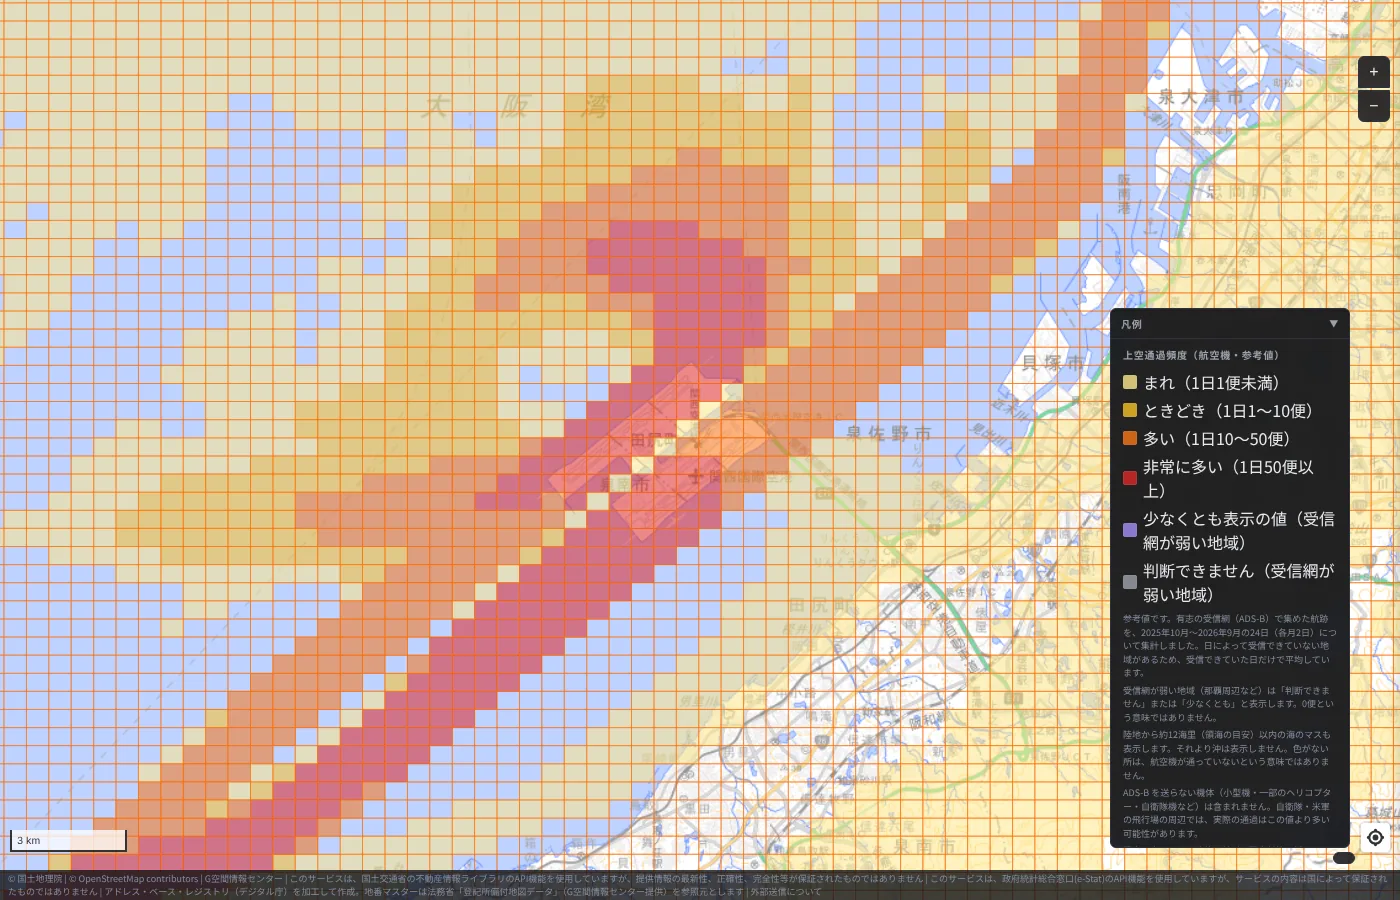
Kansai International Airport, opened in September 1994, sits on an artificial island in Osaka Bay. On the map, the red cells cluster on the island, and a long, narrow band stretches from it to the southwest over the sea.
I take this band to show that the approach paths to the island lie over the sea (see our article on Kansai and Centrair for details). Kansai added the 4,000 m Runway B in August 2007 and is described as Japan's first airport capable of full 24-hour operation.
Itami: a band through the city
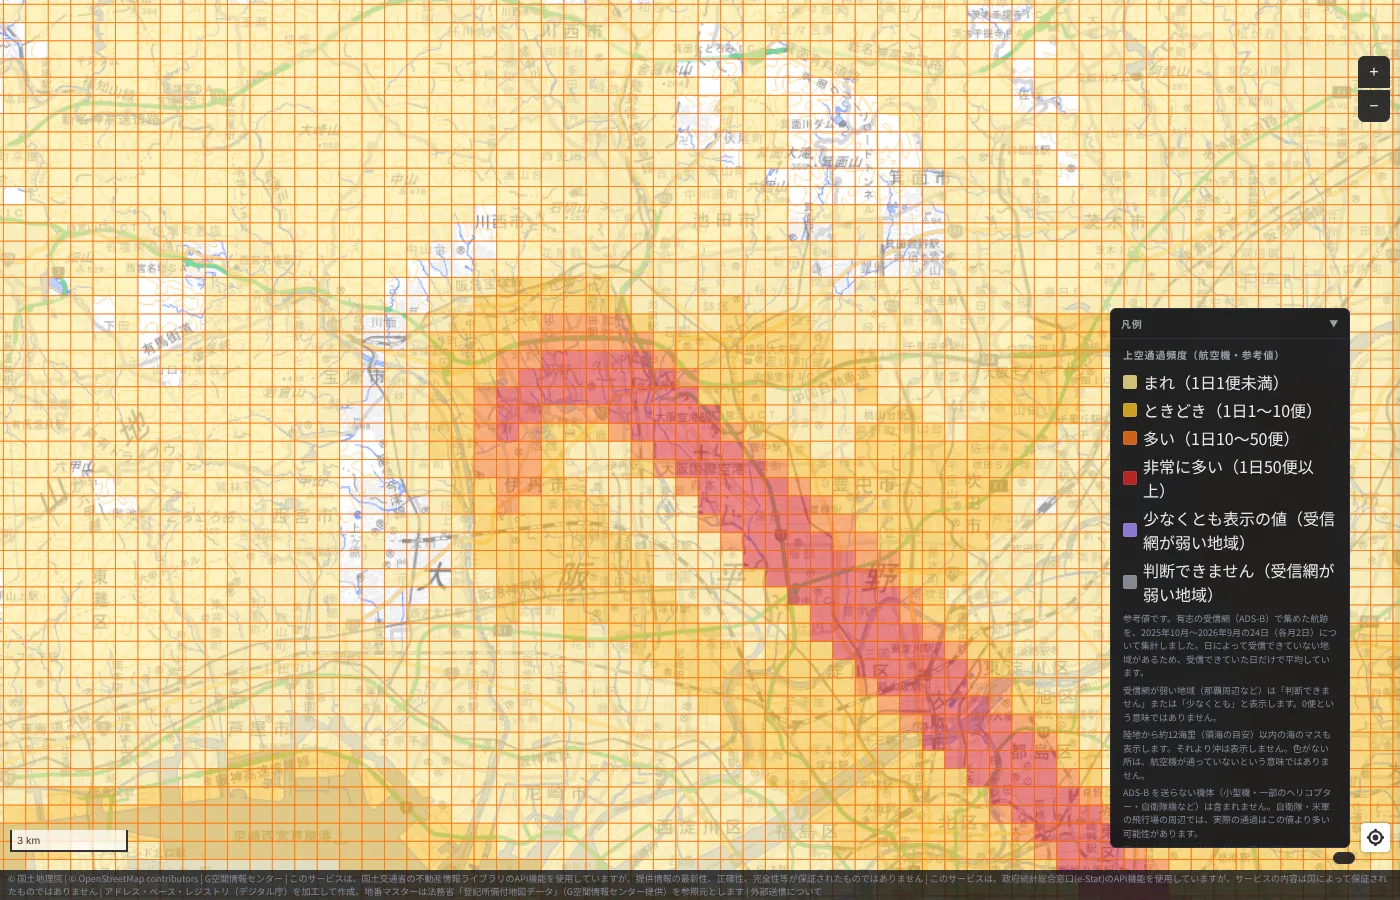
Of the five airports, Osaka International Airport (Itami) gave us the strongest sense of closeness to everyday life. A red band cuts diagonally through residential areas from Itami to Toyonaka and the north of Osaka. At the point we clicked, 56 flights per day passed within 1 km.
Itami operates from 7:00 to 21:00, with a cap of 370 flights per day. The night-time share (22:00–7:00) at the clicked point was also 0%. More than the number of flights, the color conveys how close the city and the airport are.
Fukuoka: a runway next to the city center
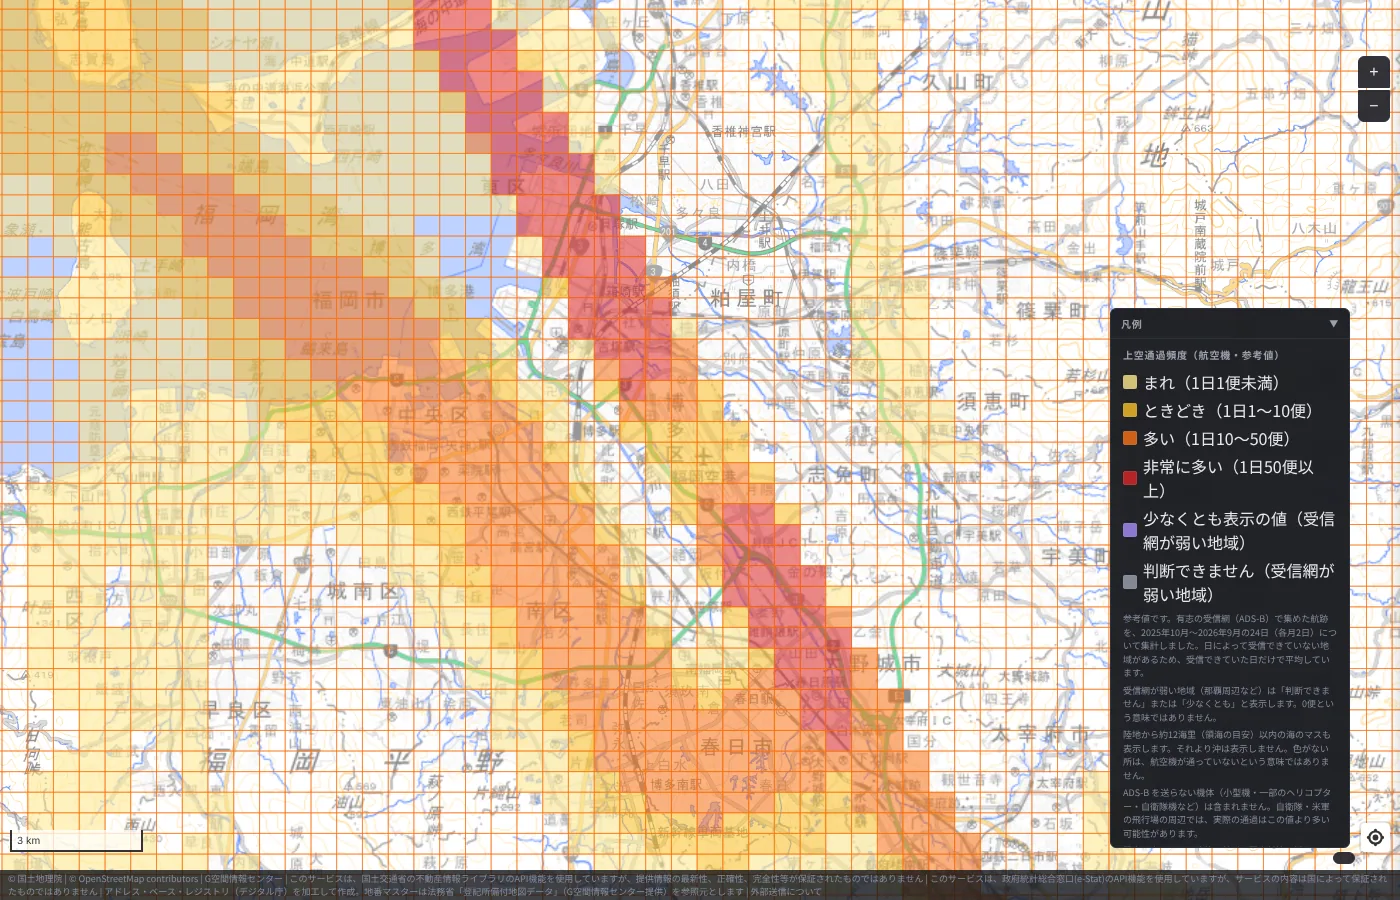
Last is Fukuoka Airport. A red band runs north to south from Hakata Bay through the airport toward Kasuga. The color distribution shows how close the runway is to the urban area.
On March 20, 2025, a 2,500 m additional runway opened at Fukuoka, giving the airport two runways. The aggregation period spans the time before and after that opening. Also, around Fukuoka some points were received on only 13 of the 24 days, so please keep the effect of receiver coverage in mind.
Five airports side by side
Placing the five airports side by side, each airport's character appears in the shape of its colors. Haneda spreads over an area, Narita forms a single band, Kansai clusters on its island, and Itami and Fukuoka run through the city. The differences in runway direction, operating hours and location seem to appear directly on the map.
How to view it in MAPRISE
In the "Living facilities / School districts" group, choose "Aircraft Overflight Frequency (Reference)". It can be displayed without logging in. Please take a look around your home, office or a property you are considering.
These are reference values only, so please also check the materials published by each airport and municipality before making important decisions. Questions and comments are welcome at info@maprise.jp.
Sources and references
- Aircraft overflight frequency: created from flight tracks by adsb.lol contributors (ODbL 1.0), Copernicus DEM and EGM2008
- Haneda's new flight path (in operation since March 29, 2020): MLIT
- Narita operating hours and new Runway C: Norimono News
- Osaka International Airport operating hours and flight cap: MLIT document
- Kansai International Airport runways and operation: MLIT document
- Fukuoka Airport's additional runway: Aviation Wire
- Maps and data: the provider and license of each dataset are listed in Data Sources, and the data available on the map in the Layer Catalog
Tags: #Aircraft overflight #Aircraft #Airports #Haneda #Narita #Kansai International #Itami #Fukuoka Airport #New layer
Other-language share text (exception cases)
Quick share above follows our platform-locked language policy (X-family in Japanese, LinkedIn in English). The four panes below let you grab the opposite-language body when needed — e.g. introducing an English post to a Japanese audience on X, or posting a Japanese article to LinkedIn in Japanese. Each pane offers both a copy button and a direct intent link.
📝 飛行機は、どこを飛んでいるのか ― 羽田・成田・関空・伊丹・福岡を「上空通過頻度」で見る
MAPRISEに「上空通過頻度(航空機・参考値)」レイヤーを追加しました。約500m四方のマス目ごとに、航空機が近くを1日に何便通るかを色で示します。羽田・成田・関西・伊丹・福岡の5空港を実際に表示して、空港ごとの違いを見ていきます。
https://maprise.jp/ja/blog/aircraft-overflight-airports/ #上空通過頻度 #航空機
🆕 新しいブログ記事を公開しました。

《飛行機は、どこを飛んでいるのか ― 羽田・成田・関空・伊丹・福岡を「上空通過頻度」で見る》

MAPRISEに「上空通過頻度(航空機・参考値)」レイヤーを追加しました。約500m四方のマス目ごとに、航空機が近くを1日に何便通るかを色で示します。羽田・成田・関西・伊丹・福岡の5空港を実際に表示して、空港ごとの違いを見ていきます。

👉 詳しくはこちら: https://maprise.jp/ja/blog/aircraft-overflight-airports/
📝 Where Do Airplanes Actually Fly? Haneda, Narita, Kansai, Itami and Fukuoka on the Aircraft Overflight Layer
MAPRISE now has an "Aircraft Overflight Frequency (Reference)" layer. For each cell of about 500 m, it shows by…
https://maprise.jp/en/blog/aircraft-overflight-airports/ #Aircraftoverflight #Aircraft
🆕 New on the MAPRISE blog.

《Where Do Airplanes Actually Fly? Haneda, Narita, Kansai, Itami and Fukuoka on the Aircraft Overflight Layer》

MAPRISE now has an "Aircraft Overflight Frequency (Reference)" layer. For each cell of about 500 m, it shows by color how many aircraft per day pass nearby. We display five airports — Haneda, Narita, Kansai, Itami and Fukuoka — and look at how they differ.

👉 Read the full post: https://maprise.jp/en/blog/aircraft-overflight-airports/

#Aircraftoverflight #Aircraft #Airports #Haneda #Narita
Related posts
- How Do Airports on the Sea Look on a Map? Kansai and Centrair on the Aircraft Overflight Layer2026-10-21
- Nagasaki Station at 1 m: What a Hillside City Really Looks Like ― Colored Contour Maps Built from Nagasaki Prefecture's Point Cloud2026-10-21
- Tsunami Disaster Warning Areas, Now Nationwide — Updating Our Preparedness While the Nankai Trough Stays Quiet2026-10-12