MAPRISE's colored contour map now covers the area around Nagasaki Station at 1 m resolution. Here is how we asked Nagasaki Prefecture whether we could use its open 3D point cloud, and what appeared when we placed it beside an ordinary map: reclaimed-land relief, small channels, graded school grounds and valleys.
Hello from the MAPRISE development team. As map-loving engineers, we have some happy news this time.
MAPRISE's colored contour map now covers the area around Nagasaki Station at 1 m resolution. We built the tiles ourselves from the 3D point cloud that Nagasaki Prefecture publishes. Seen at 1 m, Nagasaki, the "city of slopes," showed us terrain that we had never been able to see before. This post covers how we asked the prefecture about using the data, and what we actually found.
Why we contacted Nagasaki Prefecture
Until now, our colored contour map was drawn only from the elevation tiles of the Geospatial Information Authority of Japan (GSI) at 1 m, 5 m and 10 m. But Nagasaki has little flat land, and houses cling to its hillsides. At 5 m or 10 m, small steps partway up a slope can be missed.
That led us to the 3D point cloud (LAS format) that Nagasaki Prefecture publishes through "Open Nagasaki." However, we were not sure whether we could use it in a paid service's base map. If a dataset counts as public survey results, approval under the Survey Act is required.
So on October 15, 2026, we asked the Construction Planning Division of the prefecture's Department of Public Works three questions:
- Does the point cloud count as public survey results?
- Is an application for approval under Articles 43 and 44 of the Survey Act needed?
- May we deliver contour maps made from the point cloud as the base map of a paid service?
The prefecture's reply
We received a reply on October 20. Thank you very much.
- Under the prefecture's handling, LAS data does not count as public survey results.
- Therefore, an application for approval under the Survey Act is not required.
- If we follow the terms of use of Open Nagasaki (CC BY 4.0), there is no problem with delivering the data as the base map of a paid service. The condition is to show three items: the organization name, the resource name, and the URL.
- The prefecture has no plan, at present, to publish an elevation grid (DEM) or elevation tiles.
Because the prefecture does not publish elevation tiles, we decided to build the tiles ourselves from the point cloud.
| Item | Details |
|---|---|
| Coverage | 9 map sheets around Nagasaki Station (about 3 km × 2.25 km). This is not the whole of Nagasaki City |
| Source data | Point cloud from the folder published in March 2022, about 3.1 GB |
| Method | Converted to a 1 m elevation grid and delivered as 163 tiles (about 7.5 MB) |
| Accuracy check | Compared with GSI's 5 m mesh elevation (DEM5A) at about 290,000 points: mean difference −0.04 m, median absolute error 0.13 m, RMSE 1.81 m |
| Where errors are larger | Dense building areas and steep forested slopes (few ground points, so values are interpolated) |
Summing up the area covered, about one third is below 5 m in elevation and about one third is 50 m or higher (counted where the point cloud has data). The highest point is about 224 m. The numbers confirm a city where seaside lowland and mountains trade places within a few hundred meters.
Why 1 m matters
In a city of slopes, a few meters of height difference shapes daily life. At 10 m mesh, relief that is tens of meters wide is averaged away. At 1 m, small channels, steps in retaining walls and the edges of graded land show up as lines.
Let's compare them on real screens. Every figure below is an actual MAPRISE screen (contour interval 2 m). On the left is the existing map (pale map), in the middle is how it looked before (GSI elevation only), and on the right is the new Nagasaki Prefecture point cloud (1 m). They show the same place at the same scale, so you can check place names and facilities on the left map.
Five contour views that made us say "Whoa!"
1. Around the new prefectural office: even 1–2 m of relief on reclaimed land becomes lines
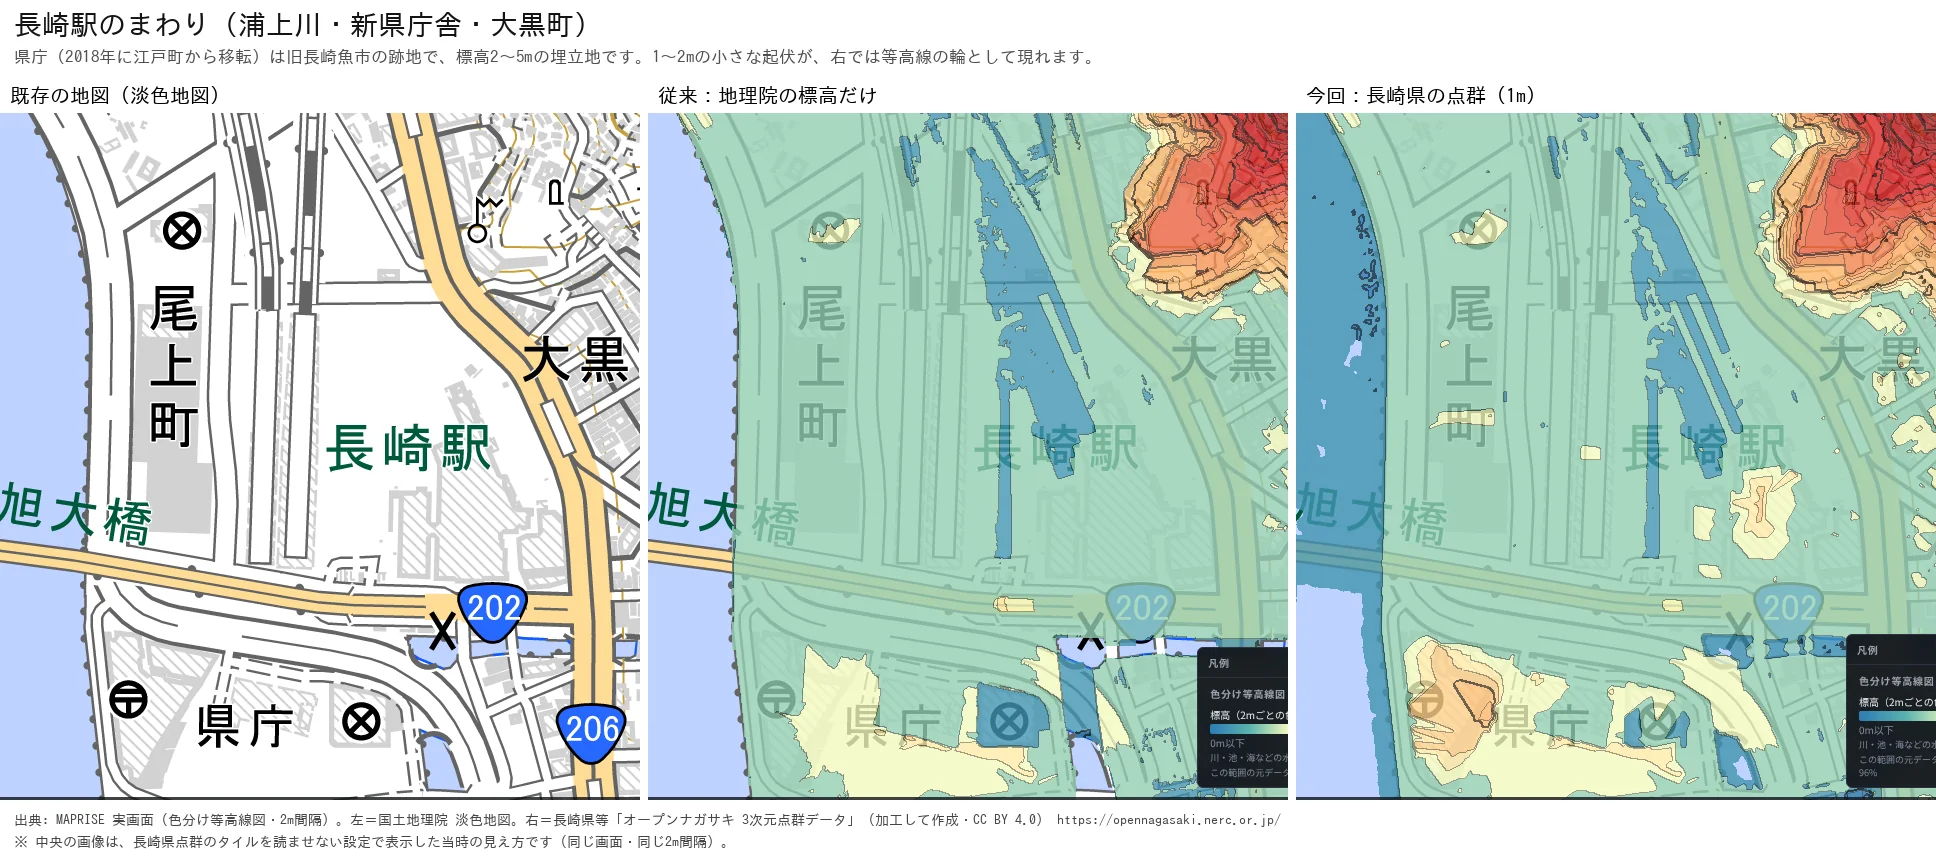
On the left map you can see the label for the prefectural office (県庁) on the harbor side of Nagasaki Station. The Nagasaki Prefectural Office moved here from Edo-machi in 2018. The new building stands on the former Nagasaki fish market site next to the station, on the harbor side.
This area is land created by the reclamation of the inner harbor, completed in 1904. According to the point cloud, its elevation is 2–5 m. In the right-hand image, small relief of 1–2 m on that flat reclaimed land appears as rings of contour lines.
The former prefectural office in Edo-machi, by contrast, stood at the tip of a cape. In the late 16th century the "Misaki Church" was built there, and in the early Edo period the Nagasaki magistrate's Nishi-yakusho office was placed on the site. The old office stood on a cape, the new one stands on reclaimed land, and 1 m elevation data lets you compare two places with completely different terrain on the same map.
We have not confirmed what causes the rings seen here (for example, fill or the remains of structures). For now, please read this simply as "even reclaimed land has 1–2 m of relief."
2. Onoe-machi and Saiwai-machi: channels and embankment lines on seemingly flat lowland
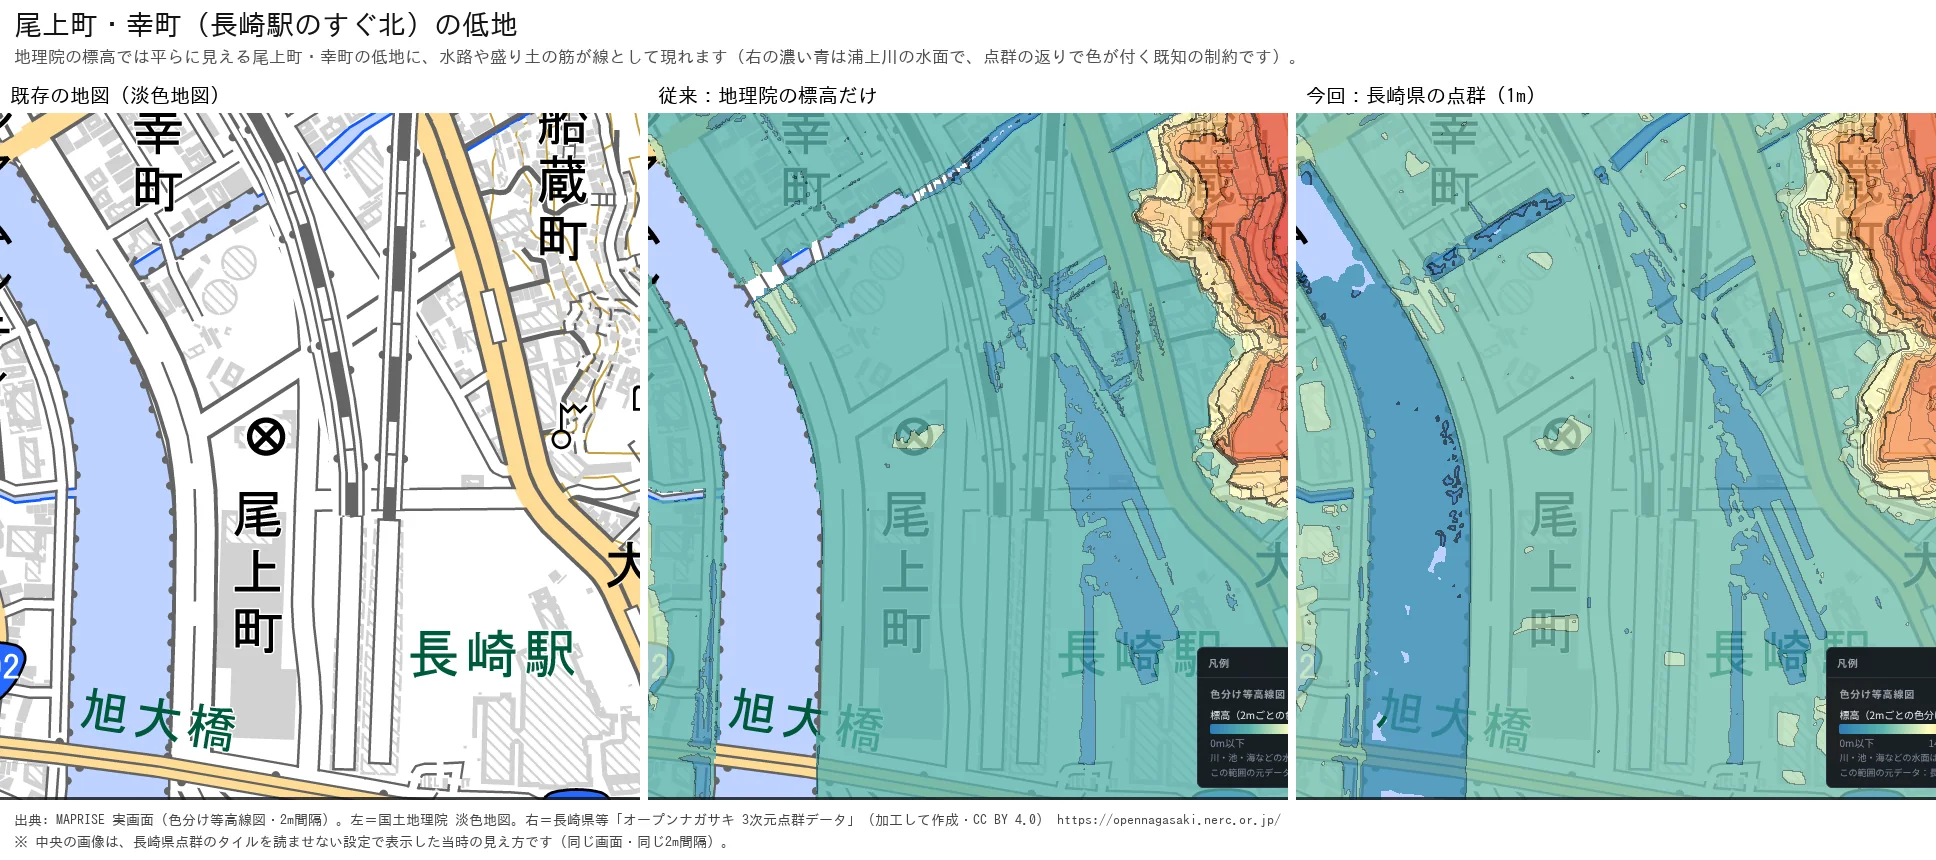
This is just north of Nagasaki Station, on the east side of the Urakami River. With GSI elevation alone, the lowland is almost one uniform color. In the 1 m point cloud, thin channels and slight embankment lines appear as lines.
The dark blue in the right-hand image is the surface of the Urakami River. Because the point cloud also has returns from water surfaces, rivers are colored. This is a known limitation at present.
3. 1 m versus "10 m equivalent" (Onoe-machi and Saiwai-machi area)
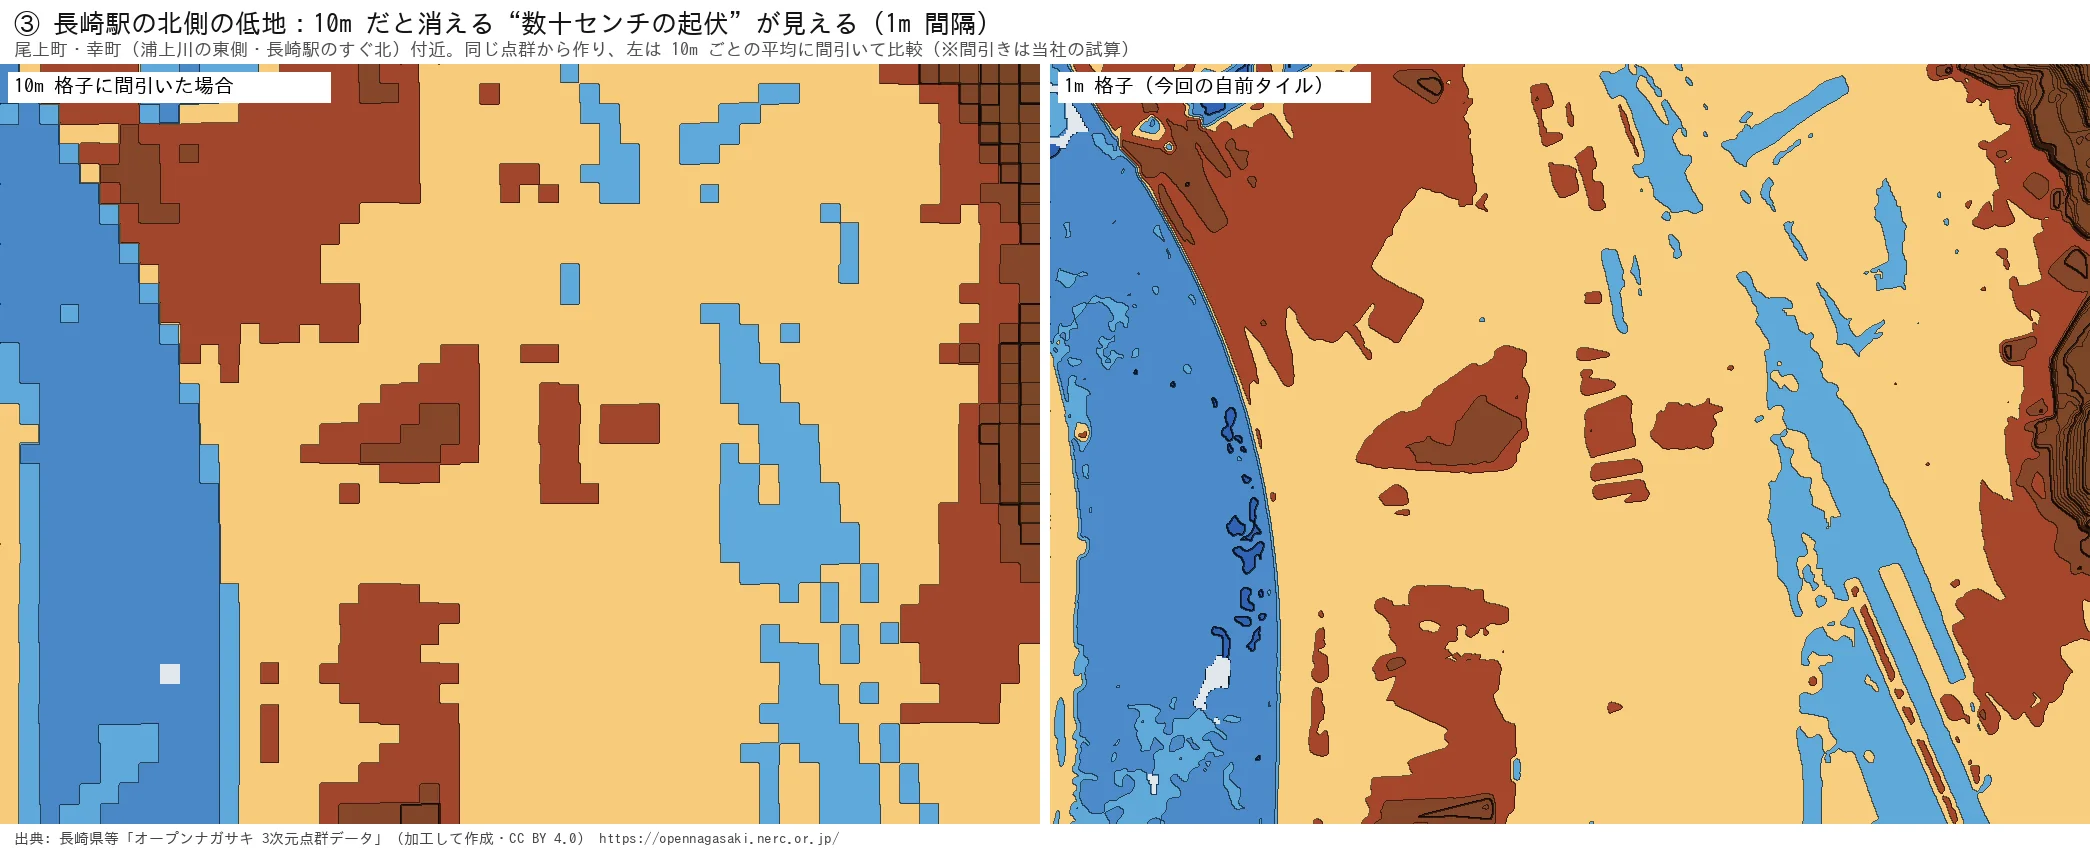
We looked at the same place as in view 2 from closer up. The left image is the same point cloud thinned to 10 m averages. It turns into blocky squares, and the channels and embankment lines vanish. In the 1 m image on the right, relief of tens of centimeters becomes lines.
The left image is our own estimate made by thinning the 1 m data, not GSI data itself. What we wanted to show with this figure is that there is a world you can only see at 1 m.
4. Tateyama: the flat grounds of Nagasaki Higashi Junior and Senior High School
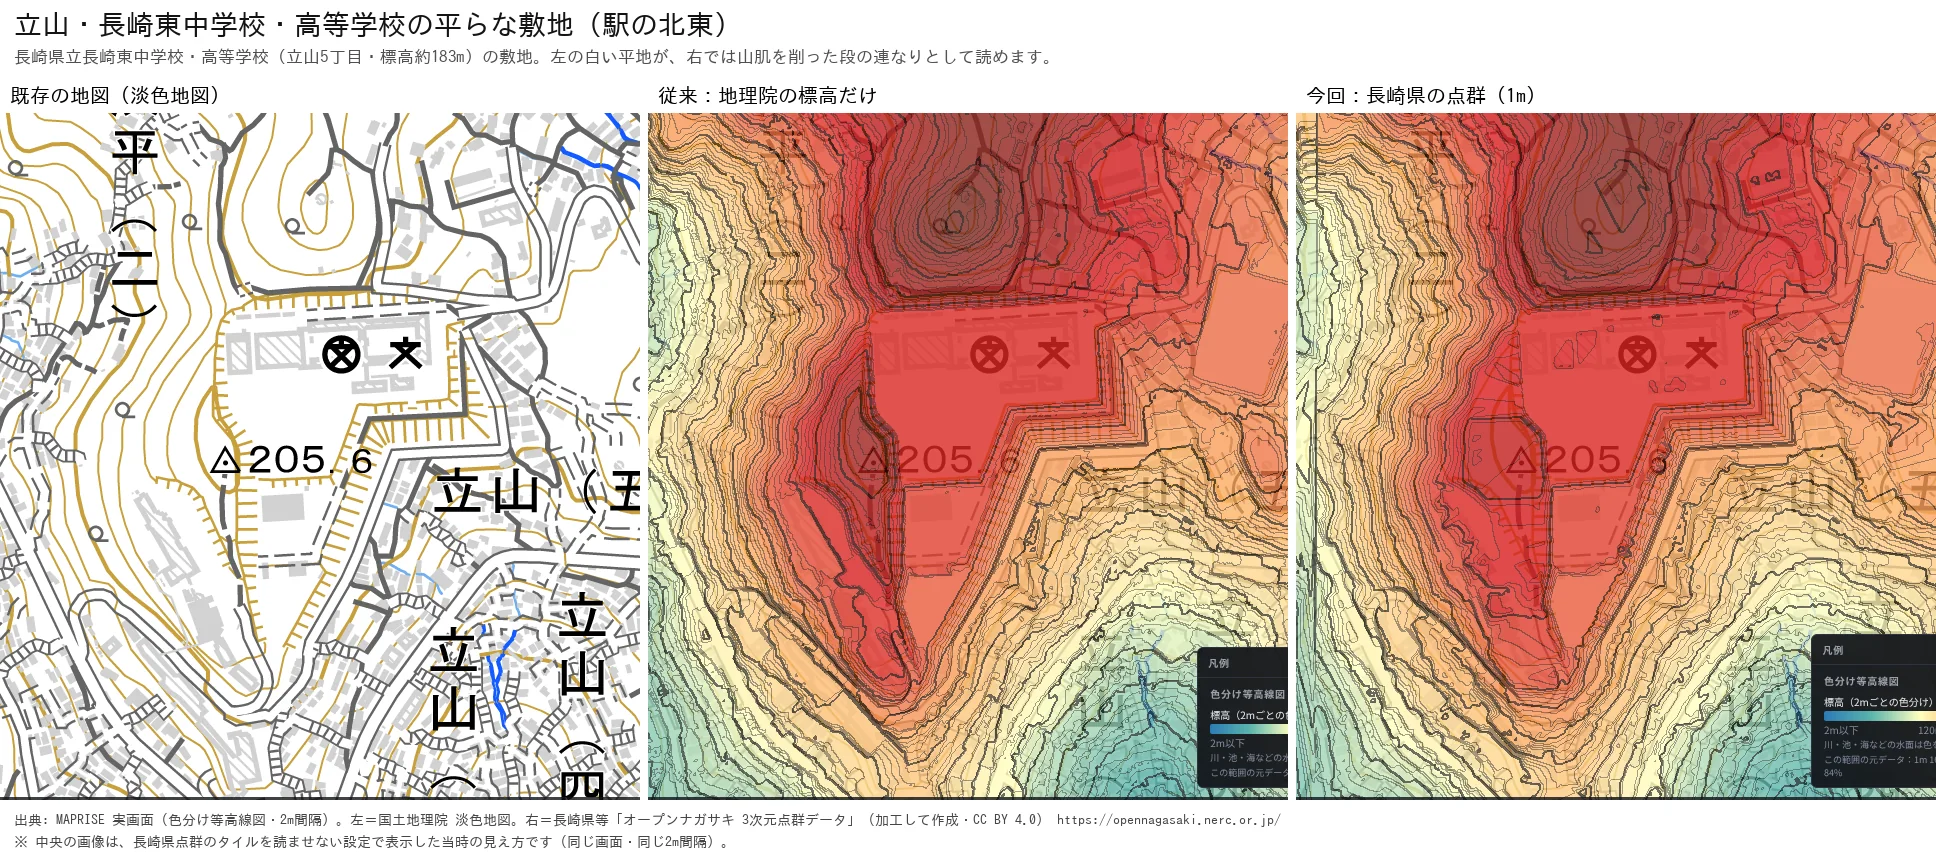
This is the hillside of Tateyama, northeast of the station. On the left map, the grounds of Nagasaki Prefectural Nagasaki Higashi Junior and Senior High School (Tateyama 5-chome) appear as a white flat area. Its elevation is about 183 m.
In the contour map on the right, the edge of that area is a series of stair-like steps cut into the hillside. Outside the grounds, the contour lines on the slope suddenly crowd together.
Even within Nagasaki, view 1 is a seaside at 2 m elevation and view 4 is high on a mountain at 183 m. Being able to switch between them on one map is the joy of contour maps.
5. Hamahira, Tenjin-machi and Mifunekura-machi: valleys and ridges in sharp relief
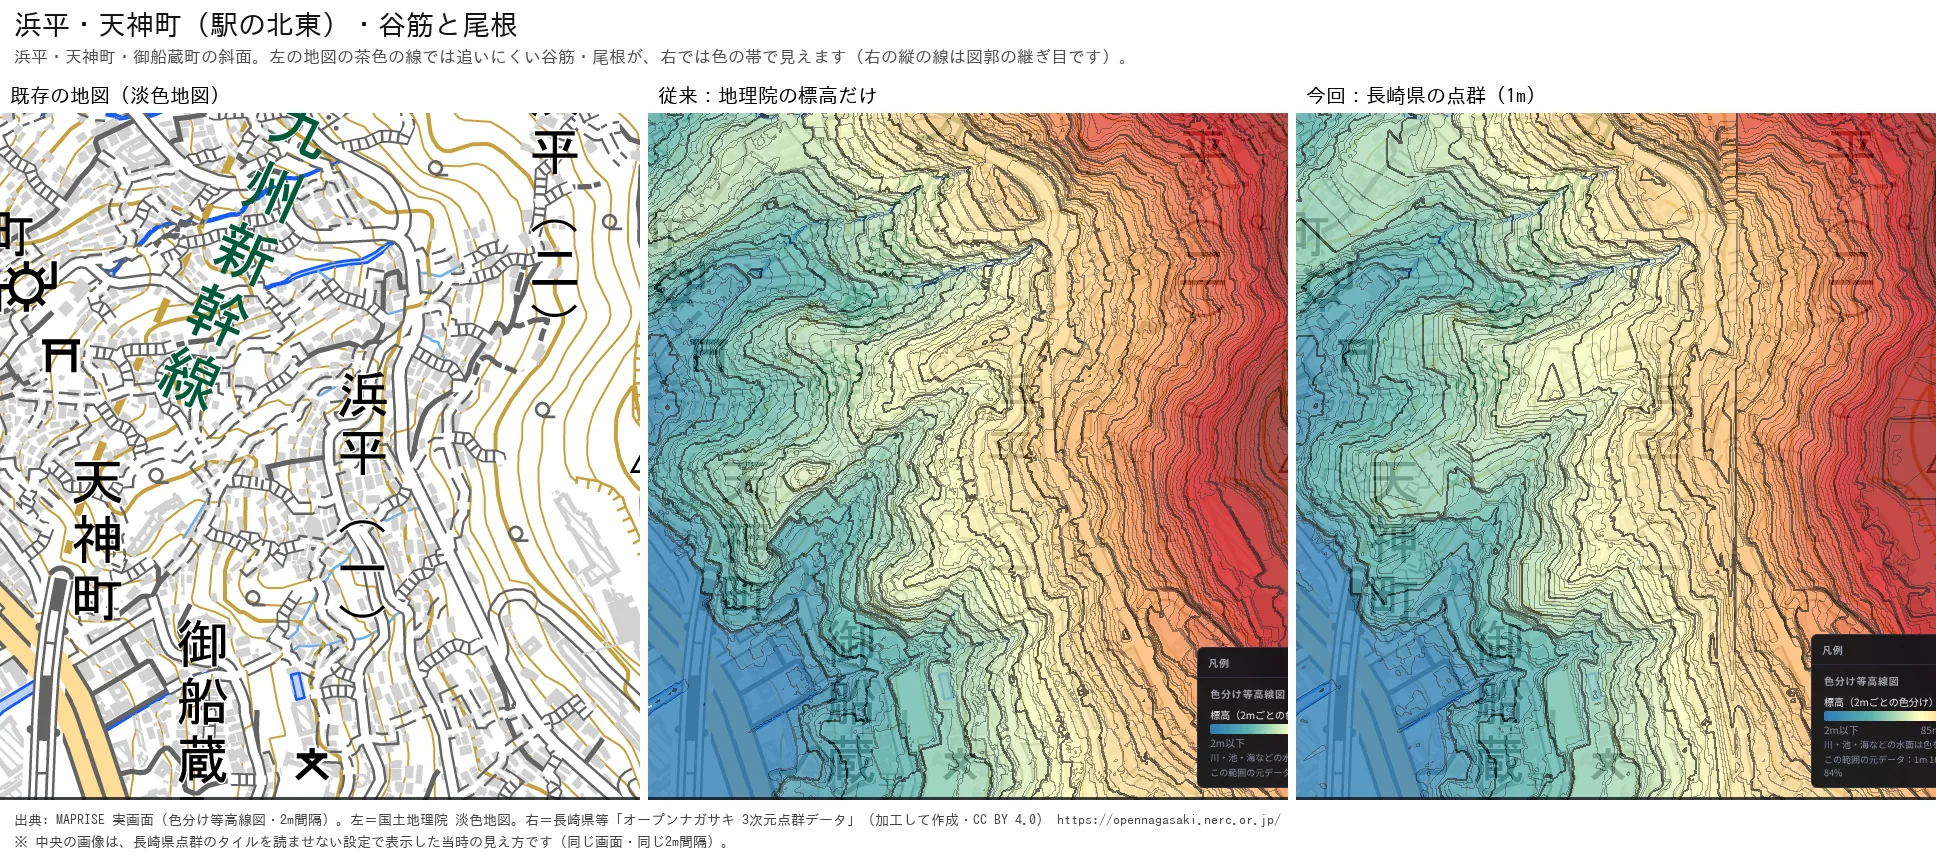
This is a slope northeast of the station. Valleys and ridges that are hard to follow with the brown lines of the left map alone can be read as color bands on the right.
This image also shows a weakness of point clouds. The single vertical line on the right is a seam between map sheets. Also, because the ground under trees and buildings is interpolated, some places look smoother than the real ground. We hope you will enjoy that too, as the "true face" of 1 m data.
How to see it in MAPRISE
Choose "Colored contour map" from MAPRISE's base maps and switch the contour interval. Around Nagasaki Station, zoom in to level 16 or higher and the map is drawn from the Nagasaki Prefecture point cloud. Outside that area, or when zoomed out further, it is drawn from GSI data as before.
We think this is useful for property reconnaissance, checking graded land and slopes, and preparing for a walk through the city, the kind of uses that suit a hillside town.
About the data in this article
- The 1 m mesh covers only the area around Nagasaki Station (about 3 km × 2.25 km). It does not cover the whole of Nagasaki City.
- The point cloud comes from the folder published in March 2022. In some places the terrain differs from the latest GSI data.
- Water surfaces such as rivers may be colored because of returns in the point cloud.
- Elevations contain errors, and the actual heights are not guaranteed.
- The "middle" panels show GSI elevation only, displayed with the Nagasaki Prefecture tiles switched off. The "10 m equivalent" in view 3 is our own estimate made by thinning the point cloud.
- The statements about the prefectural office, land reclamation and the former prefectural office rely on the references below. We have not confirmed what causes the relief in view 1.
- Place names and facilities on the maps follow the notation of GSI's pale map.
Closing
Looking at Nagasaki, the city of slopes, at 1 m showed us the same land with an entirely different face. The coverage is only the area around Nagasaki Station for now, but we hope to extend it wherever we can.
Once again, we thank the staff of Nagasaki Prefecture who replied about the use of the point cloud.
Questions and feedback are welcome at info@maprise.jp.
Sources and references
- Nagasaki Prefecture et al., "Open Nagasaki 3D Point Cloud Data" (processed; CC BY 4.0): https://opennagasaki.nerc.or.jp/
- History of the Nagasaki fish market (in Japanese): https://www.nagasaki-uo.co.jp/ichiba_history01.htm
- Nagasaki City, "Chapter 3: Topography and Geology" (in Japanese): https://www.city.nagasaki.lg.jp/uploaded/attachment/3204.pdf
- Nagasaki City, "History of Nagasaki Port" (in Japanese): https://www.city.nagasaki.lg.jp/nagazine/hakken0708/index1.html
- Nagasaki Prefectural Office building (Wikipedia, in Japanese): https://ja.wikipedia.org/wiki/%E9%95%B7%E5%B4%8E%E7%9C%8C%E5%BA%81%E8%88%8E
- Nagasaki Shimbun, "Former prefectural office site to be nominated as a national historic site" (January 2, 2026, in Japanese): https://www.nagasaki-np.co.jp/kijis/?kijiid=cb460164b3014f27856160803bffc23e
- Maps and data: pale map and elevation tiles (Geospatial Information Authority of Japan), processed and displayed in MAPRISE. The providers and licenses of each dataset are listed in the data sources list, and the data viewable on the map is summarized in the layer guide.
Tags: #Nagasaki #contour #colored contour map #point cloud #open data #elevation #1 m mesh #hillside city #Open Nagasaki
Other-language share text (exception cases)
Quick share above follows our platform-locked language policy (X-family in Japanese, LinkedIn in English). The four panes below let you grab the opposite-language body when needed — e.g. introducing an English post to a Japanese audience on X, or posting a Japanese article to LinkedIn in Japanese. Each pane offers both a copy button and a direct intent link.
📝 長崎駅のまわりを「1m」で見たら、坂の街の正体が見えてしまった ― 長崎県の点群で作った色分け等高線図
MAPRISEの色分け等高線図に、長崎駅周辺の1mメッシュ標高を追加しました。長崎県の公開している3次元点群を使えるかを県に照会した経緯と、既存の地図と並べて見えた、埋立地の起伏・水路・造成地の段・谷筋を紹介します。
https://maprise.jp/ja/blog/nagasaki-station-1m-contour/ #長崎 #等高線
🆕 新しいブログ記事を公開しました。

《長崎駅のまわりを「1m」で見たら、坂の街の正体が見えてしまった ― 長崎県の点群で作った色分け等高線図》

MAPRISEの色分け等高線図に、長崎駅周辺の1mメッシュ標高を追加しました。長崎県の公開している3次元点群を使えるかを県に照会した経緯と、既存の地図と並べて見えた、埋立地の起伏・水路・造成地の段・谷筋を紹介します。

👉 詳しくはこちら: https://maprise.jp/ja/blog/nagasaki-station-1m-contour/
📝 Nagasaki Station at 1 m: What a Hillside City Really Looks Like ― Colored Contour Maps Built from Nagasaki Prefecture's Point Cloud
MAPRISE's colored contour map now covers the area around Nagasaki Station at 1 m resolution. Here …
https://maprise.jp/en/blog/nagasaki-station-1m-contour/ #Nagasaki #contour
🆕 New on the MAPRISE blog.

《Nagasaki Station at 1 m: What a Hillside City Really Looks Like ― Colored Contour Maps Built from Nagasaki Prefecture's Point Cloud》

MAPRISE's colored contour map now covers the area around Nagasaki Station at 1 m resolution. Here is how we asked Nagasaki Prefecture whether we could use its open 3D point cloud, and what appeared when we placed it beside an ordinary map: reclaimed-land relief, small channels, graded school grounds and valleys.

👉 Read the full post: https://maprise.jp/en/blog/nagasaki-station-1m-contour/

#Nagasaki #contour #coloredcontourmap #pointcloud #opendata
Related posts
- Who Looks After the Slope and Retaining Wall Beneath a Cliff-Top Property? ― The Zushi Accident, and Yellow Zones Across Japan on a Split-Screen Elevation Map2026-10-24
- Where Do Airplanes Actually Fly? Haneda, Narita, Kansai, Itami and Fukuoka on the Aircraft Overflight Layer2026-10-21
- How Do Airports on the Sea Look on a Map? Kansai and Centrair on the Aircraft Overflight Layer2026-10-21