At MAPRISE, an agent checks for new government data releases every month on its own, and carries the update through retrieval, verification, and publication end to end. We've also built a system that makes clear how much is actually known versus assumed for every building we cover, expanded published land price data to all 47 prefectures, and moved to round-the-clock uptime.
Hello from the MAPRISE development team. MAPRISE ingests a large volume of open data published by national and local government, and delivers it through the map, AI chat, and PDF reports. Expanding the range and coverage of that data matters, but just as important is having a way to keep confirming how accurate that data actually is, right now. This post isn't about a single new feature — it's a roundup of the work we've done to strengthen that accuracy, plus a closer look at how to read our building data.
Making clear what's known and what's assumed - disclosing building data coverage
MAPRISE uses PLATEAU (Japan's 3D city model, maintained by the Ministry of Land, Infrastructure, Transport and Tourism) to analyze earthquake collapse probability for individual buildings across several scenarios. That analysis is only as precise as the structure-type and construction-year data behind it. So what should happen for buildings where that data simply hasn't been compiled yet?
We reached out to the Project PLATEAU office directly and received an official response (received August 5, 2026). We also ingested their officially published "Attribute Disclosure List" (as of March 31, 2026), so the system now knows, for each municipality we cover, whether structure and construction-year data has actually been compiled there at all.
As a result, for buildings in municipalities where structure and year-built data isn't available, we now clearly state — in the PDF report, the AI chat response, and the map popup, in both Japanese and English — that the collapse probability shown is a reference value based on conservative assumptions ("wood-frame construction," "pre-1981 seismic standard"), not measured data. Users can now tell at a glance whether a given figure comes from actual data or from an assumption.
Since this is information people use to make real business decisions, we believe distinguishing what we actually know from what we're assuming matters just as much as the number itself.
Three ways to color PLATEAU buildings, and when to use each
The PLATEAU buildings layer on the map can be colored three different ways, depending on what you're trying to see.
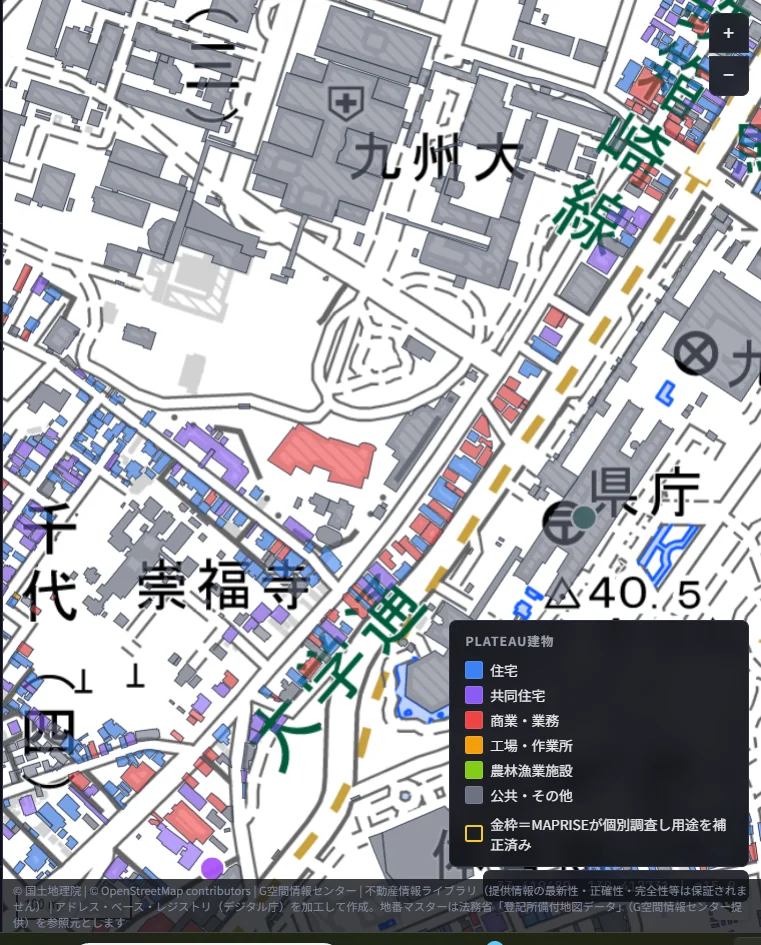
Usage — colors buildings by use: residential, multi-family residential, commercial/office, industrial/workshop, agriculture/forestry/fishery facilities, and public facilities. Use this when you want a read on how an area's land use is distributed.
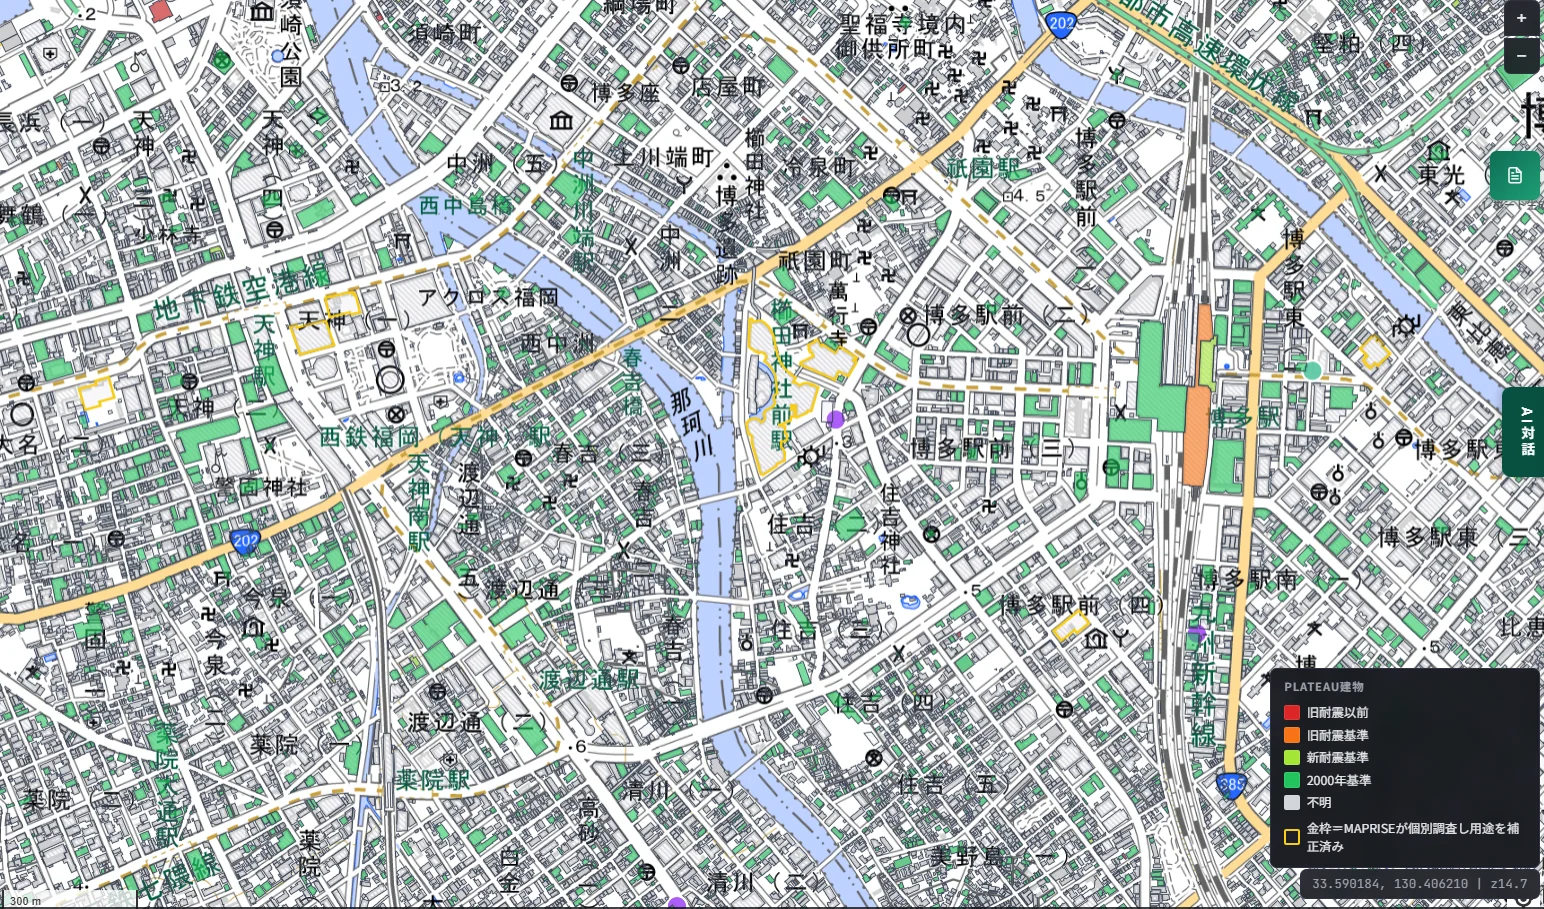
Seismic standard era — colors buildings by construction year, in four bands based on Japan's building seismic standard revisions: pre-1970, 1971–1981 (old standard), 1982–1999 (new standard), and 2000 onward. Use this when you want an area-wide read on which seismic standard the buildings around you were built under. Buildings with an unknown construction year are shown faint and labeled "unknown," so they never get mistaken for measured data.
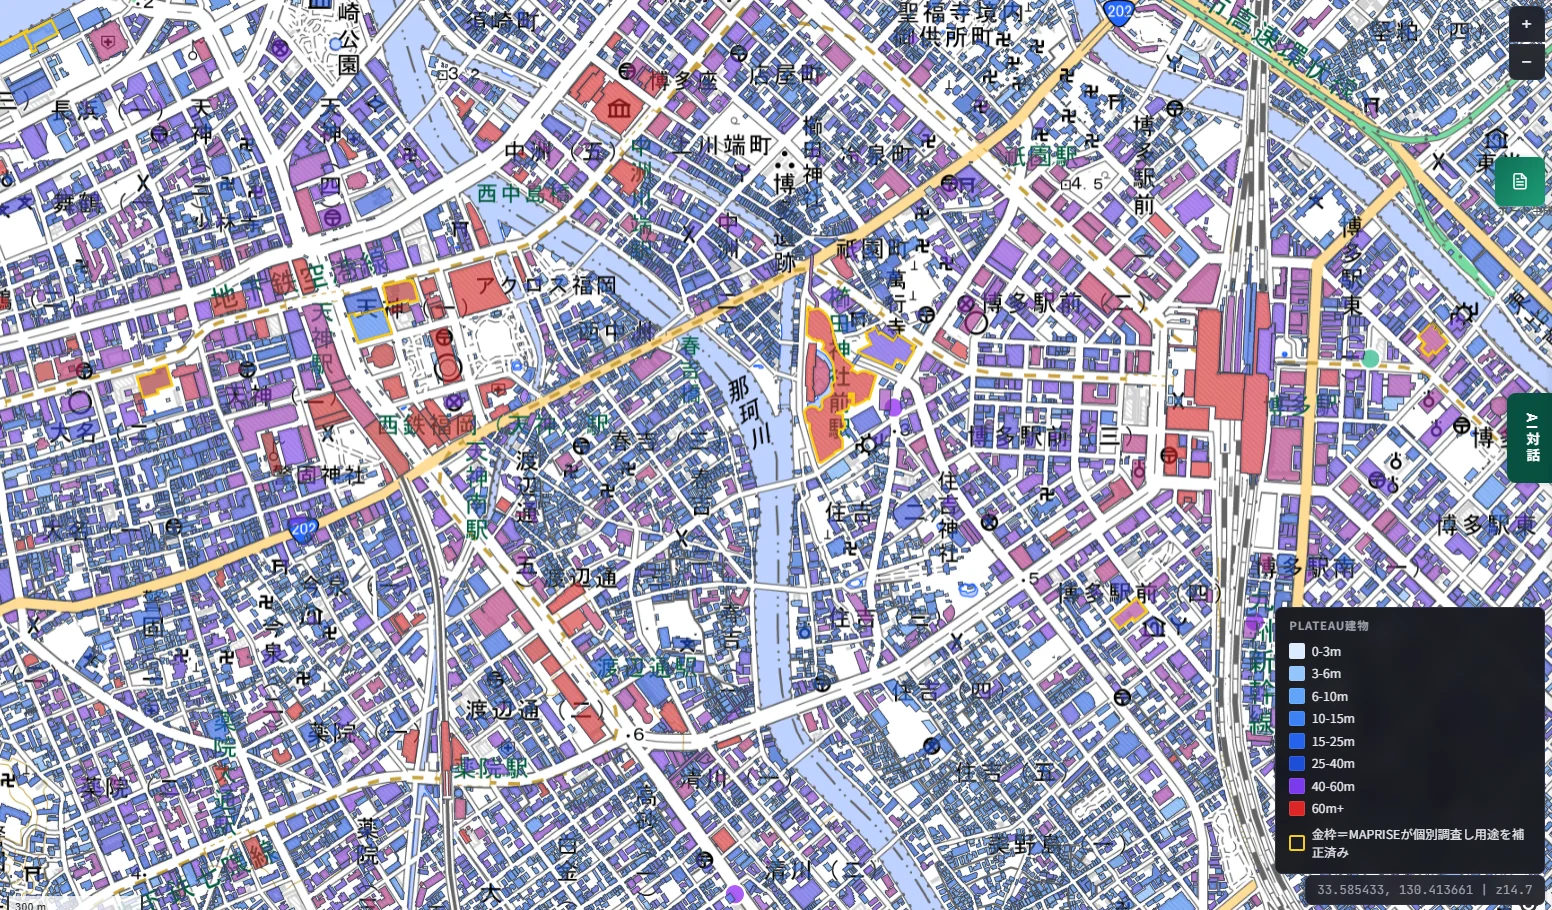
Height — colors buildings on an 8-step gradient from 0–3m up to 60m+. Use this when you want to see a neighborhood's skyline or where large structures are concentrated.
In any of the three modes, clicking a building shows its construction year, seismic standard, height, floor count, and structure type — and from there you can jump straight into the AI chat for a per-scenario collapse probability analysis.
An agent, running every month, that checks for government data releases on its own
PLATEAU isn't unique — nearly all the public open data we work with gets updated by its source agency or municipality on an ongoing basis. Checking for those updates by hand isn't realistic at scale. So we built an agent that runs unattended (an automated pipeline built on AWS Step Functions). On the 5th of every month, this agent checks government data releases on its own, and when it finds an update, carries it through retrieval, verification, ingestion into the database — and for PLATEAU, recomputing the earthquake simulation as well — all the way through to publication.
During ingestion, the agent automatically runs the update through several quality gates, checking that the data hasn't degraded and isn't in an unexpected format. Results are reported by email, and if anything abnormal is detected, the process halts and flags it for a person to review. The goal is to eliminate the uncertainty of "did the update actually land?" and "is the data that landed intact?" at the system level.
To be clear about what this agent is and isn't: it's a separate system from the AI chat feature you talk to on the map (which runs on a Bedrock Agent). The update agent acts autonomously, with no human judgment in the loop, on a fixed schedule; the AI chat is built for conversing with users. The two don't overlap.
A problem common to many GIS and data-driven services is that they launch with current data, but once the update work is left to a person, it tends to slip whenever that person changes roles or simply gets busy — and before long, the service is quietly running on data that's years out of date. We designed our update process not to depend on anyone's memory or good intentions: an agent runs it autonomously instead. Staff can change, or simply forget, and the data keeps updating regardless. As a side benefit, the time we used to spend on manual updates is now available for the development team to spend on more substantive feature work.
Land price data, now nationwide instead of Kyushu-only
We ingested the 2026 edition of Japan's published land price data and expanded coverage from Kyushu's 7 prefectures to all 47 prefectures nationwide. We added 25,565 new records, bringing the nationwide total to 114,165 records alongside the existing 2,312 records for Kyushu, which remain completely unchanged by this expansion.
We also overhauled the ingestion process itself to follow the government's official data specification directly, which lets us record price, location, and land-use classification more accurately. For anyone working on land transactions or collateral valuation outside Kyushu, being able to compare against this same published-price benchmark is a quiet but meaningful step forward.
Available around the clock
Until now, MAPRISE had a brief nightly maintenance window for cost reasons. We've eliminated that window, so the map, AI chat, and PDF report generation are all now available 24 hours a day. This should help anyone preparing for an on-site visit late at night, or overseas investors working across time zones, who no longer need to plan around a specific window.
Quieter improvements, too
We've also added daily monitoring of server disk capacity, so we can catch capacity issues before they cause an outage, and strengthened the safety checks applied to AI chat responses across every response path.
None of what's described here is a visible new feature, but all of it supports the foundation the data you rely on sits on. We'll keep expanding what MAPRISE covers, while continuing to strengthen the mechanisms — and the agents — that keep it accurate.
PLATEAU building data referenced in this article is licensed under CC BY 4.0 (the Attribute Disclosure List under PDL 1.0). Published land price and prefectural land price survey data is sourced from MLIT's National Land Numerical Information. AI-based collapse-probability analysis is provided for reference only and does not guarantee the seismic performance of any individual building.
Tags: #Data quality #PLATEAU #Land prices #Automated updates #Uptime
Other-language share text (exception cases)
Quick share above follows our platform-locked language policy (X-family in Japanese, LinkedIn in English). The four panes below let you grab the opposite-language body when needed — e.g. introducing an English post to a Japanese audience on X, or posting a Japanese article to LinkedIn in Japanese. Each pane offers both a copy button and a direct intent link.
📝 データを更新し続けるのは、人ではなくエージェントです ― 建物属性の開示・地価公示の全国展開・24時間稼働へ
MAPRISEでは、国のデータ公開を毎月みずから確認し、取得・検証・反映までを完結させるエージェントが動いています。あわせて、建物データについて「どこまで分かっていて、どこから先は仮定なのか」を明示する仕組み、地価公示データの全国47都道府県への拡大、24時間いつでも使える体制への移行についてもご報告します。
https://maprise.jp/ja/blog/data-quality-and-uptime/ #データ品質 #PLATEAU
🆕 新しいブログ記事を公開しました。

《データを更新し続けるのは、人ではなくエージェントです ― 建物属性の開示・地価公示の全国展開・24時間稼働へ》

MAPRISEでは、国のデータ公開を毎月みずから確認し、取得・検証・反映までを完結させるエージェントが動いています。あわせて、建物データについて「どこまで分かっていて、どこから先は仮定なのか」を明示する仕組み、地価公示データの全国47都道府県への拡大、24時間いつでも使える体制への移行についてもご報告します。

👉 詳しくはこちら: https://maprise.jp/ja/blog/data-quality-and-uptime/

#PLATEAU
📝 An agent, not a person, keeps this data current - building attribute disclosure, nationwide land prices, and 24/7 uptime
At MAPRISE, an agent checks for new government data releases every month on its own, and carries the updat…
https://maprise.jp/en/blog/data-quality-and-uptime/ #Dataquality #PLATEAU
🆕 New on the MAPRISE blog.

《An agent, not a person, keeps this data current - building attribute disclosure, nationwide land prices, and 24/7 uptime》

At MAPRISE, an agent checks for new government data releases every month on its own, and carries the update through retrieval, verification, and publication end to end. We've also built a system that makes clear how much is actually known versus assumed for every building we cover, expanded published land price data to all 47 prefectures, and moved to round-the-clock uptime.

👉 Read the full post: https://maprise.jp/en/blog/data-quality-and-uptime/

#Dataquality #PLATEAU #Landprices #Automatedupdates #Uptime
Related posts
- Just Type an Address, and the Official Roadside Land Price Map Opens Instantly2026-09-13
- From 7 prefectures in Kyushu to nationwide - a day spent checking data one sheet at a time2026-08-14
- Active Faults, Mapped — From the 2016 Kumamoto Earthquake's Source Fault to the Kego, Uemachi, and Tachikawa Faults2026-09-23