We've added "Multi-stage Flood Simulation" data — newly compiled as National Land Numerical Information in fiscal 2025 — to MAPRISE. Switch between rainfall scales, from a frequent 1-in-10-year storm to the theoretical maximum 1-in-150-year event, and watch how flood extent and depth change on the map. We walk through it using the Onga River basin as an example.
Hello from the MAPRISE development team. Today we're introducing a layer with an unfamiliar name: "Multi-stage Flood Simulation" (tadankai shinsui sotei). It's brand-new data, compiled as National Land Numerical Information in fiscal 2025, covering the 15 major nationally-managed river systems in Kyushu — and it lets you see, stage by stage, how flood extent and depth change with the scale of rainfall.
What this layer shows
A typical flood hazard map usually shows just one scenario — the "assumed maximum scale." What sets this layer apart is that you can switch between rainfall scales and compare how the flooding spreads. The "Rainfall scale (annual exceedance probability)" control in the left panel offers five levels — 1-in-10 years (frequent), 1-in-30, 1-in-50, 1-in-100, and 1-in-150 years (assumed maximum scale) — and both the polygon extent and the color (flood depth) update as you switch between them.
One clarification worth making here: "1-in-150 years" doesn't mean "this will happen in 150 years." It means rainfall of this scale has roughly a 1-in-150 chance of occurring in any given year. So this isn't a timeline — think of it instead as several scenarios laid side by side, each with a different probability of occurring.
Looking at the Onga River basin
Let's look at an actual screen. Below is the Onga River basin around Kitakyushu City, shown at the 1-in-100-year scale.
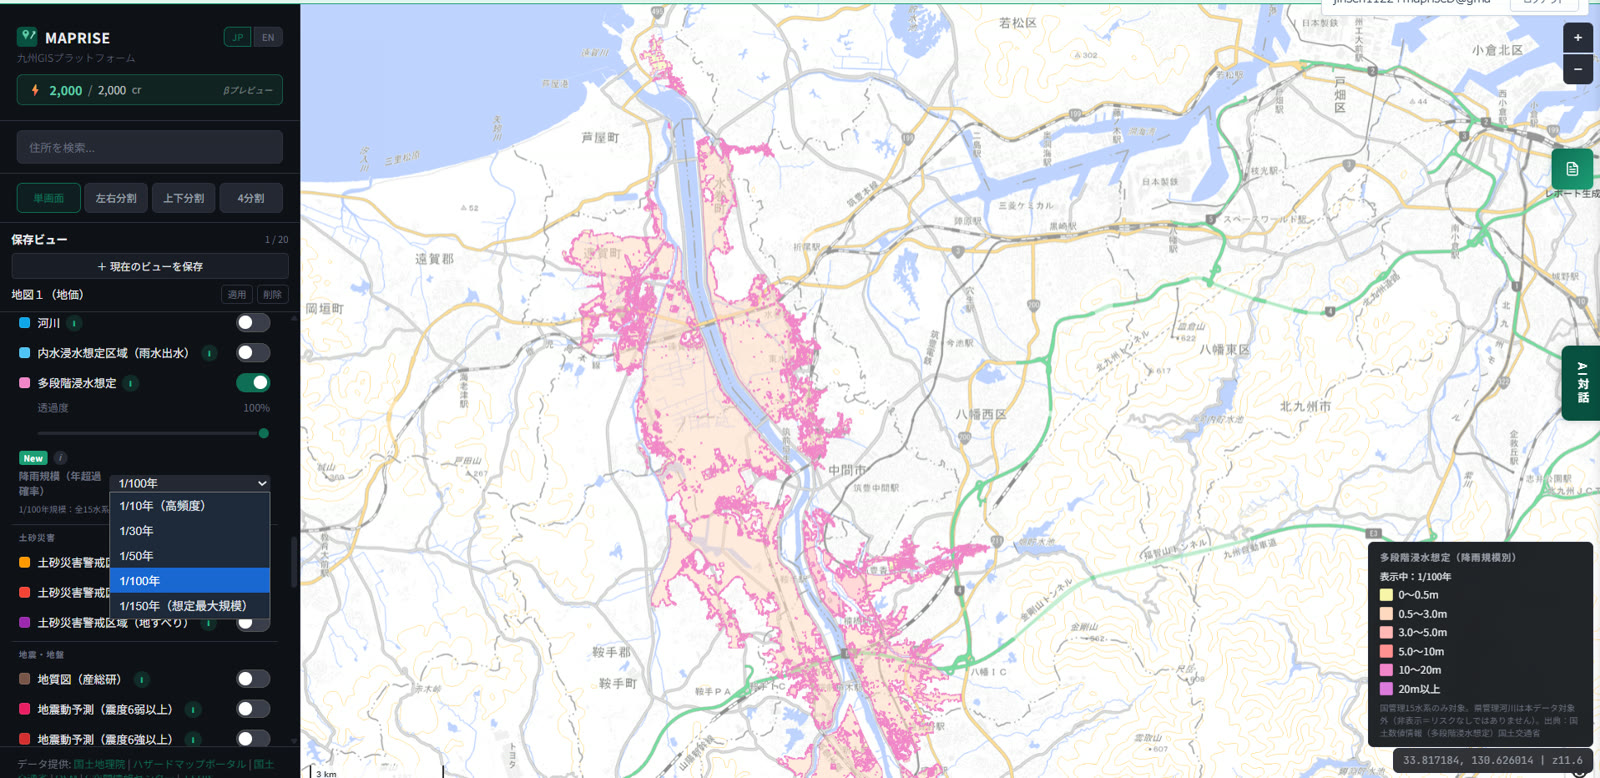
You can see a band of flood-extent area, mostly light orange (0.5–3.0m), spreading along the river channel. The legend uses six depth tiers — 0–0.5m, 0.5–3.0m, 3.0–5.0m, 5.0–10m, 10–20m, and 20m or more (Kyushu has no areas in the deepest tier) — so at a glance you can tell that not all "flooded area" carries the same kind of risk. Move the rainfall-scale dropdown from 1-in-10 years up toward 1-in-150 years, and you can watch the extent gradually widen within the same basin.
Coverage varies by river system across Kyushu
Zooming out to all of Kyushu, you can see pink flood-extent areas scattered around places like the Saga Plain and the Chikushi Plain.
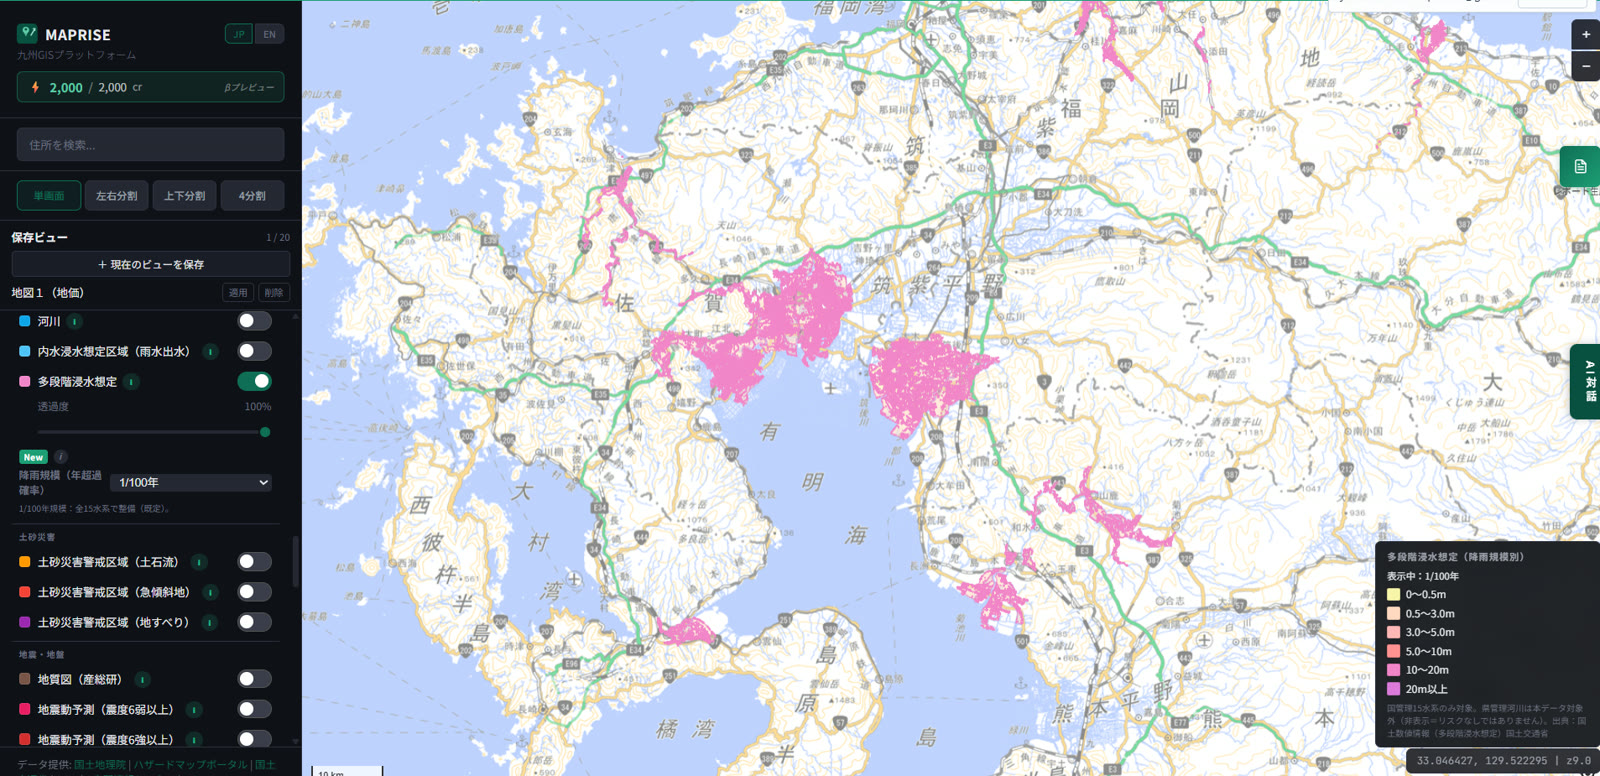
One thing we want to be upfront about with this layer: it covers only the 15 major nationally-managed river systems (Onga, Yamakuni, Matsuura, Kase, Rokkaku, Honmyo, Kikuchi, Yabe, Omaru, Kuma, Oita, Ono, Gokase, Oyodo, and Kimotsuki rivers). Prefecturally-managed rivers, such as the Naka and Mikasa rivers running through Fukuoka City, are outside its scope. The number of river systems covered also differs by rainfall scale — the 1-in-150-year (assumed maximum) scale is only available for the Oyodo and Onga rivers. Nothing shown on the map does not mean no risk. For prefecturally-managed rivers, please also check the "Rivers" layer and your municipality's own hazard map.
A tool for thinking through what to accept, and what to prepare for
We don't think the value of this layer is limited to simply "marking dangerous places." Showing flood extent in stages by rainfall scale also means you can separate "flooding that could plausibly happen often (1-in-10 to 1-in-30 years)" from "flooding that's rare, but severe when it happens (1-in-150 years)."
When evaluating a site or thinking through building use, drawing the line — "up to what scale of flooding do we accept, and where does it require countermeasures or preparation?" — can be one input into figuring out the best use of a particular piece of land. If a site falls within the flood extent even under a frequent scenario, that might call for raised ground level or a rethink of how the ground floor is used. If a site is only affected under the assumed-maximum scenario, "soft" measures like stockpiling supplies and evacuation planning might be the priority. Being able to set priorities according to the shading of risk is, we think, exactly what staged data makes possible.
This bears repeating, because it matters: this data is never meant to stoke anxiety. We offer it as one piece of material for knowing correctly, understanding, preparing, and thinking things through.
Combine it with other hazard layers and the AI chat
Multi-stage flood simulation becomes more useful layered against other hazard information than viewed alone. MAPRISE offers many other layers — landslide/steep-slope/debris-flow warning zones, inland (pluvial) flood extent, seismic shaking forecasts, geological maps, and more — that you can overlay and adjust for opacity. That's how you catch things a single hazard alone won't show you: "river flooding doesn't reach here, but it's inside a landslide warning zone," or "this area overlaps both inland flooding and river flooding."
You can also ask the AI chat on the right side of the screen to work through this kind of compound risk assessment directly, rather than reading the map by eye alone. Ask something like "what's the flood risk and landslide risk at this point?" and the AI will support your answer with the underlying visual and quantitative data. MAPRISE aims to support the full chain — from visual information on the map, to quantitative figures, to the qualitative reasoning and analysis built on top of them.
We'll keep adding material that helps you know, and think, correctly. If you want to know the risk of the ground itself, see embankment regulation zones and large-scale fill land.
This data is for reference. For actual disaster-preparedness planning or land-use decisions, please also check the flood extent maps and hazard maps published by your municipality, along with expert advice.
Source: National Land Numerical Information (Multi-stage Flood Simulation), FY2025 edition, MLIT (CC BY 4.0)
Tags: #Multi-stage flood simulation #Disaster prevention #Hazard #National Land Numerical Information #Data update
Other-language share text (exception cases)
Quick share above follows our platform-locked language policy (X-family in Japanese, LinkedIn in English). The four panes below let you grab the opposite-language body when needed — e.g. introducing an English post to a Japanese audience on X, or posting a Japanese article to LinkedIn in Japanese. Each pane offers both a copy button and a direct intent link.
📝 「もしもっと雨が降ったら」を、段階的に見る ― 多段階浸水想定レイヤーのご紹介
令和7年度に国土数値情報として新規整備された「多段階浸水想定」データをMAPRISEに追加しました。1/10年の高頻度豪雨から1/150年の想定最大規模まで、降雨規模ごとに浸水範囲・浸水深がどう広がるかを地図上で切り替えて確認できます。遠賀川流域の例を見ながら、レイヤーの使い方と向き合い方をご紹介します。
https://maprise.jp/ja/blog/multistage-flood-simulation/ #多段階浸水想定 #防災
🆕 新しいブログ記事を公開しました。

《「もしもっと雨が降ったら」を、段階的に見る ― 多段階浸水想定レイヤーのご紹介》

令和7年度に国土数値情報として新規整備された「多段階浸水想定」データをMAPRISEに追加しました。1/10年の高頻度豪雨から1/150年の想定最大規模まで、降雨規模ごとに浸水範囲・浸水深がどう広がるかを地図上で切り替えて確認できます。遠賀川流域の例を見ながら、レイヤーの使い方と向き合い方をご紹介します。

👉 詳しくはこちら: https://maprise.jp/ja/blog/multistage-flood-simulation/
📝 "What if it rained even harder?" — seeing flood risk in stages, with the Multi-stage Flood Simulation layer
We've added "Multi-stage Flood Simulation" data — newly compiled as National Land Numerical I…
https://maprise.jp/en/blog/multistage-flood-simulation/ #Multi-stagefloodsimulation #Disasterprevention
🆕 New on the MAPRISE blog.

《"What if it rained even harder?" — seeing flood risk in stages, with the Multi-stage Flood Simulation layer》

We've added "Multi-stage Flood Simulation" data — newly compiled as National Land Numerical Information in fiscal 2025 — to MAPRISE. Switch between rainfall scales, from a frequent 1-in-10-year storm to the theoretical maximum 1-in-150-year event, and watch how flood extent and depth change on the map. We walk through it using the Onga River basin as an example.

👉 Read the full post: https://maprise.jp/en/blog/multistage-flood-simulation/

#Multi-stagefloodsimulation #Disasterprevention #Hazard #NationalLandNumericalInformation #Dataupdate