Adding contract-price data to MAPRISE gave us a reason to unpack the difference between "transaction price" and "contract price" in Japanese real estate. On the map, ring-shaped icons and filled-dot icons now tell the two apart at a glance — alongside fine-grained filters for year, price band, and property type.
Hello from the MAPRISE development team. This time, let's take a slight detour and talk about something that surprises a lot of people: real-estate price information in Japan isn't just one thing. The trigger for this post was adding contract-price data to MAPRISE. Now both "transaction price" and "contract price" appear side by side on the map — but do you know what actually separates the two?
"Transaction price" and "contract price" are different datasets
Both describe "how much this property sold or leased for," but they come from different sources.
Transaction price information is published by Japan's Ministry of Land, Infrastructure, Transport and Tourism (MLIT), based on surveys sent directly to people who completed a real-estate transaction. It covers a broad range of sales and leases, and comes bundled with property attributes like floor area, layout, year built, structure, and zoning. Because it's survey-based, however, a respondent's memory or interpretation can introduce some noise.
Contract price information comes from REINS (the Real Estate Information Network System), the designated distribution organization where licensed agents register deals brokered through them. Since it reflects the moment a brokerage contract was actually concluded, it tends to be more precise — "this is genuinely the price it closed at." The tradeoff is coverage: private sales made without an agent aren't captured.
In short, transaction-price data is "broad but a little noisy," while contract-price data is "narrower but highly reliable." Relying on just one can give you a skewed read on the market. That's exactly why we now plot both on the same map in MAPRISE.
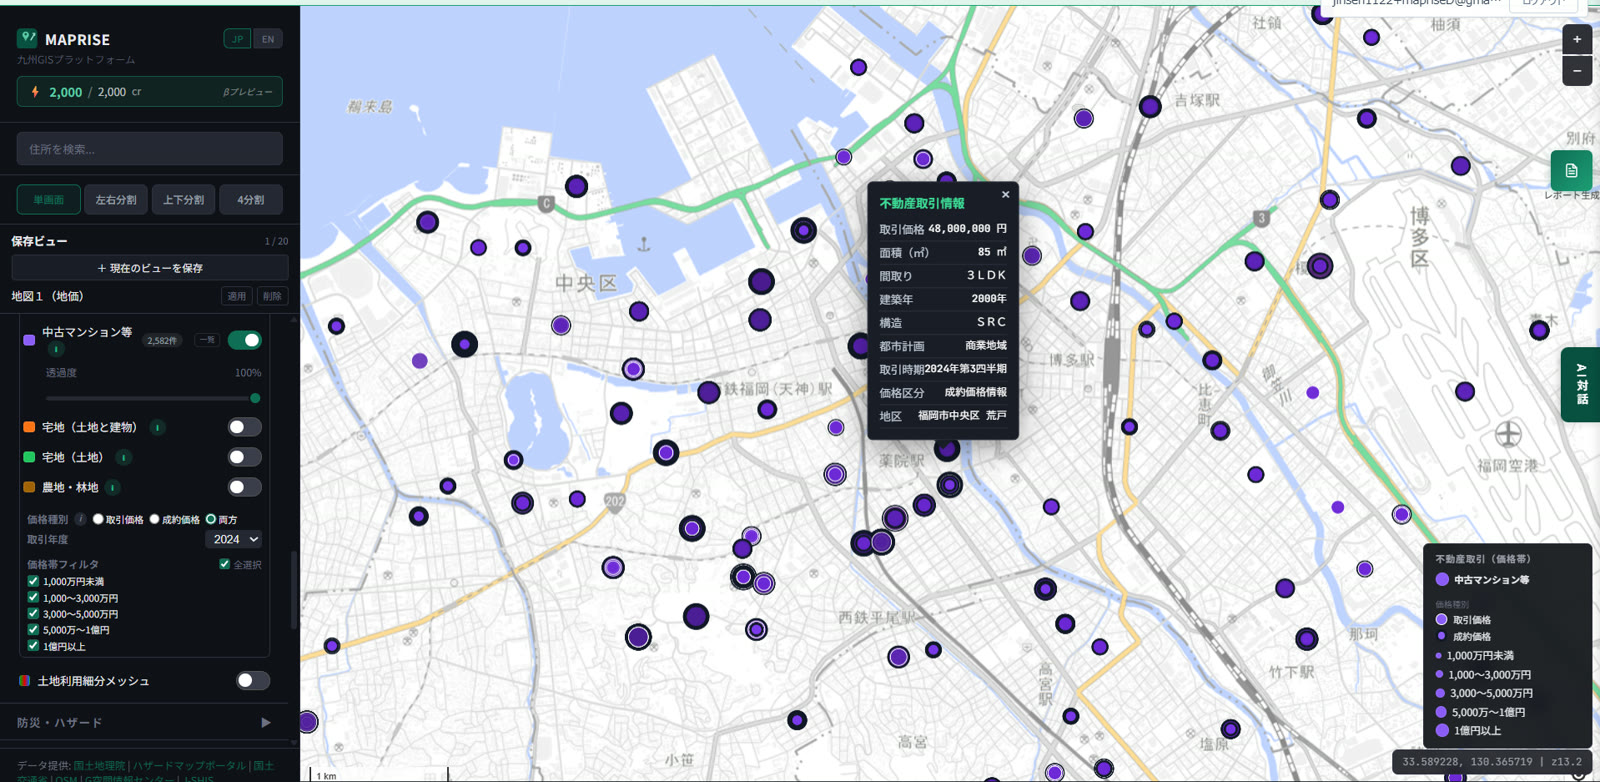
Told apart by icon shape
Simply layering two datasets onto one map isn't enough on its own — at a glance you still can't tell which is which, and that just creates confusion. So in MAPRISE, we distinguish the two by icon shape.
Look at the screenshot above and you'll notice a mix of ring-shaped icons and solid, filled-in dot icons. Rings represent transaction-price information; filled dots represent contract-price information. Color is still used consistently for price band (from under ¥10M to over ¥100M), so you can read "color for price band, shape for data type" intuitively. Click a point and the "Price category" field in the popup confirms exactly which type it is.
The "Price type" control in the left panel also lets you switch between three display modes: transaction price only, contract price only, or both. That means you can look at the wider transaction-price picture first, then narrow down to the higher-confidence contract-price data when you need it.
Fine-grained filters: year, price band, property type
MAPRISE's real-estate price map isn't just about telling the two apart — it's also built for precise filtering.
- Transaction year: pick a specific year from a dropdown (e.g., 2024) to track how prices have moved year over year.
- Price band filter: five bands — under ¥10M, ¥10–30M, ¥30–50M, ¥50M–¥100M, and over ¥100M — each toggled independently via checkboxes, so you can keep only the price range you're targeting on the map.
- Property-type layers: used condominiums, residential land with buildings, residential land only, and farmland/forest land are each an independent layer you can switch on or off — perfect for comparing just condo sales, or just land transactions.
- Every layer also has its own opacity slider, so you can stack it against other layers (land price, hazards, zoning, and more) while keeping everything legible.
Being able to combine all of these fine filters on a single map is, we think, what makes MAPRISE what it is. A view like "2024, ¥30–50M band, used condominiums only, contract-price basis" surfaces a sense of market pricing you simply can't get otherwise. Transaction-price data, with its large sample size, gives you the overall feel of the market; contract-price data backs that up with pinpoint, real-world accuracy. It's only when both work together that price information becomes genuinely usable.
We'll keep polishing both the accuracy and the readability of this data. To see how these figures relate to official appraisals, see the two-appraiser land appraisal layer.
This data is provided for reference, based on MLIT's "Real Estate Transaction Price Information" and REINS's "Contract Price Information." For actual transactions, please confirm details separately with a licensed professional or real-estate agent.
Source: MLIT Real Estate Transaction Price Information System / REINS Contract Price Information
Tags: #Transaction price #Contract price #Data update #UI/UX
Other-language share text (exception cases)
Quick share above follows our platform-locked language policy (X-family in Japanese, LinkedIn in English). The four panes below let you grab the opposite-language body when needed — e.g. introducing an English post to a Japanese audience on X, or posting a Japanese article to LinkedIn in Japanese. Each pane offers both a copy button and a direct intent link.
📝 「取引価格」と「成約価格」、その違いわかりますか? ― MAPRISEの不動産価格マップ、アイコンで見分けられるようにしました
MAPRISEに成約価格データを追加したのをきっかけに、不動産の「取引価格」と「成約価格」の違いを整理してみました。地図上ではリング状のアイコンとドット状のアイコンで両者を見分けられます。年度・価格帯・物件種別まで細かく絞り込める表示の工夫もあわせてご紹介します。
https://maprise.jp/ja/blog/transaction-vs-contract-price/ #不動産取引価格 #成約価格
🆕 新しいブログ記事を公開しました。

《「取引価格」と「成約価格」、その違いわかりますか? ― MAPRISEの不動産価格マップ、アイコンで見分けられるようにしました》

MAPRISEに成約価格データを追加したのをきっかけに、不動産の「取引価格」と「成約価格」の違いを整理してみました。地図上ではリング状のアイコンとドット状のアイコンで両者を見分けられます。年度・価格帯・物件種別まで細かく絞り込める表示の工夫もあわせてご紹介します。

👉 詳しくはこちら: https://maprise.jp/ja/blog/transaction-vs-contract-price/

#UI/UX
📝 "Transaction price" vs. "contract price" — do you know the difference? MAPRISE's real-estate price map now tells them apart by icon shape
Adding contract-price data to MAPRISE gave us a reason to unpack the differenc…
https://maprise.jp/en/blog/transaction-vs-contract-price/ #Transactionprice #Contractprice
🆕 New on the MAPRISE blog.

《"Transaction price" vs. "contract price" — do you know the difference? MAPRISE's real-estate price map now tells them apart by icon shape》

Adding contract-price data to MAPRISE gave us a reason to unpack the difference between "transaction price" and "contract price" in Japanese real estate. On the map, ring-shaped icons and filled-dot icons now tell the two apart at a glance — alongside fine-grained filters for year, price band, and property type.

👉 Read the full post: https://maprise.jp/en/blog/transaction-vs-contract-price/

#Transactionprice #Contractprice #Dataupdate #UI/UX
Related posts
- You don't need to memorize 50+ layers — one-click Purpose Presets turn on exactly what you need2026-07-26
- Reading 1.55 million Kyushu buildings through three lenses — how to use the PLATEAU Buildings layer2026-07-11
- Why every official land appraisal has two appraisers — looking behind Japan's Land Price Publication with MAPRISE2026-07-04