We used MAPRISE's earthquake layer (JMA data) to look at the strong earthquake that hit Aichi Prefecture in the early hours of 8 November 2026. We checked whether small earthquakes had been increasing in the 30 days before it, how many aftershocks followed, and how that compares with 26 years of records. We also introduce our research on earthquake simulation that combines ground conditions, construction year, seismic code and structure.
Hello, this is the MAPRISE development team.
At around 1:04 a.m. on 8 November 2026, an earthquake with a maximum seismic intensity of 5 upper (on the JMA scale) struck Aichi Prefecture. Our thoughts are with everyone affected by the earthquake, and we extend our sincere sympathies.
It was reported to be the first time since 16 March 1997 that intensity 5 upper or greater had been observed in Aichi, about 30 years ago. Because it happened in the middle of the night, many people may be wondering: "Were there small earthquakes beforehand?" and "Are aftershocks continuing?"
In this article we put the earthquake on the map with MAPRISE's earthquake layer (JMA epicentres and intensity), and check with data whether small earthquakes had increased in the 30 days before it and how the aftershocks have behaved since. Please note that predicting when an earthquake will occur is not an established capability of current science. This article is not a prediction; it is a look at how past records appear on a map.
Key points
- The epicentre was in western Shizuoka (near the border with Aichi), at a depth of about 40 km, magnitude (M) 5.7 (JMA preliminary values). Intensity 5 upper was observed in Chita City, Aichi.
- In the 30 days before the mainshock, there was one M3+ earthquake within 50 km of the epicentre (1 November, western Aichi, M3.6, intensity 2). Compared with the distribution of 30-day periods over the past 26 years, that is an ordinary level.
- One aftershock of intensity 1 or greater had been announced by the evening of 10 November (M3.3, intensity 2).
- Earthquakes below intensity 1 do not show up with this method. This is not a claim that "there were no warning signs".
1. Overview of the earthquake
| Item | Details |
|---|---|
| Date and time | About 1:04 a.m., 8 November 2026 |
| Epicentre | Western Shizuoka Prefecture (around 34.9°N, 137.7°E) |
| Depth and magnitude | About 40 km, M5.7 (JMA preliminary values) |
| Maximum intensity | 5 upper (Chita City, Aichi) |
| Intensity 5 lower | Seto, Handa, Kariya, Toyota, Tokai, Miyoshi, Togo and Shinshiro in Aichi; Ena in Gifu; Hamana Ward, Hamamatsu in Shizuoka; Urugi Village in Nagano |
| Damage | Around 20 injuries in Aichi (figures vary by report). No tsunami threat |
| JMA advisory | Stay alert for about a week for earthquakes up to intensity 5 upper in the areas that shook strongly |
JMA noted that the earthquake occurred within the assumed source area of the Nankai Trough earthquake, but considers that, given its magnitude, it does not indicate any particular change in the locking state of the plate boundary along the Nankai Trough.
The straight-line distance from the epicentre (around 34.9°N, 137.7°E) to Chita City, where the maximum intensity was observed, is roughly 75–80 km. We cannot say here why the strongest shaking was recorded away from the epicentre, but amplification by the ground may be one factor (see Section 7).
2. Looking at the earthquake in MAPRISE's earthquake layer
MAPRISE's "Earthquake epicentres and intensity (JMA, 1919–)" layer overlays JMA earthquake information on the map. Circle size shows magnitude and colour shows the maximum seismic intensity (JMA's standard colours). The last ~30 days are loaded from JMA's servers, and with the slider in the panel at the top of the map you can go back in time or play the earthquakes back in order of occurrence.
This "last 30 days" view is connected to JMA's earthquake information through an API and refreshes about every minute (JMA's feed itself updates in roughly 60-second steps; when you move the map, MAPRISE fetches again if about a minute or more has passed since the last fetch). A new earthquake therefore appears on the map within a few minutes. Note that JMA's preliminary values may be revised later.
The next screenshot shows the slider set to just before the mainshock (00:42 on 8 November), with 30 days of earthquakes of intensity 1 or greater across Japan.
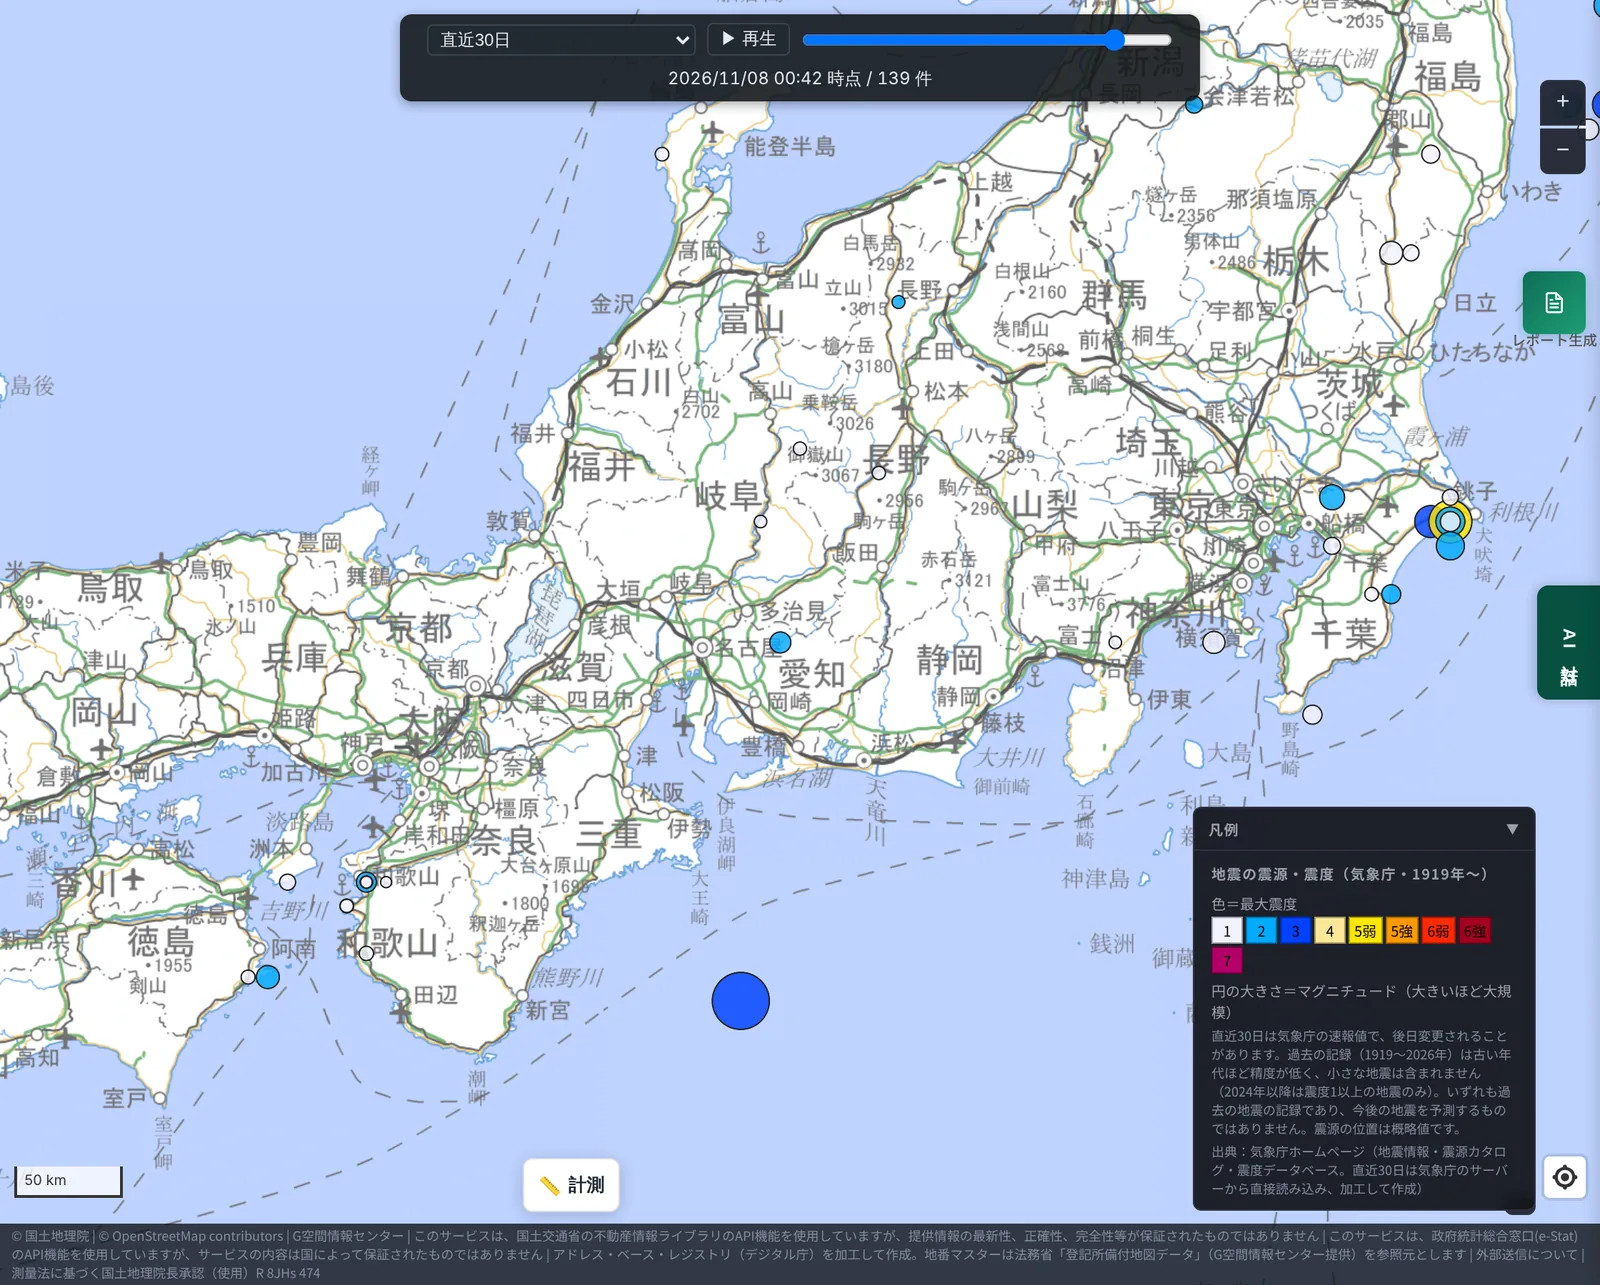
At this point there are no circles in eastern Aichi or western Shizuoka, where the epicentre was; only one small blue circle in north-western Aichi (the 1 November earthquake, discussed below). The large blue circle south of the Kii Peninsula is the M6.1 earthquake of 1 November off south-east Mie at a depth of about 350 km (maximum intensity 3). Because it occurred at such great depth, it is thought to be separate from the seismic activity around this epicentre.
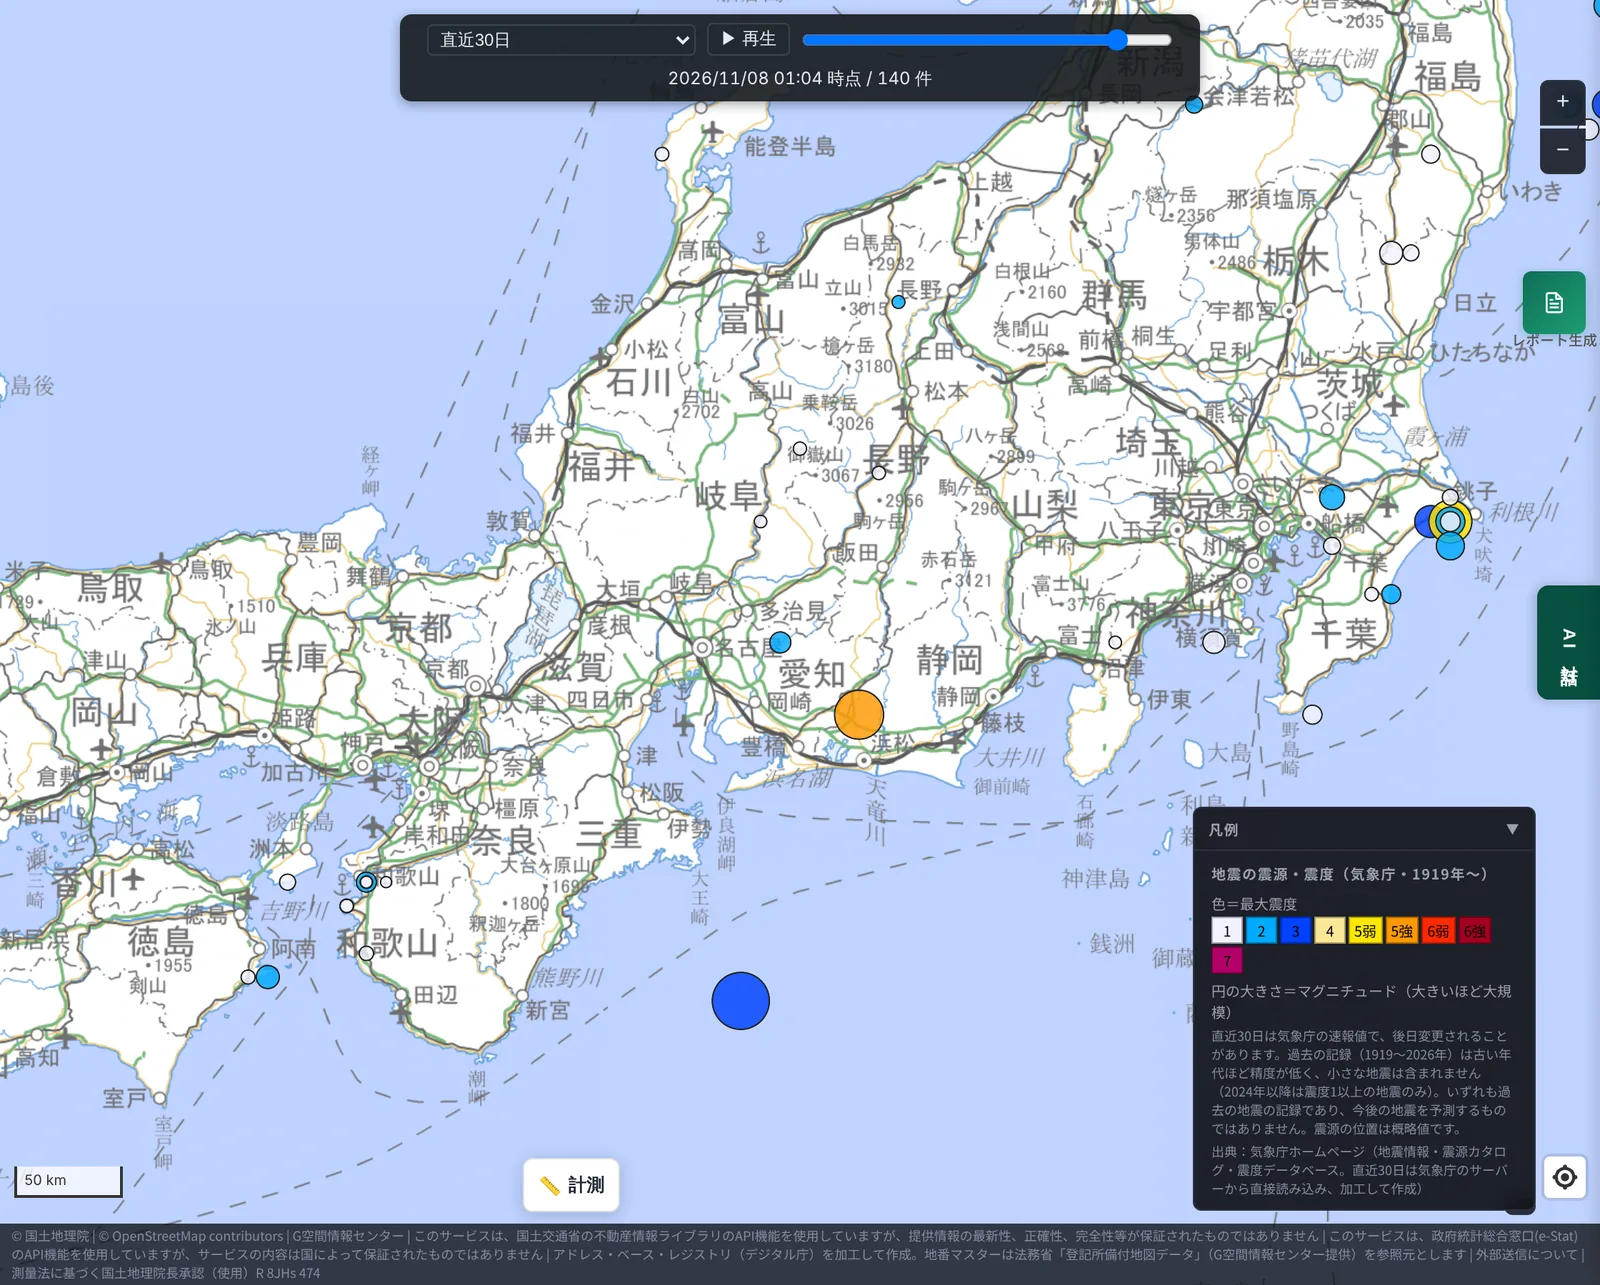
Moving the slider on to the time of the mainshock, a large orange circle (intensity 5 upper) appears.
3. The 30-day timeline
The 30 days before the mainshock (01:04 on 8 November) start around 01:04 on 9 October. We compiled the earthquakes of intensity 1 or greater around the epicentre in that period from JMA's published data. (The layer's "last 30 days" view starts on 12 October, so for 9–11 October we used P2P Quake, which relays earthquake information issued by JMA.)
| Date and time | Epicentre region | M | Depth | Max. intensity | Distance from the mainshock epicentre |
|---|---|---|---|---|---|
| 30 Oct, 1:06 | Hida region, Gifu | 2.3 | ~10 km | 1 | ~100 km |
| 1 Nov, 13:39 | Western Aichi | 3.6 | ~40 km | 2 | ~49 km |
| (Reference) 1 Nov, 7:15 | Off south-east Mie | 6.1 | ~350 km | 3 | ~144 km |
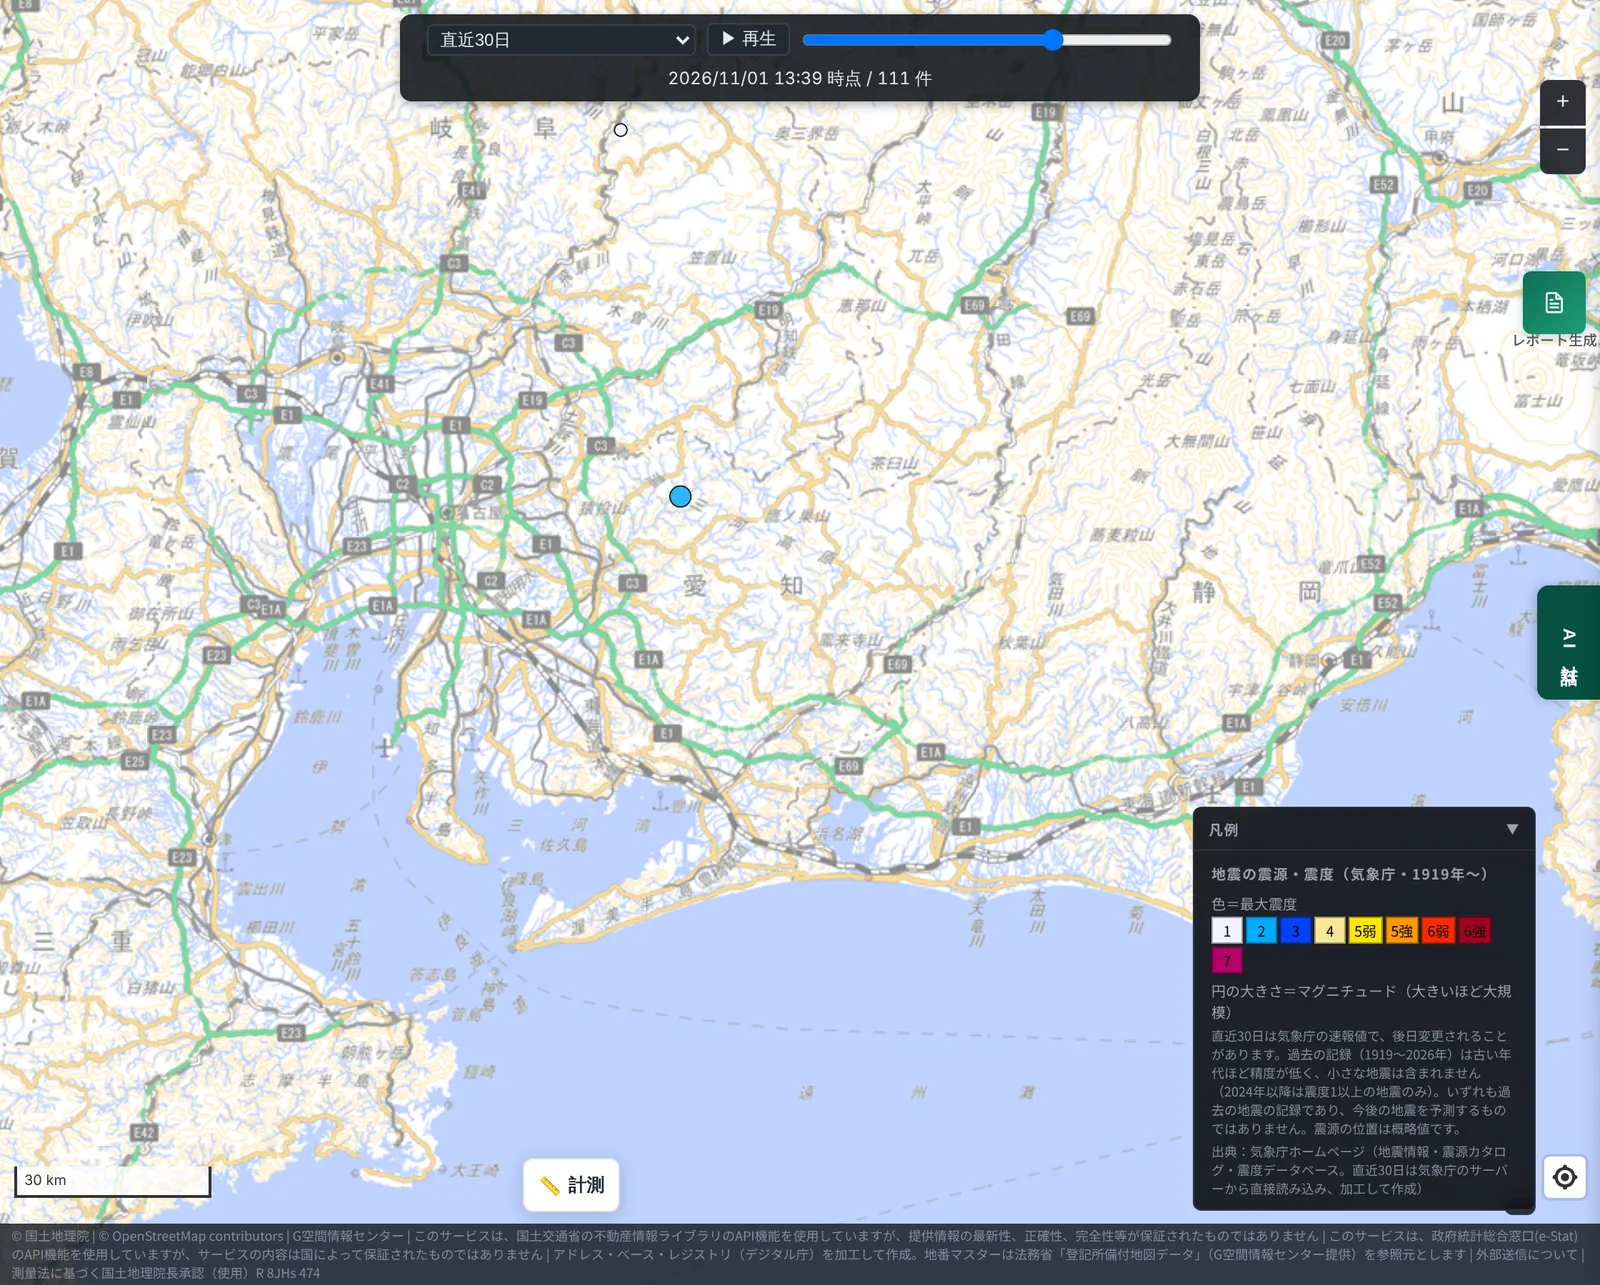
Within 50 km of the epicentre, the only M3+ earthquake was the 1 November earthquake in western Aichi (M3.6, intensity 2), about six and a half days before the mainshock. The next screenshot shows the slider at 13:39 on 1 November, with a single small blue circle to the north-west.
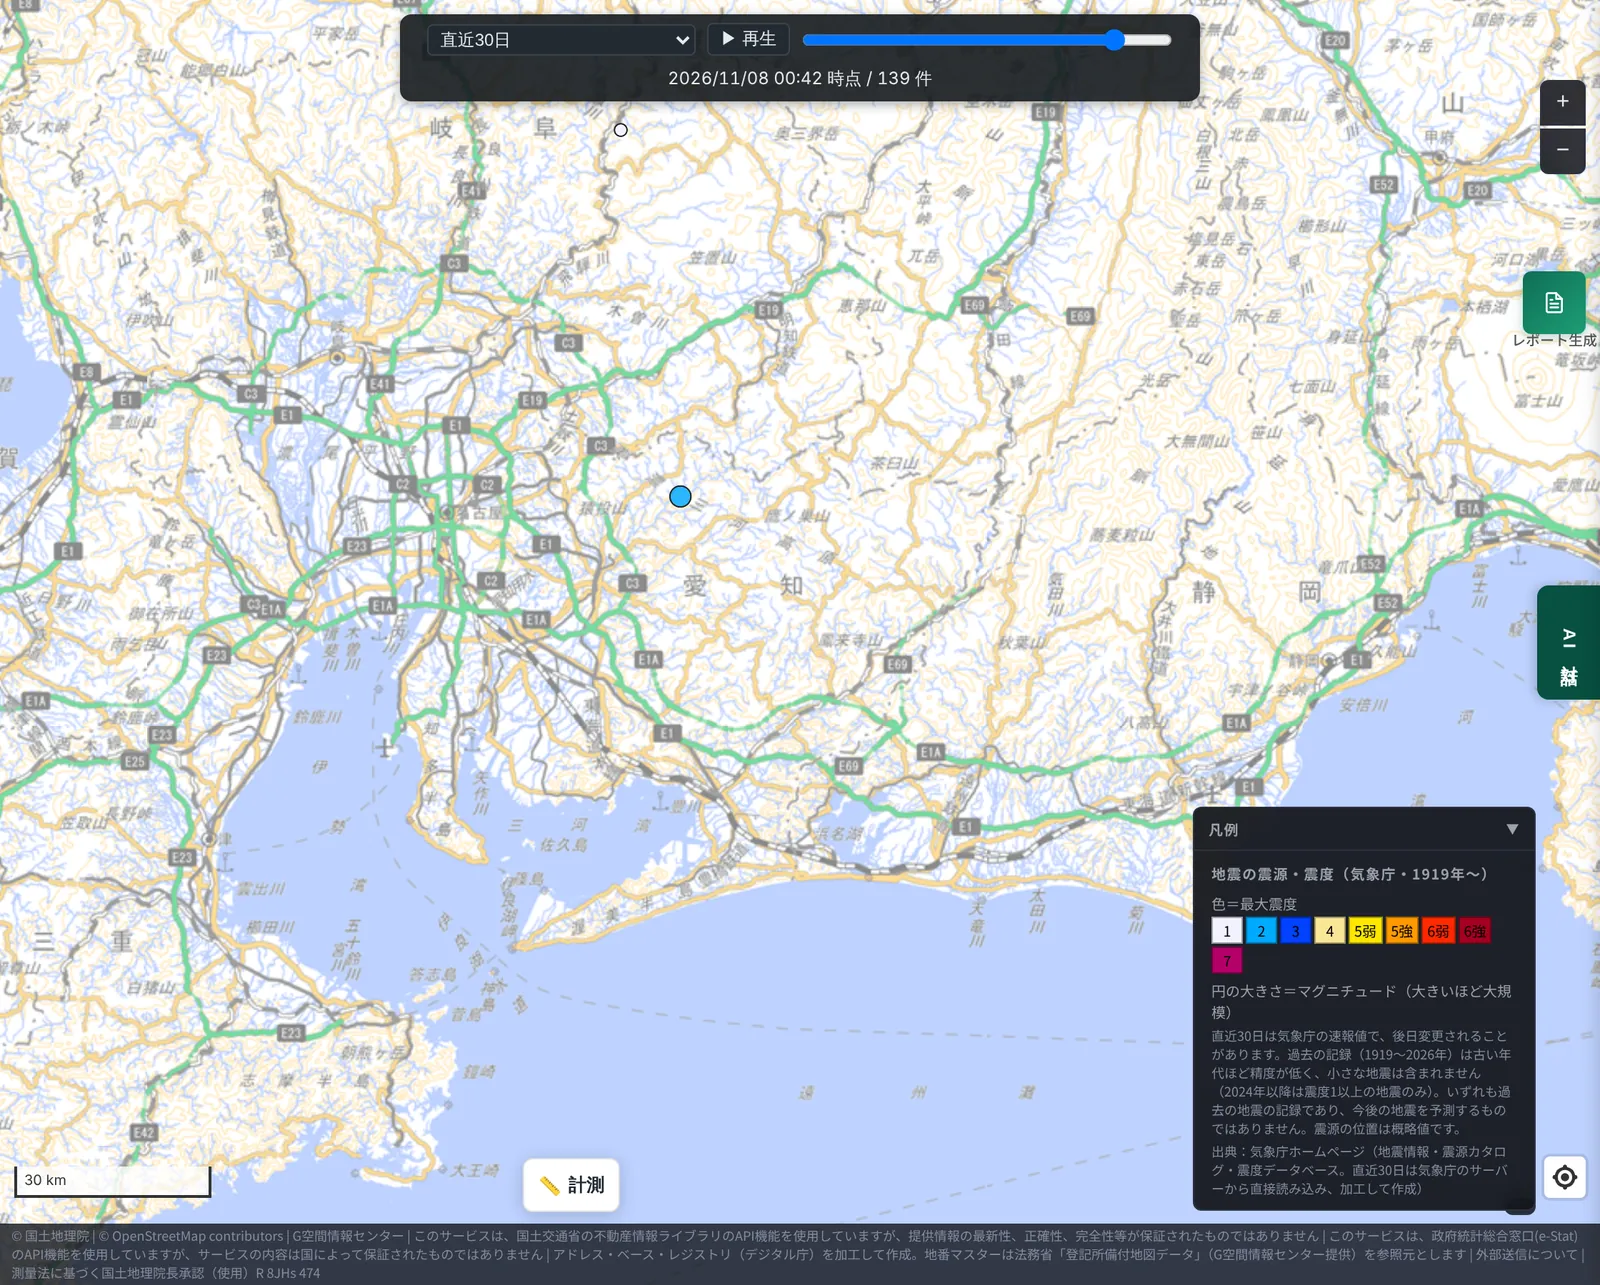
After that, no new circles appeared in this area until just before the mainshock (00:42 on 8 November).
Across the five central prefectures (Aichi, Shizuoka, Gifu, Mie and Nagano), seven earthquakes of intensity 1 or greater occurred in those 30 days, including the deep one. Most were M2-class events in the mountains of southern Nagano and the Hida region of Gifu; apart from the western Aichi event in the table above, the other six were about 100 km or more from the mainshock epicentre.
4. The mainshock and its aftershocks
The next screenshot shows about an hour after the mainshock (02:03 on 8 November). The large orange circle is the mainshock (intensity 5 upper), and one small blue circle has appeared right next to it.
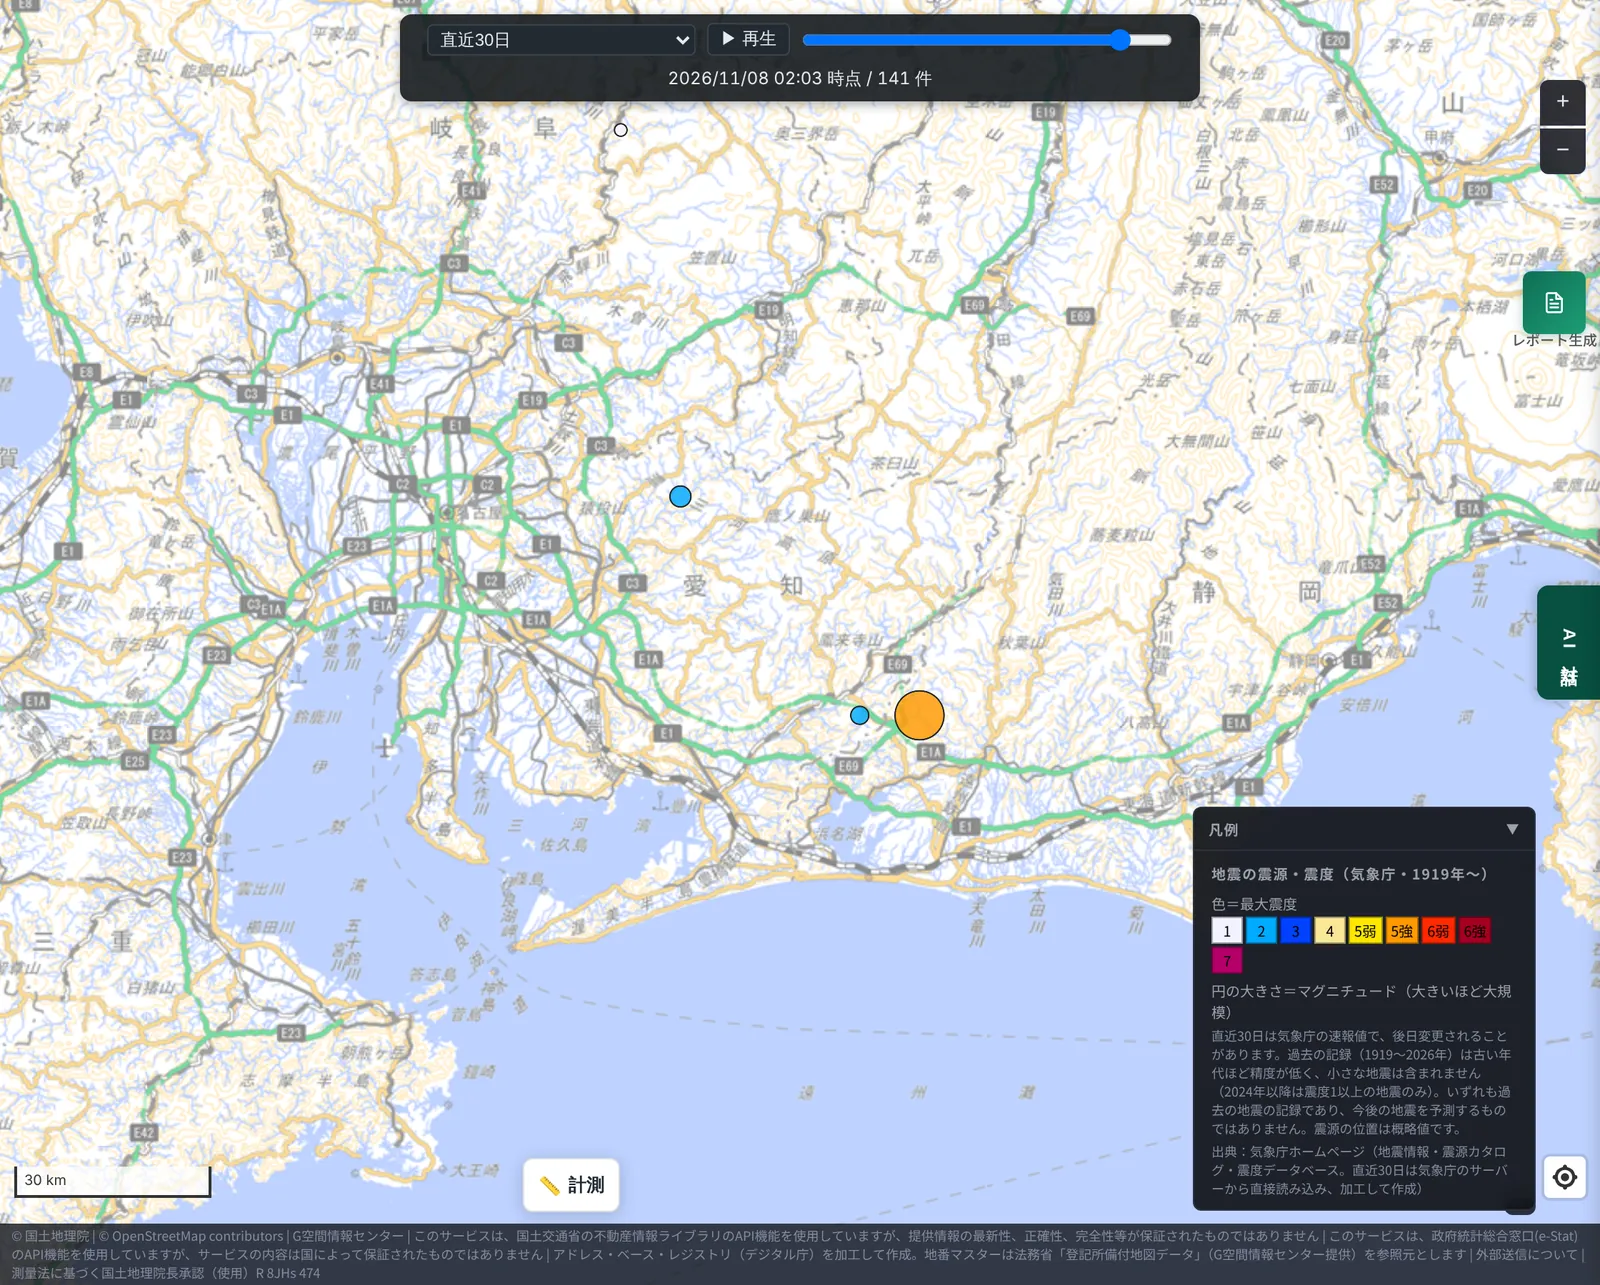
That blue circle is the M3.3 (intensity 2) earthquake in eastern Aichi at 02:03 on 8 November, about 9 km from the mainshock epicentre. Up to 16:53 on 10 November, no further earthquake of intensity 1 or greater had been announced in this area.
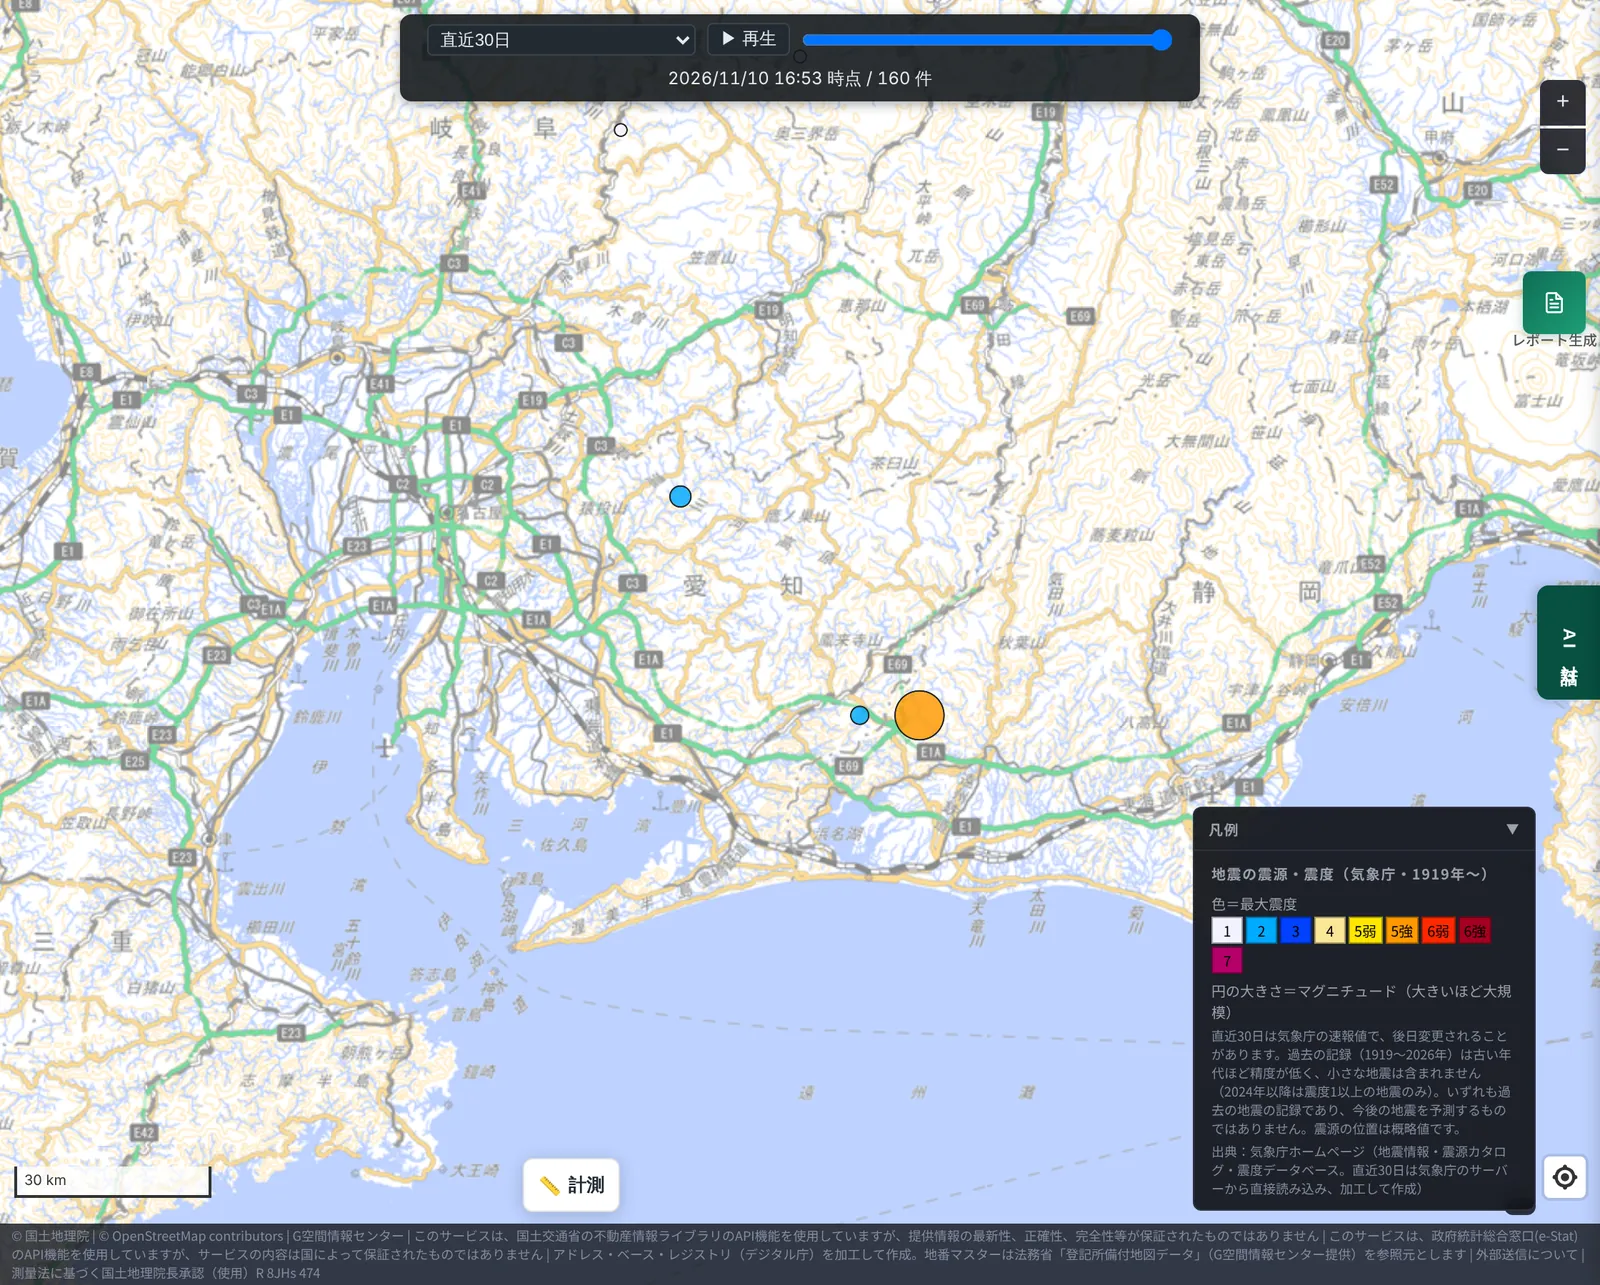
Based on past cases, JMA says that after a large earthquake another of similar size occurred in roughly 10–20% of cases, and that large earthquakes tend to occur especially within the first two to three days. As of writing (the evening of 10 November) that period is passing, but JMA still advises staying alert for about a week.
5. How does it compare with "normal"?
Whether "one in the previous 30 days" is many or few can only be judged against the usual level. So, using the JMA hypocentre catalogue held by MAPRISE (1998–2023), we counted how many M3.0+ earthquakes occurred within 50 km of the epicentre in each 30-day period, across 26 years (316 periods).
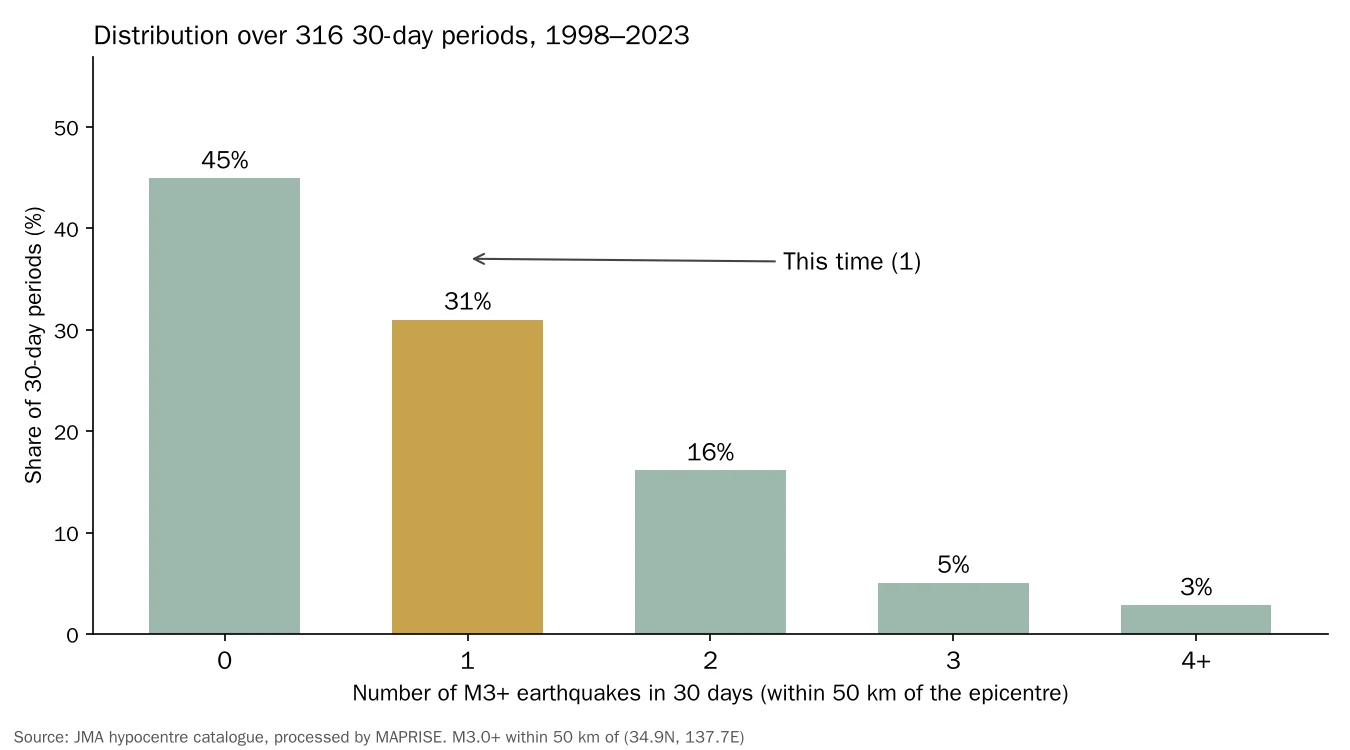
- About 45% of 30-day periods had none, and about 31% had one: more than three quarters had one or none.
- The average is about 0.95 per 30 days; the median is one.
- This time's single event is within the usual range of the past 26 years.
- Narrowing to 30 km from the epicentre, there were none in the preceding 30 days (the average over the same 26 years is about 0.45 per 30 days).
In other words, in the range captured at intensity 1 or greater, we could not find a sign that "earthquakes were noticeably increasing in the 30 days before".
6. What we can and cannot say
What we found
- Within 50 km of the epicentre, there was one M3+ earthquake in the preceding 30 days, an average level compared with 26 years of records.
- Only one aftershock of intensity 1 or greater (M3.3) had been announced by the evening of 10 November.
- The maximum intensity was observed in Chita City, about 75–80 km from the epicentre.
What we cannot say, and cautions
- Earthquakes below intensity 1 are not visible with this method. JMA's quick reports (intensity 1 and above) contain almost no M2-or-smaller microearthquakes. Examining microseismicity would need the finalised hypocentre catalogue, which takes time to be published.
- The values for the mainshock and aftershocks are JMA preliminary values and may be revised later.
- The past records used for comparison (1998–2023) include periods with many aftershocks of other large earthquakes, so the "average" may be pulled upward.
- This is the result for one earthquake. It does not generalise to "whether foreshocks exist".
- We did not verify why the strongest intensity occurred in Chita. The depth of the source, how the waves travelled and amplification by the surface ground may all be involved.
7. Research on shaking that includes ground, construction year, seismic code and structure
The damage from an earthquake depends not only on its size but also on the ground at each site and on the age and structure of buildings. As in this case, strong shaking can be observed away from the epicentre.
Beyond the earthquake layer, which shows records of actual earthquakes, MAPRISE is researching earthquake intensity and collapse simulation that combines ground properties, building construction year, seismic-code generation and structure (timber or non-timber, etc.).
- Ground properties: how readily the surface ground amplifies shaking (indicators based on landform and surface geology)
- Construction year and seismic code: generations based on the year of construction, such as pre-June 1981 (old code), post-1981 (new code) and post-2000 standards
- Building structure: timber, steel, reinforced concrete and so on
- Height and number of floors: obtained from the building data of MLIT's PLATEAU (3D city models)
By combining these, we offer, as a beta feature in some areas, an estimate of the collapse probability of each building for an assumed earthquake. See the earthquake simulation page and the article on validating its accuracy (Challenging earthquake collapse scoring with MAPRISE). The method of colouring buildings by seismic-code generation from their construction year is introduced in our article overlaying pre-1981 buildings with land history.
Please note that the simulation is reference information based on assumed scenarios and does not reproduce or predict the damage of an actual earthquake such as this one. We plan to widen the covered areas step by step; please check the feature page for the current coverage.
8. Layer used
The following layer can be viewed by anyone in the MAPRISE map app.
- "Earthquake epicentres and intensity (JMA, 1919–)": switch between playback of the last 30 days and the historical record (by year, from 1919).
All screenshots in this article show the layer above as of the evening of 10 November 2026.
Sources and references
- Weekly earthquake counts; intensity 5 upper in Aichi in the early hours of the 8th (Japan Weather Association, tenki.jp): https://tenki.jp/forecaster/deskpart/2026/11/08/41244.html
- Aichi maximum intensity 5 upper; JMA: stay alert for about a week (NHK): https://news.web.nhk/newsweb/na/nd-20261108de72348
- Intensity 5 upper in Aichi, 22 injured: damage by area (NHK): https://news.web.nhk/newsweb/na/nd-20261108de72310
- M5.7 earthquake in western Shizuoka; intensity 5 upper in Chita, Aichi (Weathernews): https://weathernews.jp/news/202611/080104quake/
- JMA earthquake information: https://www.jma.go.jp/bosai/quake/
- JMA press release (commentary on the 8 November 2026 earthquake): https://www.jma.go.jp/jma/press/2611/08a/kaisetsu202611080305.pdf
- P2P Quake (relay of earthquake information issued by JMA): https://www.p2pquake.net/
- JMA hypocentre catalogue, processed by MAPRISE (1998–2023)
Tags: #Earthquake #Aichi #Intensity 5+ #Foreshocks #Aftershocks #Earthquake layer #JMA #Seismic code #Ground #Earthquake simulation
Other-language share text (exception cases)
Quick share above follows our platform-locked language policy (X-family in Japanese, LinkedIn in English). The four panes below let you grab the opposite-language body when needed — e.g. introducing an English post to a Japanese audience on X, or posting a Japanese article to LinkedIn in Japanese. Each pane offers both a copy button and a direct intent link.
📝 愛知県の震度5強(11月8日)に前兆はあったのか ― 過去30日の地震活動を、MAPRISEの地震レイヤで確かめました
2026年11月8日未明に愛知県で観測された震度5強の地震について、MAPRISEの地震レイヤ(気象庁)で当時の震度分布を確認し、直前の30日間に小さな地震が増えていなかったか、その後の余震はどうだったかを、過去26年の記録と比べて調べました。あわせて、地盤・建築年・耐震基準・構造を組み合わせた地震シミュレーションの研究についても紹介します。
https://maprise.jp/ja/blog/aichi-m57-foreshock-check/ #地震 #愛知県
🆕 新しいブログ記事を公開しました。

《愛知県の震度5強(11月8日)に前兆はあったのか ― 過去30日の地震活動を、MAPRISEの地震レイヤで確かめました》

2026年11月8日未明に愛知県で観測された震度5強の地震について、MAPRISEの地震レイヤ(気象庁)で当時の震度分布を確認し、直前の30日間に小さな地震が増えていなかったか、その後の余震はどうだったかを、過去26年の記録と比べて調べました。あわせて、地盤・建築年・耐震基準・構造を組み合わせた地震シミュレーションの研究についても紹介します。

👉 詳しくはこちら: https://maprise.jp/ja/blog/aichi-m57-foreshock-check/
📝 Were There Warning Signs Before the Aichi Intensity 5+ Earthquake of Nov. 8? Checking 30 Days of Seismicity with MAPRISE's Earthquake Layer
We used MAPRISE's earthquake layer (JMA data) to look at the strong earthquake that hit Ai…
https://maprise.jp/en/blog/aichi-m57-foreshock-check/ #Earthquake #Aichi
🆕 New on the MAPRISE blog.

《Were There Warning Signs Before the Aichi Intensity 5+ Earthquake of Nov. 8? Checking 30 Days of Seismicity with MAPRISE's Earthquake Layer》

We used MAPRISE's earthquake layer (JMA data) to look at the strong earthquake that hit Aichi Prefecture in the early hours of 8 November 2026. We checked whether small earthquakes had been increasing in the 30 days before it, how many aftershocks followed, and how that compares with 26 years of records. We also introduce our research on earthquake simulation that combines ground conditions, construction year, seismic code and structure.

👉 Read the full post: https://maprise.jp/en/blog/aichi-m57-foreshock-check/

#Earthquake #Aichi #Intensity5+ #Foreshocks #Aftershocks
Related posts
- Chasing the Hizen Moat sleeping beneath Tenjin, with MAPRISE's old-map layers2026-07-11
- A Seawall That Still Protects Us 170 Years Later: Hamaguchi Goryo, the Hirokawa Embankment, and the 10 Metres to Hiro Hachiman Shrine2026-11-15
- Are Bear Sightings Caused by Megasolar? We Overlaid Sighting Points, Municipal Heatmaps, National Forests and Solar Plants to Find Out2026-11-07