A common hypothesis says bears are coming into towns because forests were cleared for megasolar plants. We tested it by overlaying four MAPRISE layers: bear sighting points, municipal sighting counts, national forests and solar plants. The link with megasolar was weak; the link with forest cover was strong.
Hello from the MAPRISE team.
In fiscal 2025, bear sightings rose to record levels across Japan. The Ministry of the Environment's preliminary figures put the national total above 50,000, the highest on record.
A hypothesis came up on our team: "Forests were cleared for many megasolar plants, so bears lost their habitat and former denning areas, and have been pushed into populated areas."
It sounds plausible. Is it true? MAPRISE has the layers needed to check. This time we overlaid four of them:
- Bear sighting points (sightings, signs and injuries published by local governments)
- Bear sighting counts by municipality (fiscal 2025; the municipal heatmap)
- National forest (sub-compartments) (Forestry Agency; generally closed to sale and development, so megasolar is essentially not built there)
- Solar plants (two layers showing the panel footprints, "Coverage area (AI / satellite spectral estimate)" and "Solar panels (OpenStreetMap)", plus the locations of FIT-approved plants, limited to 500 kW and above)
The short answer: we found no clear relationship between megasolar and bear sightings. But municipalities with more forest (national forest) clearly had more sightings. To make it easy to read, we split the screen and show each layer separately next to all of them overlaid.
1. Where did fiscal 2025 sightings concentrate?
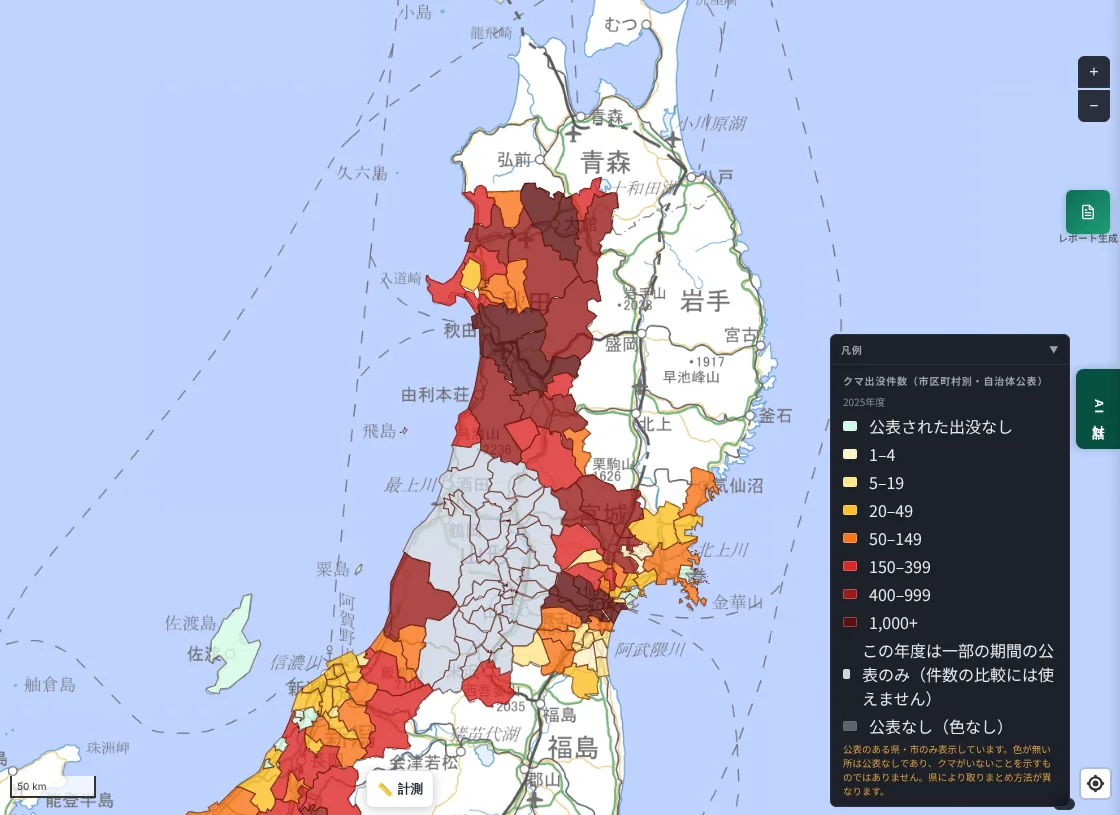
This is the municipal heatmap: the darker the color, the more sightings in fiscal 2025. Dark colors stand out in inland Akita, Miyagi and Niigata.
The grey in Yamagata marks municipalities that published only part of the year. Their counts cannot be compared, so we excluded them from the statistics below. Uncolored areas simply have no published data; they do not mean there are no bears.
2. Side by side: bears plus national forest, and solar panels
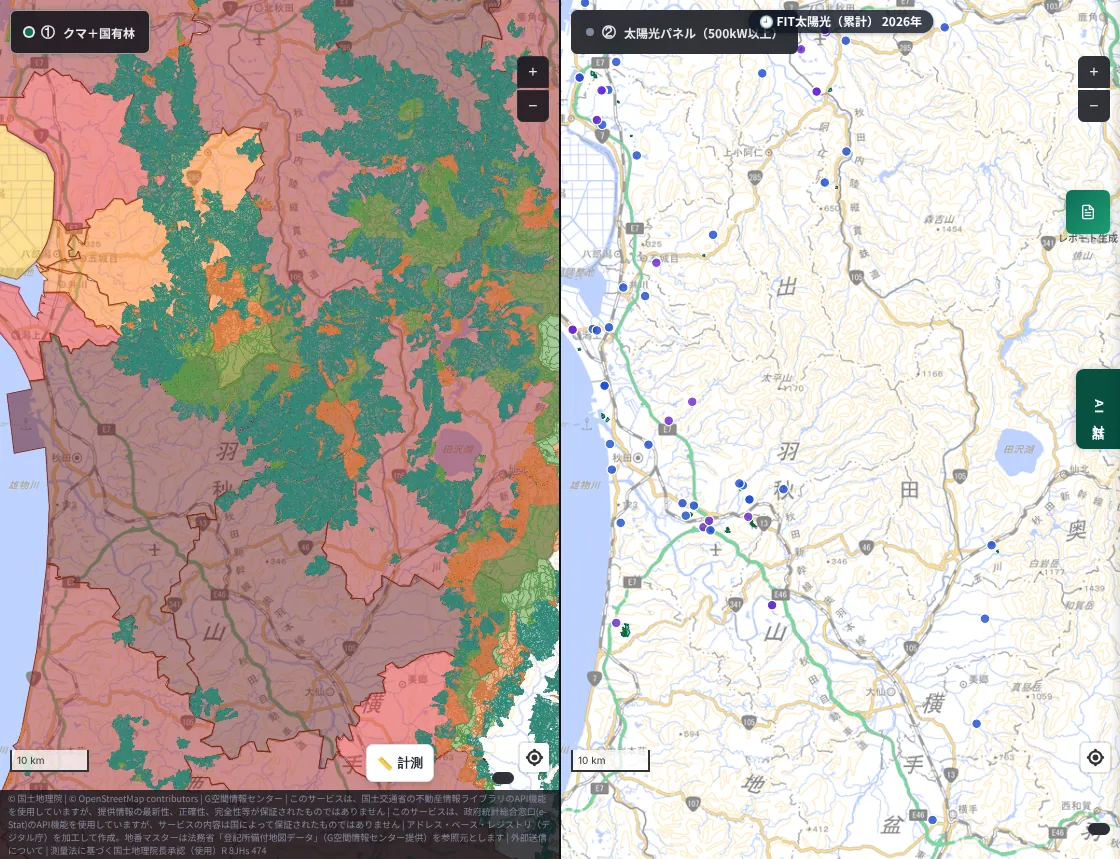
We split the screen into two for Akita. The left shows "sighting heatmap + national forest"; the right shows "solar panels (two layers) + FIT-approved plants of 500 kW or more".
On the left, wide national forest covers the inland area with many sightings (Kitaakita, Kazuno, Odate and others). On the right, solar plants cluster on the coastal plain and along main roads, with almost none in the inland mountains. In Akita, the places with many sightings and the places with megasolar mostly do not overlap. Since megasolar is generally not built on national forest, that is not surprising.
3. Four panes (1): wide national forest, almost no megasolar, yet many sightings (Kazuno and Odate)
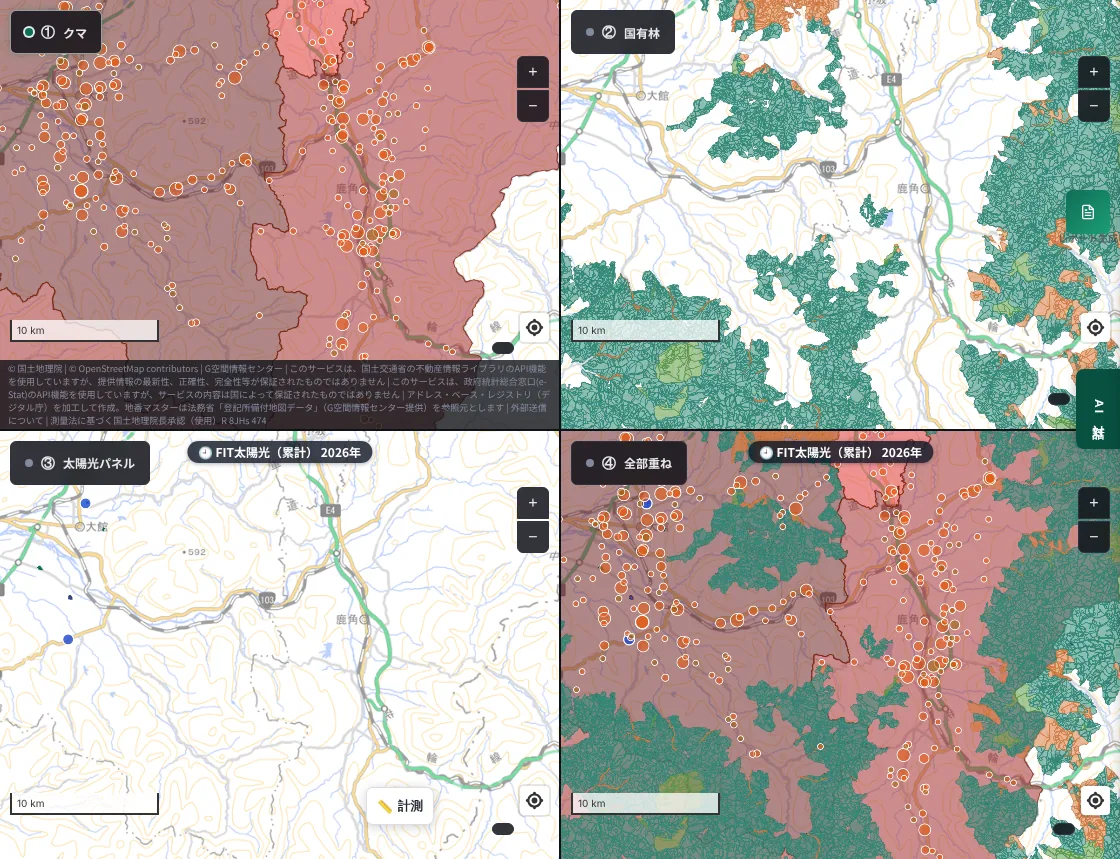
Here the screen is split in four: top left "Bears" (heatmap and sighting points), top right "National forest", bottom left "Solar panels", bottom right "All overlaid".
Sighting points (orange dots) cluster along valley settlements and roads surrounded by national forest. Meanwhile the solar panel pane at bottom left shows almost nothing.
Counting them confirmed it: Kazuno (896 sightings in fiscal 2025) and Odate (1,324) both have zero plants of 500 kW or more. So bears clearly appear even without megasolar.
4. Four panes (2): and where megasolar is plentiful? (Kurihara)
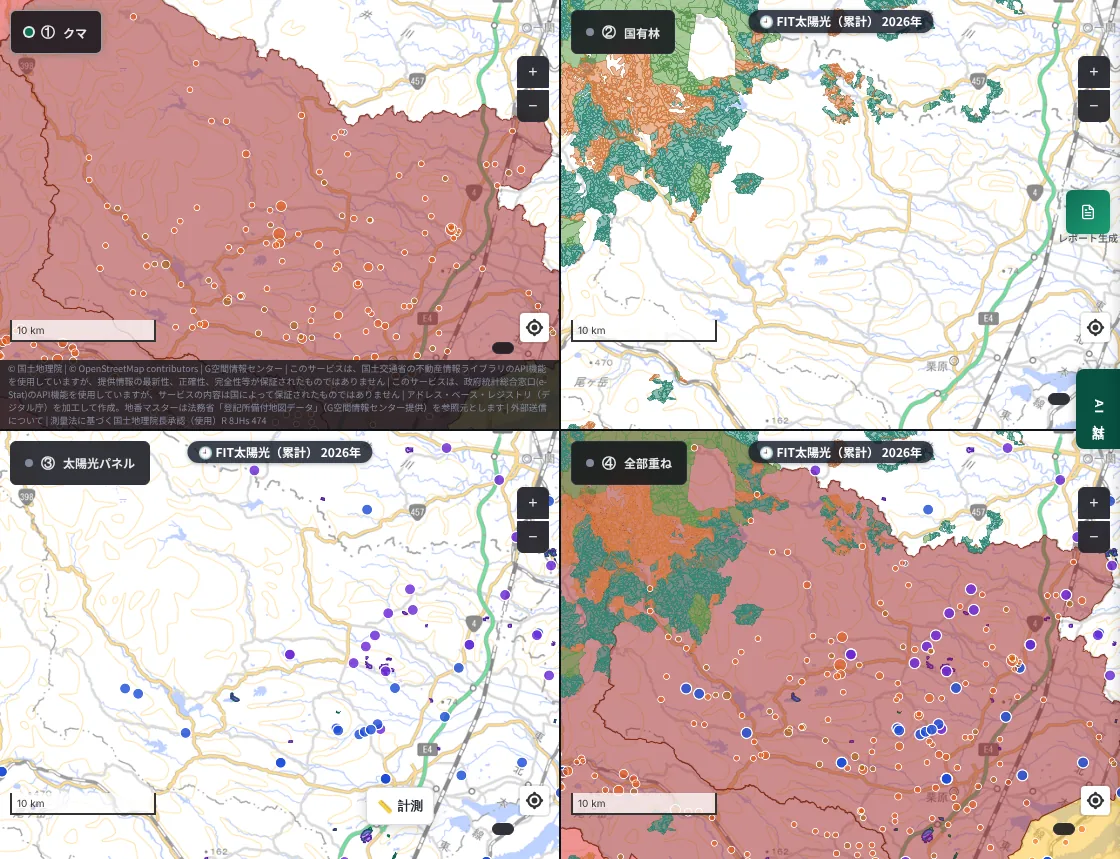
This is Kurihara in Miyagi, which has relatively many megasolar plants (43 of 500 kW or more).
Solar (bottom left) is scattered across the plain, and sightings (top left) also spread over the same plain up to the foothills. Overlaid at bottom right, both exist in the same area, so it may look related at a glance. But, as the top right shows, this is also an area with national forest on the mountain side. From the screen alone, we cannot tell whether solar is the cause or whether both simply sit near forest.
5. Checking with numbers: 133 municipalities in five prefectures
A visual impression can mislead. So for 133 municipalities with full-year fiscal 2025 data (Akita, Miyagi, Niigata, Toyama and Yamanashi, plus one city in Yamagata), we computed rank correlations (Spearman) using per-area values.
| Compared | Correlation | Reading |
|---|---|---|
| Sightings × national forest share of area | 0.57 (95% interval 0.45 to 0.68) | Clear positive correlation |
| Sightings × density of PV of 500 kW+ | 0.13 (95% interval −0.06 to 0.31, p=0.14) | Weak; not statistically significant |
| Sightings × PV density, after removing the effect of forest share | 0.04 | Essentially none |
We also split the municipalities into four groups and compared average sightings per 100 km² (national forest at 5% or more of area counts as "more forest"; one or more plants of 500 kW+ per 100 km² counts as "more megasolar").
| Less megasolar | More megasolar | |
|---|---|---|
| Less national forest | 24.8 (51 municipalities) | 24.8 (38 municipalities) |
| More national forest | 56.3 (25 municipalities) | 80.7 (19 municipalities) |
Where national forest is scarce, sightings were the same (24.8) with or without megasolar. Where it is plentiful, areas with megasolar had somewhat more (80.7 vs 56.3), but this likely mixes in a common factor (confounding): areas near mountains tend to have both more forest and more solar.
6. Over time: approvals fell, sightings still swing widely
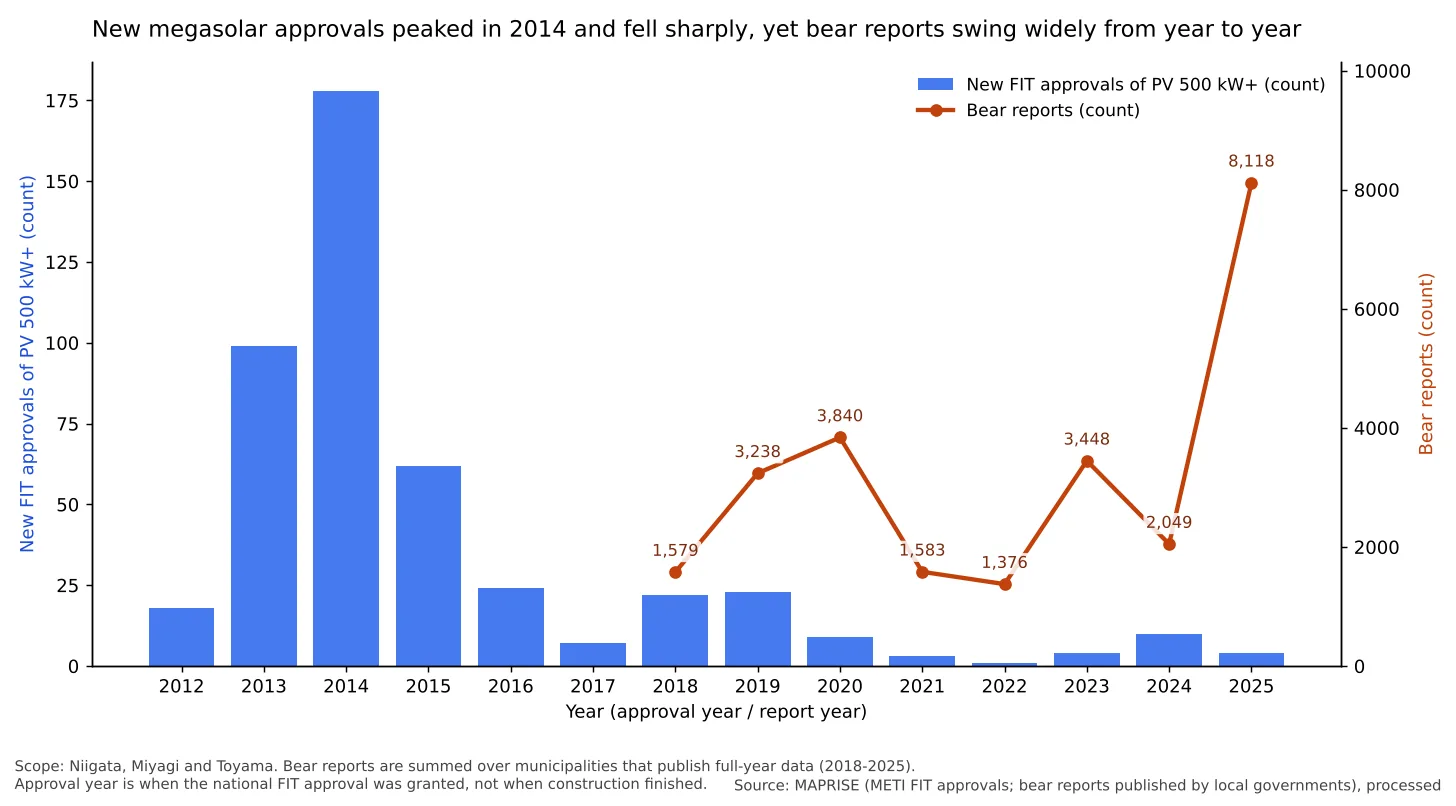
We also looked at timing. New approvals of PV of 500 kW or more peaked at 178 in 2014 across the three prefectures and then fell sharply. Yet bear sightings swing widely from year to year, with peaks in 2019 to 2020, 2023 and 2025.
If the growth of megasolar were the main driver, we would expect sightings to rise in a smoother way after the years when approvals grew. Instead they surged in years when approvals were low. The Ministry of the Environment and several prefectures point to poor crops of beech and other nuts as a main cause of recent increases, and several prefectures reported a very poor beech crop in fiscal 2025. Our pattern is consistent with that view.
What we can and cannot say
What this analysis suggests
- Municipalities with more forest, such as national forest, have more bear sightings (correlation 0.57).
- Within this scope, there is no clear relationship between the amount of megasolar and sightings.
- Sightings swing widely from year to year even after new solar approvals declined.
What this analysis cannot say (limitations)
- It does not show that megasolar has no effect on bears. We looked at municipality-level trends. Effects of clearing or grading that fragmented habitat on a particular mountain are invisible in this data.
- Forest share is approximated by national forest share; private forest is not included.
- Solar locations are approximate positions based on addresses. "Approval year" is when national approval was granted, not when construction finished.
- Each municipality collects sighting counts differently (police reports, residents' reports and so on). We used only municipalities that publish data, so this is not representative of all of Japan.
- Counts are based on the facilities and parcels drawn on the map, so small omissions are possible.
This analysis "did not support" the hypothesis; it did not "refute" it. Next, we would like to overlay data on forest change (clearing history) and examine individual sites.
Layers used
You can overlay the following layers yourself in the MAPRISE map app (some are available on paid plans).
- "Bear sighting points" and "Bear sighting counts" (switchable to municipality level)
- "National forest (sub-compartments)"
- "Solar plants (FIT-approved)", "Coverage area (AI / satellite spectral estimate)" and "Solar panels (OpenStreetMap)"
The split display can be switched with the "Left-right split" and "4-way split" buttons at the top of the map. For legibility, the images in this article limit FIT plants to 500 kW and above, adjust their color and size, and lower the heatmap opacity. The panel-footprint layers are reference information based on AI estimates and OpenStreetMap entries, and do not cover every plant.
Sources
- Bear sighting information published by local governments (Akita, Miyagi, Niigata, Toyama, Yamanashi and others; sources are shown in the app legend)
- Forestry Agency, National Forest GIS Data (FY2024)
- METI, FIT approval information (Renewable Energy Electronic Application site): https://www.fit-portal.go.jp/
- Ministry of the Environment, "Bear sightings (preliminary figures)", processed (municipal data from each local government)
- Bear sightings top 50,000 in fiscal 2025 (nippon.com, Japanese): https://www.nippon.com/ja/japan-data/h02784/
- Forecast of a very poor beech crop (Saitama Prefecture, Japanese): https://www.pref.saitama.lg.jp/a0508/news/page/news20251006.html
- Municipal areas computed from JapanCityGeoJson (derived from National Land Numerical Information administrative boundaries)
Tags: #Bears #Sightings #Megasolar #Solar power #National forest #Heatmap #Data analysis
Other-language share text (exception cases)
Quick share above follows our platform-locked language policy (X-family in Japanese, LinkedIn in English). The four panes below let you grab the opposite-language body when needed — e.g. introducing an English post to a Japanese audience on X, or posting a Japanese article to LinkedIn in Japanese. Each pane offers both a copy button and a direct intent link.
📝 クマの出没は、メガソーラーのせいなのか ― 出没地点・自治体別ヒートマップ・国有林・太陽光を重ねて確かめてみました
「森を切り開いてメガソーラーを作ったから、クマが人里に出てきたのではないか」。この仮説を、MAPRISEの4つのレイヤー(クマ出没地点、市区町村別の出没件数、国有林、太陽光発電設備)を重ねて確かめました。結果は、メガソーラーとの関係は弱く、森林の多さとの関係が強い、というものでした。
https://maprise.jp/ja/blog/bear-sightings-forest-megasolar/ #クマ #出没
🆕 新しいブログ記事を公開しました。

《クマの出没は、メガソーラーのせいなのか ― 出没地点・自治体別ヒートマップ・国有林・太陽光を重ねて確かめてみました》

「森を切り開いてメガソーラーを作ったから、クマが人里に出てきたのではないか」。この仮説を、MAPRISEの4つのレイヤー(クマ出没地点、市区町村別の出没件数、国有林、太陽光発電設備)を重ねて確かめました。結果は、メガソーラーとの関係は弱く、森林の多さとの関係が強い、というものでした。

👉 詳しくはこちら: https://maprise.jp/ja/blog/bear-sightings-forest-megasolar/
📝 Are Bear Sightings Caused by Megasolar? We Overlaid Sighting Points, Municipal Heatmaps, National Forests and Solar Plants to Find Out
A common hypothesis says bears are coming into towns because forests were cleared for megasolar …
https://maprise.jp/en/blog/bear-sightings-forest-megasolar/ #Bears #Sightings
🆕 New on the MAPRISE blog.

《Are Bear Sightings Caused by Megasolar? We Overlaid Sighting Points, Municipal Heatmaps, National Forests and Solar Plants to Find Out》

A common hypothesis says bears are coming into towns because forests were cleared for megasolar plants. We tested it by overlaying four MAPRISE layers: bear sighting points, municipal sighting counts, national forests and solar plants. The link with megasolar was weak; the link with forest cover was strong.

👉 Read the full post: https://maprise.jp/en/blog/bear-sightings-forest-megasolar/

#Bears #Sightings #Megasolar #Solarpower #Nationalforest
Related posts
- A Seawall That Still Protects Us 170 Years Later: Hamaguchi Goryo, the Hirokawa Embankment, and the 10 Metres to Hiro Hachiman Shrine2026-11-15
- Were There Warning Signs Before the Aichi Intensity 5+ Earthquake of Nov. 8? Checking 30 Days of Seismicity with MAPRISE's Earthquake Layer2026-11-10
- Don't Choose a Cliff-Top Home on View and Elevation Alone: Retaining Walls, Disclosure Rules, Land Prices and Yellow Zones, City by City (Part 2)2026-10-25