Nagakute near Nagoya, Shingu between Fukuoka and Kitakyushu, Tokyo's bay area: places where housing suddenly turned over show up as pale patches on the map. We compared towns with mostly new housing and towns with mostly old housing using MAPRISE's new “Old Housing Share” layer (the share of homes built in 1980 or earlier). Click a municipality to see housing counts and a breakdown by construction period.
Hello, this is the MAPRISE development team.
We recently added a layer called “Old Housing Share.” For each municipality, it shows what share of occupied homes were built in 1980 or earlier, in color.
The lower the share, the newer the housing; the higher the share, the older. And the places that appear as pale patches have something in common: housing there increased rapidly from a certain period onward.
Key points
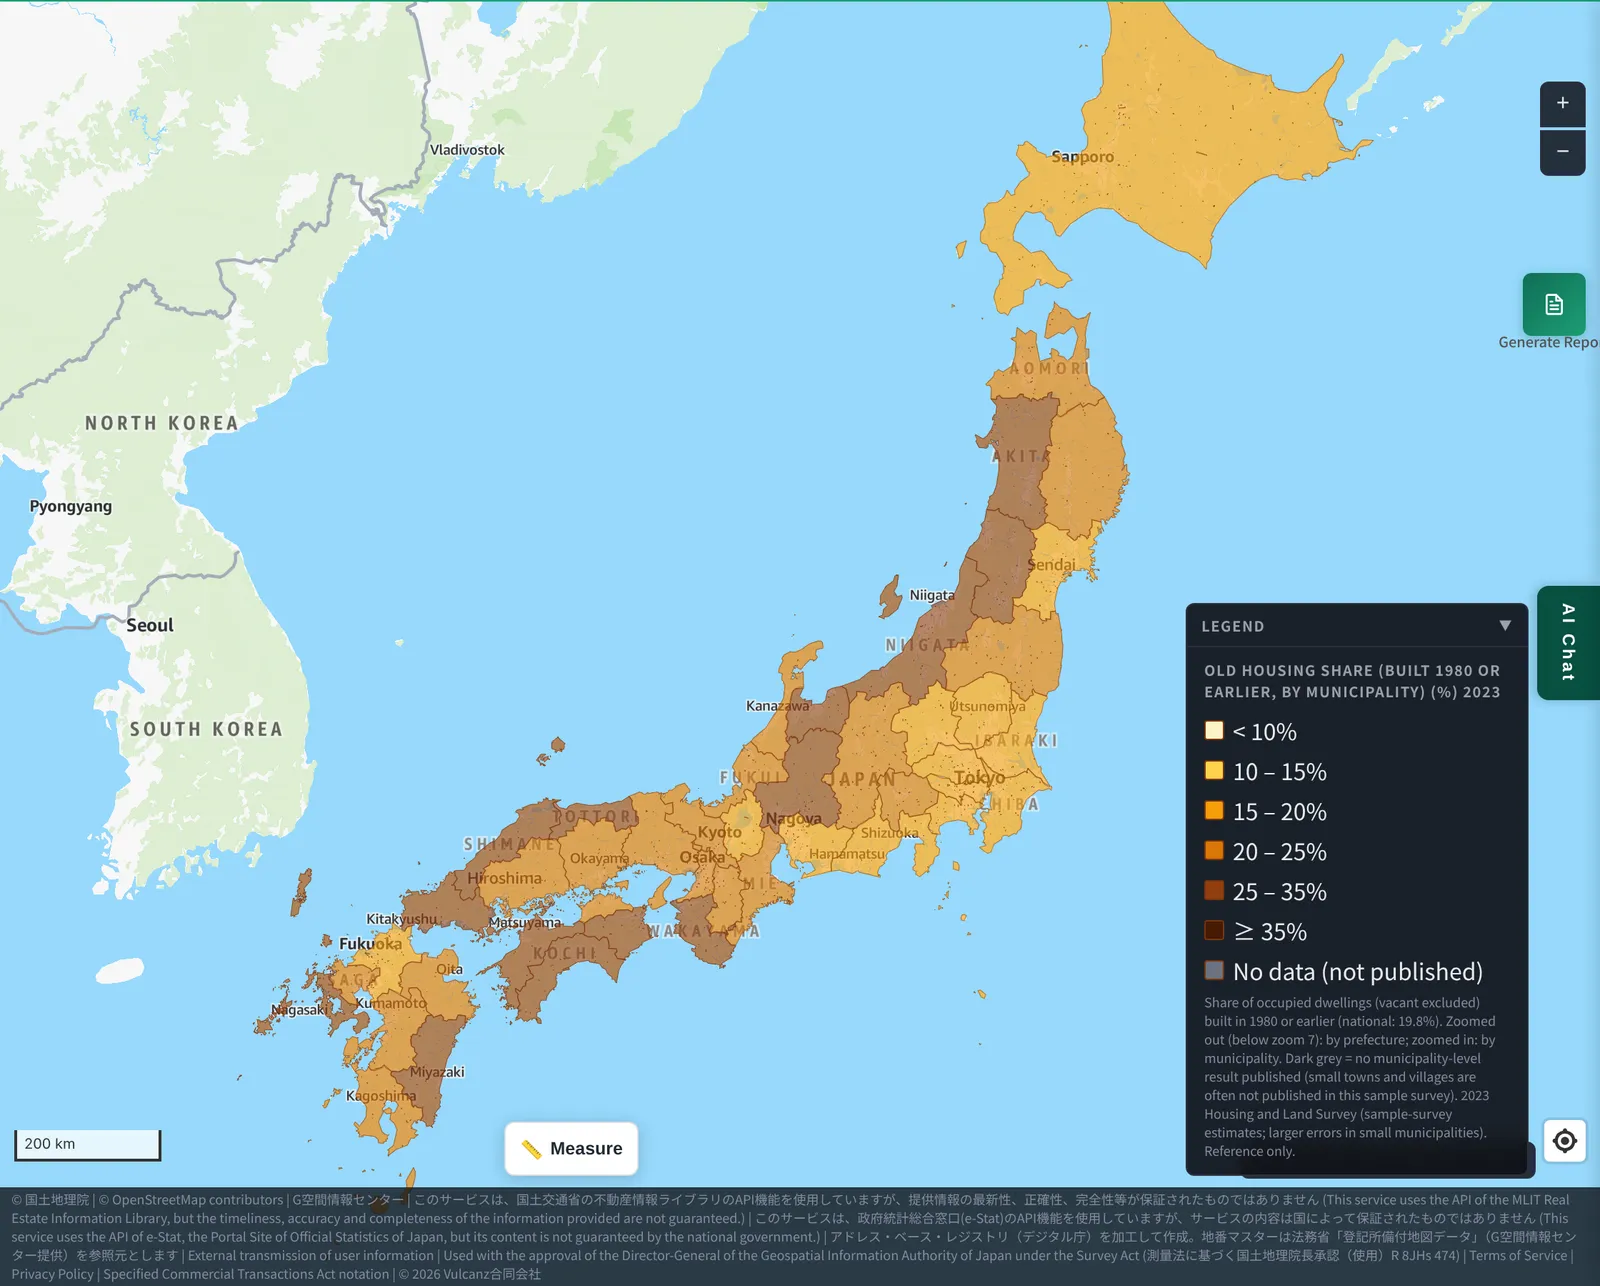
- The Old Housing Share is the share of homes built in 1980 or earlier (Statistics Bureau of Japan, Housing and Land Survey, 2023). The national figure is 19.8%.
- A low share means newer housing. This is common in commuter towns around big cities and in central districts where large apartment complexes were built.
- Even among suburbs of big cities, towns developed earlier show a higher share (for example, around Osaka).
- Click a municipality to see homes built in 1980 or earlier, occupied homes, the gap from the prefecture as a whole, and a breakdown by construction period.
1. What is the Old Housing Share?
We calculate it as follows (a MAPRISE-derived figure).
(Homes built in 1970 or earlier + homes built 1971–1980) ÷ occupied homes
Japan's building code was revised in June 1981 (the so-called new seismic standard). “1980 or earlier” can be used as a rough indicator of how many homes follow the old seismic standard (homes built January–May 1981 are not included in this share).
The map shows prefectures when zoomed out (below zoom 7) and switches to municipalities when you zoom in. Paler means newer; darker brown (35% or more) means older.
2. New towns stand out in color
Nagoya — Nagakute and Nisshin
Nagakute, in Aichi Prefecture, is a commuter town just east of Nagoya. Its Old Housing Share is 8.7% — less than half the national figure (19.8%) and 9.0 points below Aichi as a whole (17.7%).
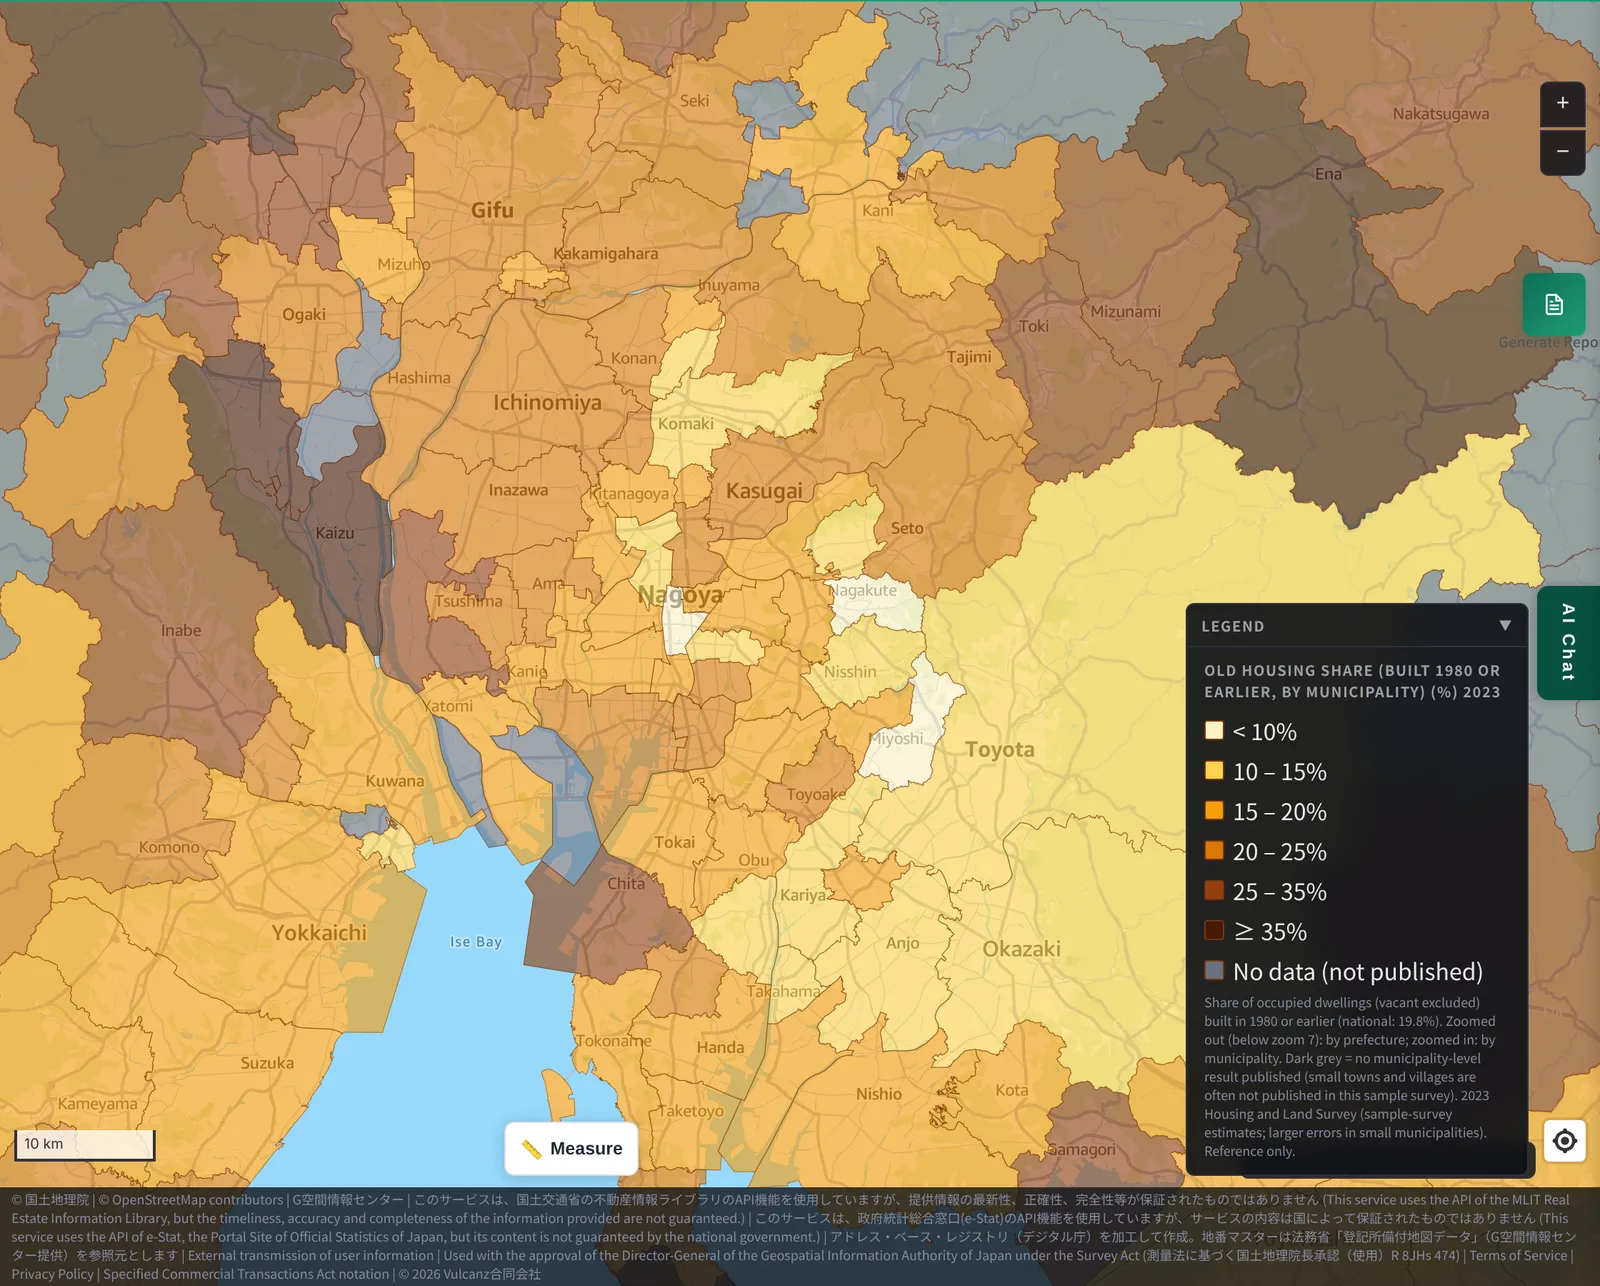
East of Nagoya you can see municipalities in near-white. Neighboring Nisshin is at 10.3% and Miyoshi at 9.5%.
Clicking shows the following.
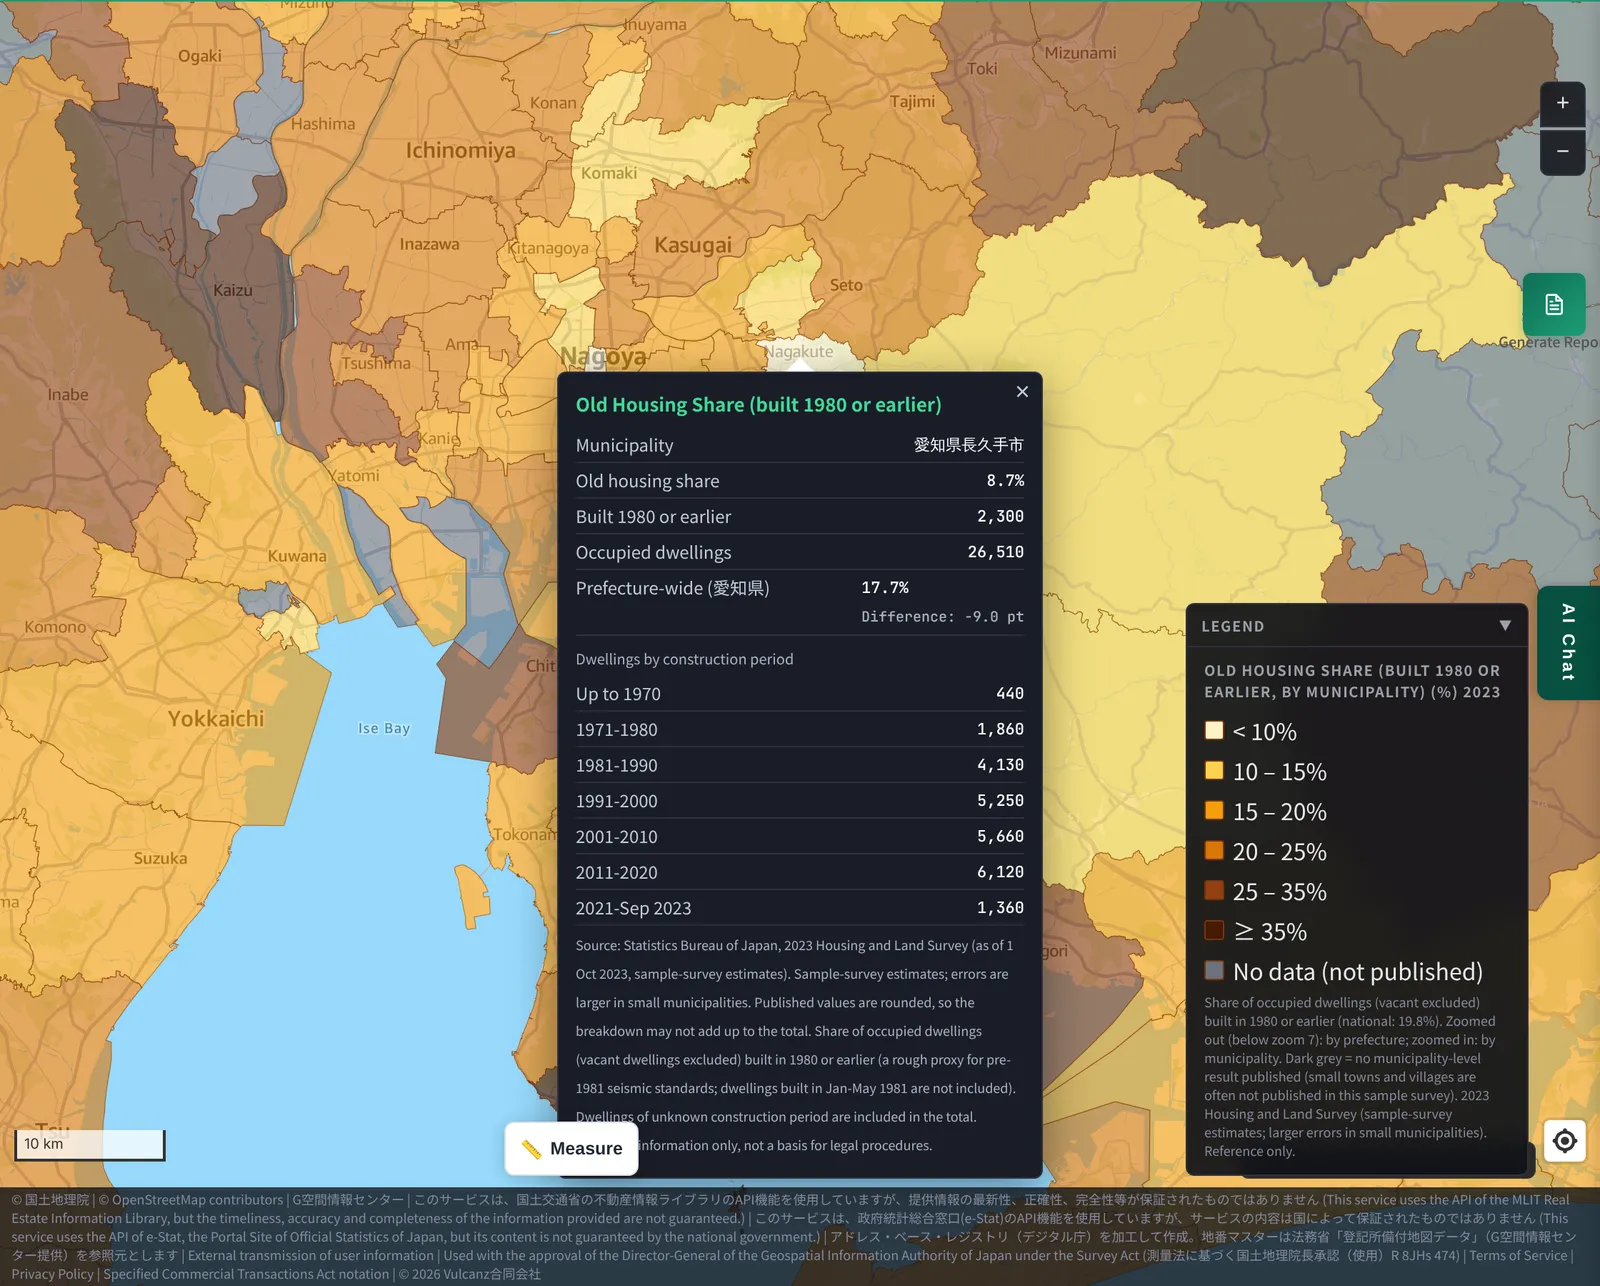
Of Nagakute's 26,510 occupied homes, 2,300 were built in 1980 or earlier. By construction period, homes pile up thickly from 1981–1990 (4,130 homes) onward. The signature of a town where housing grew rapidly from a certain period shows up in the numbers too.
Between Fukuoka and Kitakyushu — Shingu
Shingu, in Fukuoka Prefecture between Fukuoka City and Kitakyushu City, is similar. Its Old Housing Share is 9.5%. Neighboring Kasuya is at 11.7% and Fukutsu at 15.9%.
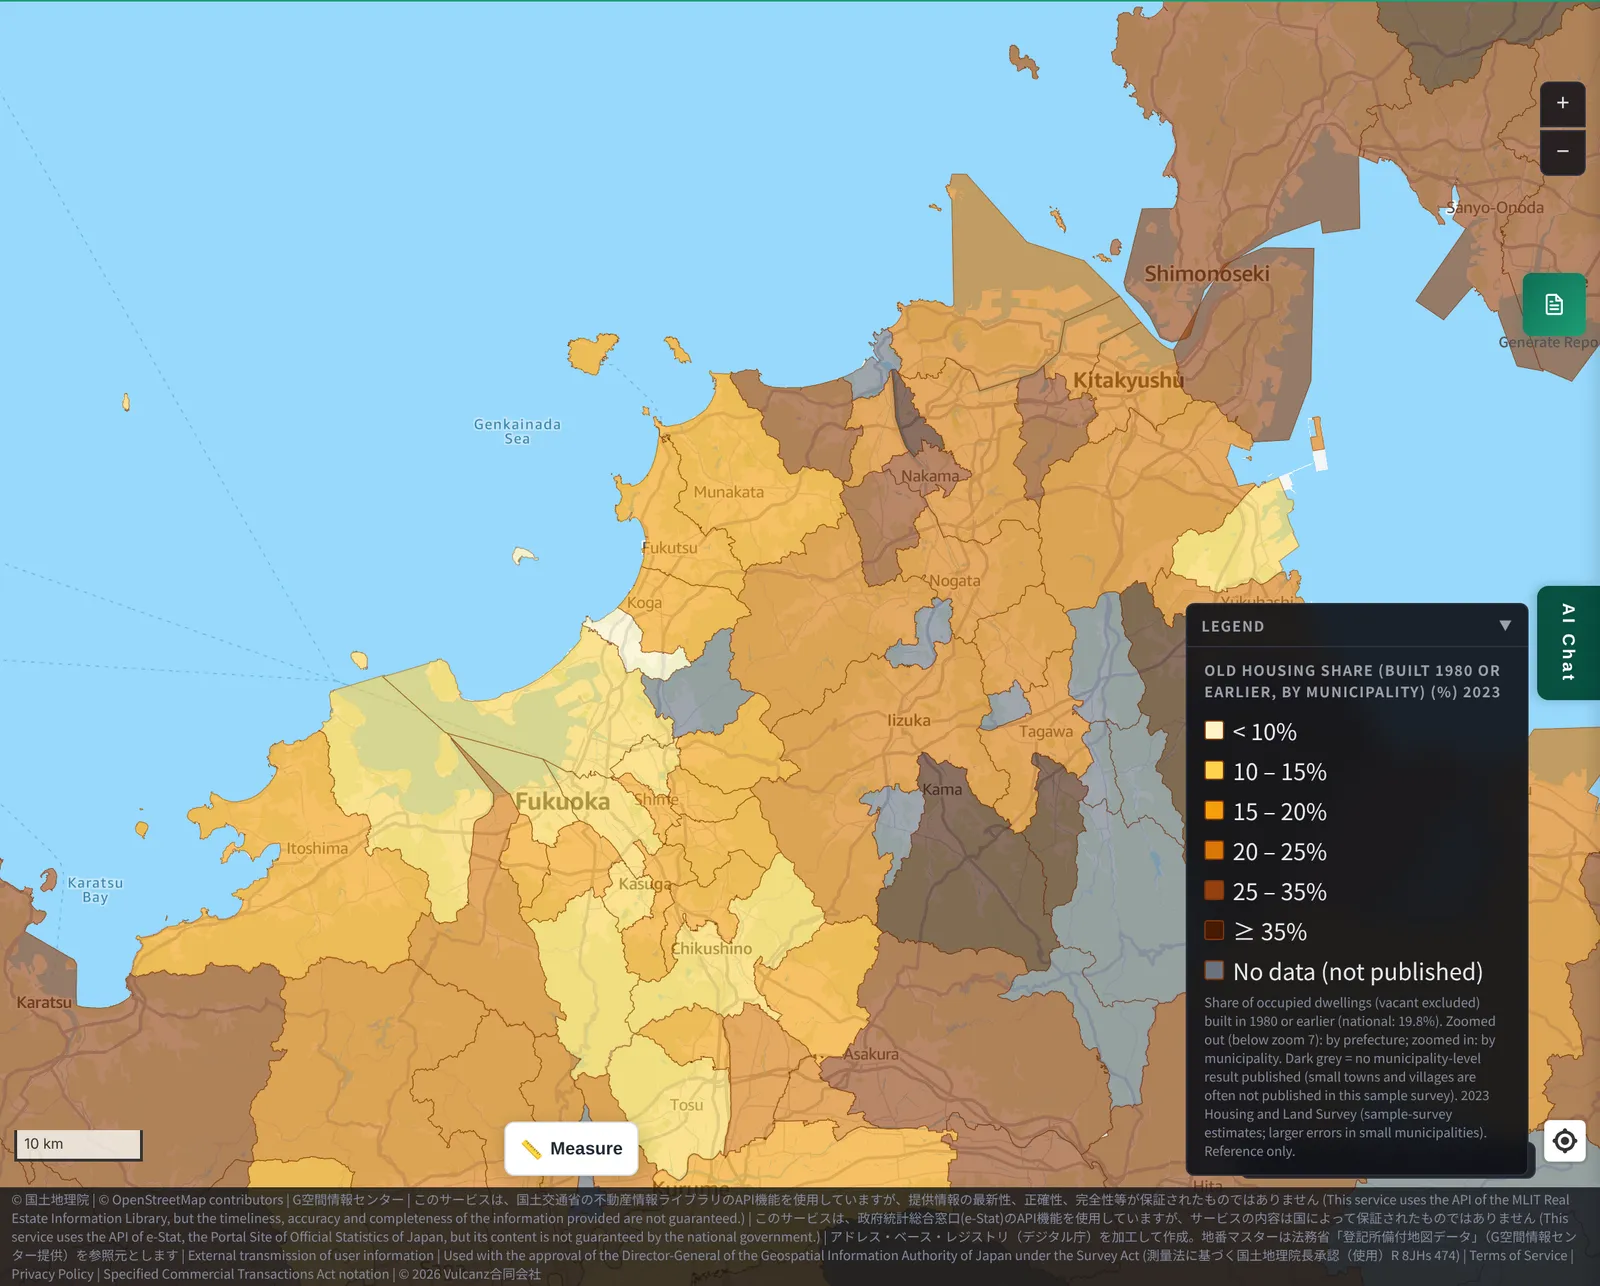
Pale municipalities stand out around Fukuoka City (13.8% overall). By contrast, Kitakyushu (23.4% overall) has many wards with a high share of older homes, such as Moji Ward (30.5%) and Yahata-Higashi Ward (28.0%).
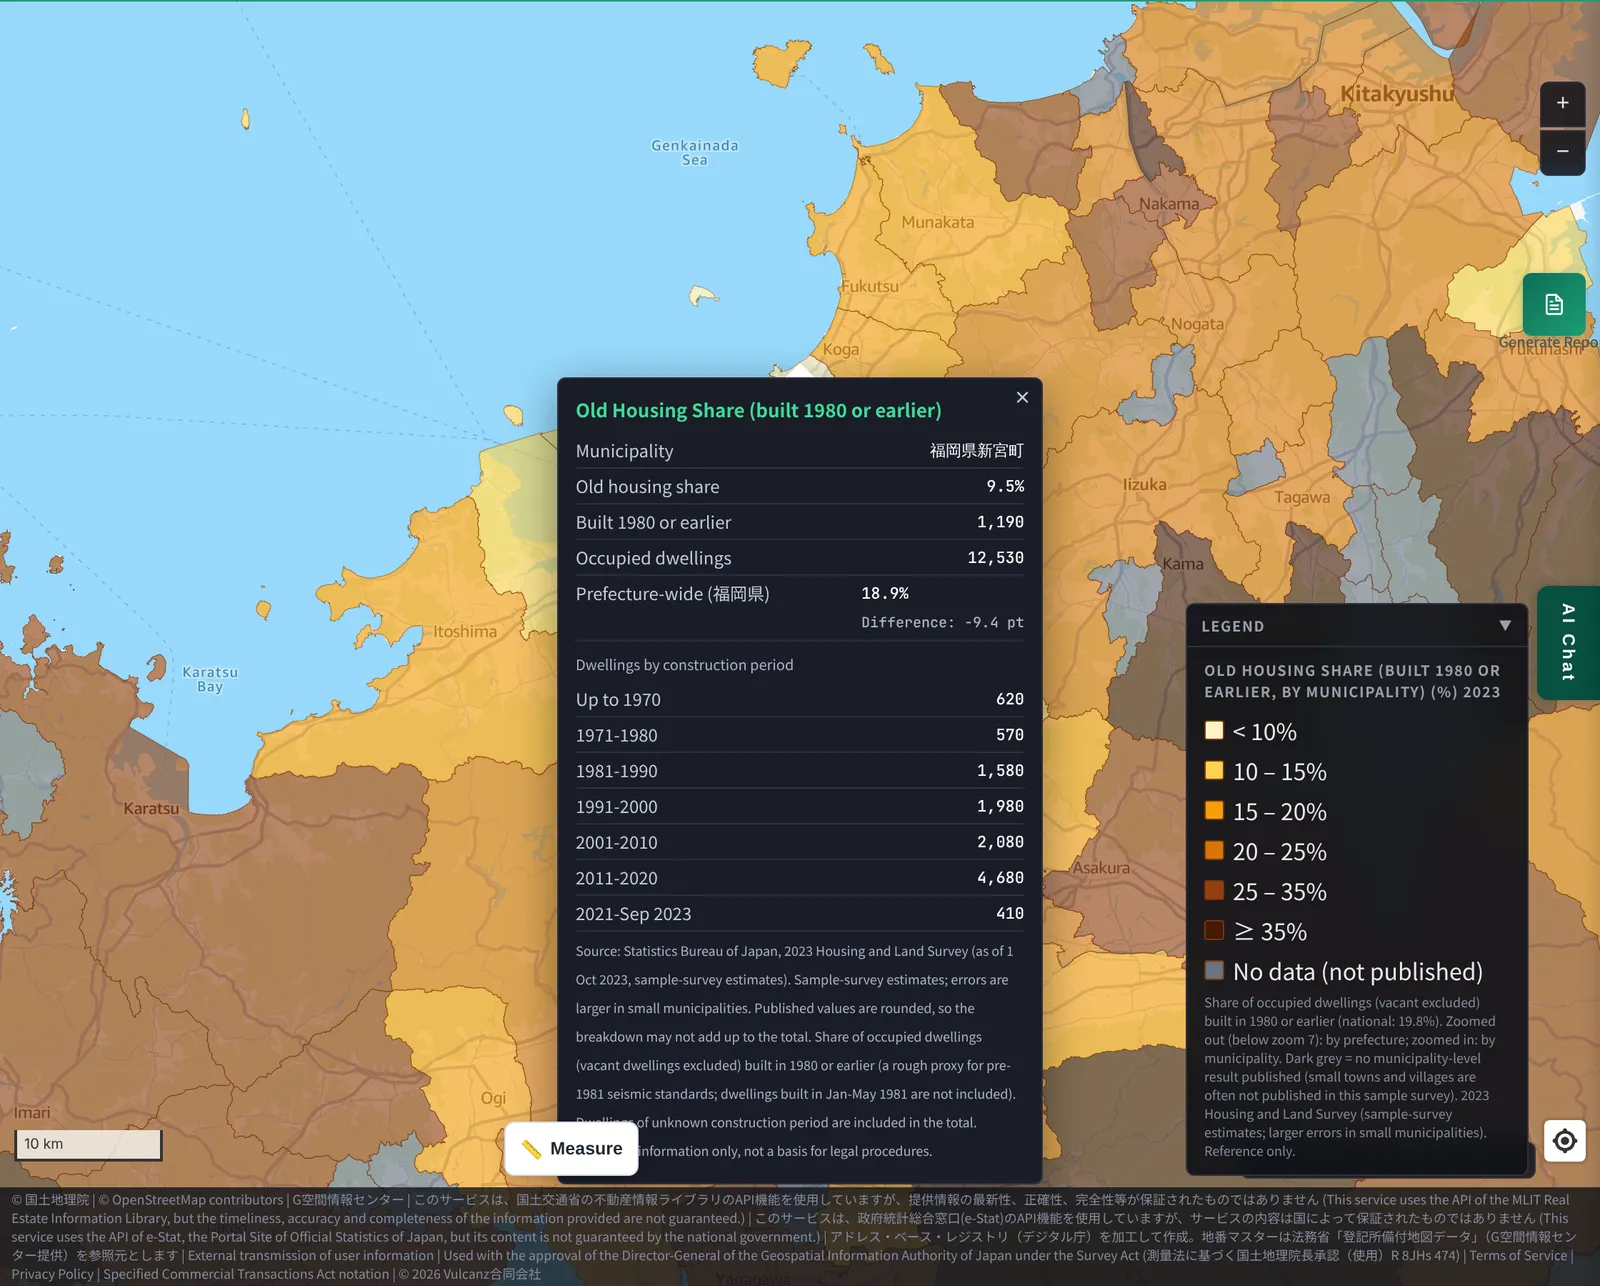
Kumamoto — Kikuyo and the Kumamoto City area
Kumamoto Prefecture shows the same pattern around its main city. The prefecture as a whole is at 22.9%, but Kumamoto City is at 14.7%, and nearby Koshi (12.9%), Mashiki (12.4%) and Kikuyo (16.0%) are all below the prefectural figure.
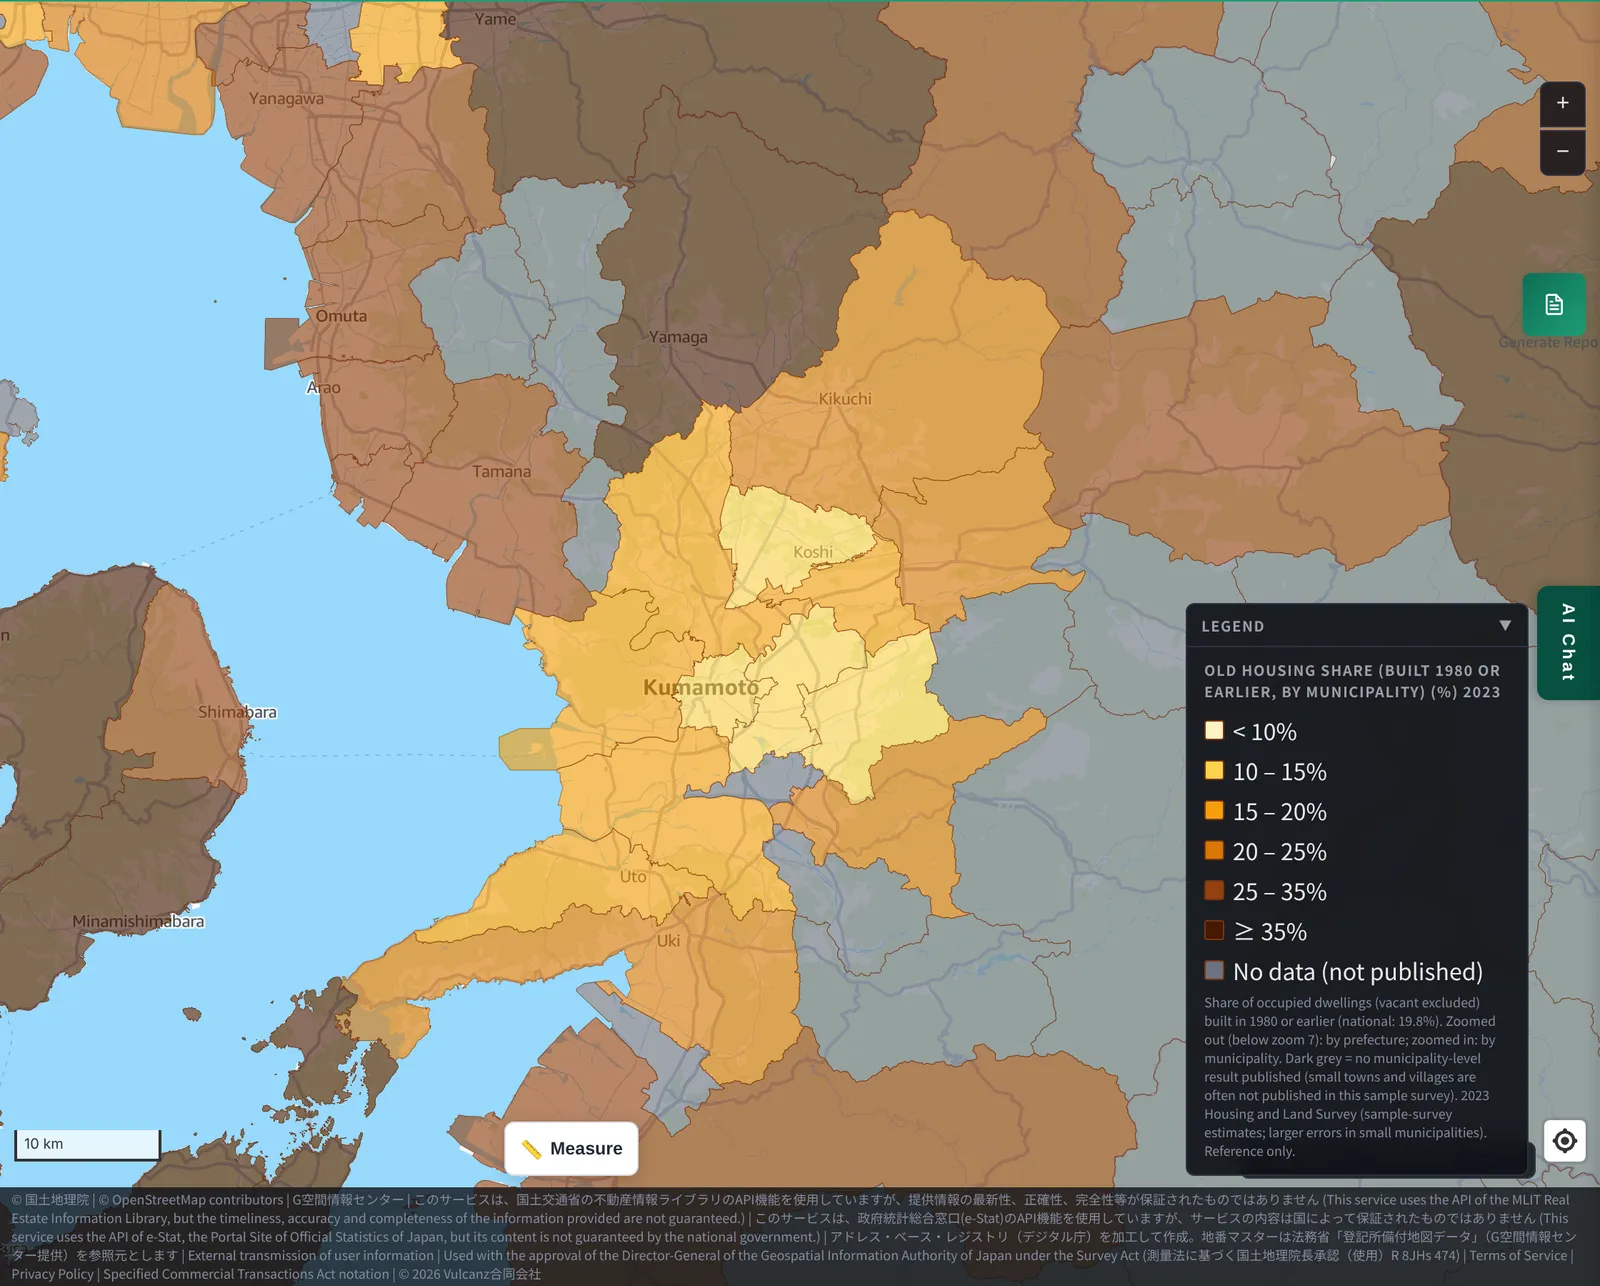
Clicking Kikuyo, which has drawn attention for the arrival of a semiconductor plant, shows the following.
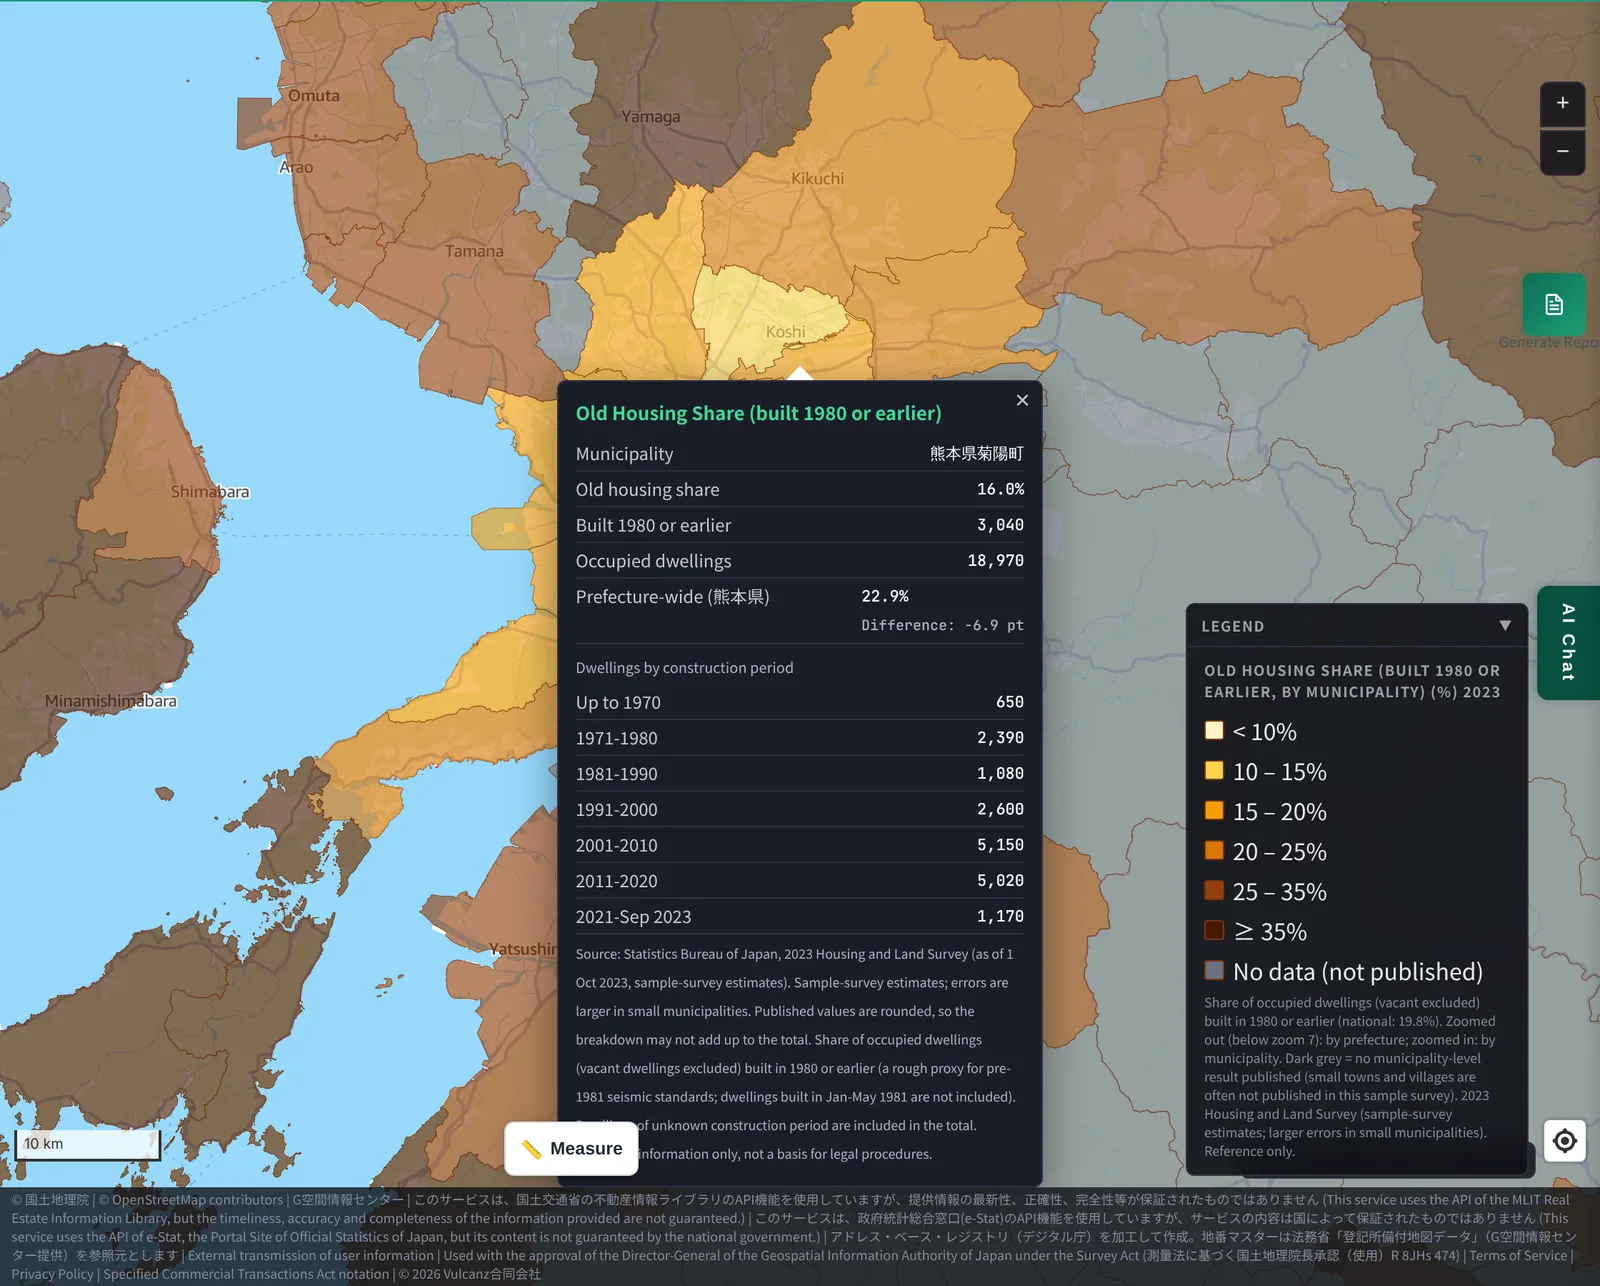
Of Kikuyo's 18,970 occupied homes, 3,040 were built in 1980 or earlier. That is lower than the prefecture as a whole, but not as low as Nagakute or Shingu. It is probably a town where older and newer residential areas are mixed.
Tokyo — the bay area and central tower condominiums
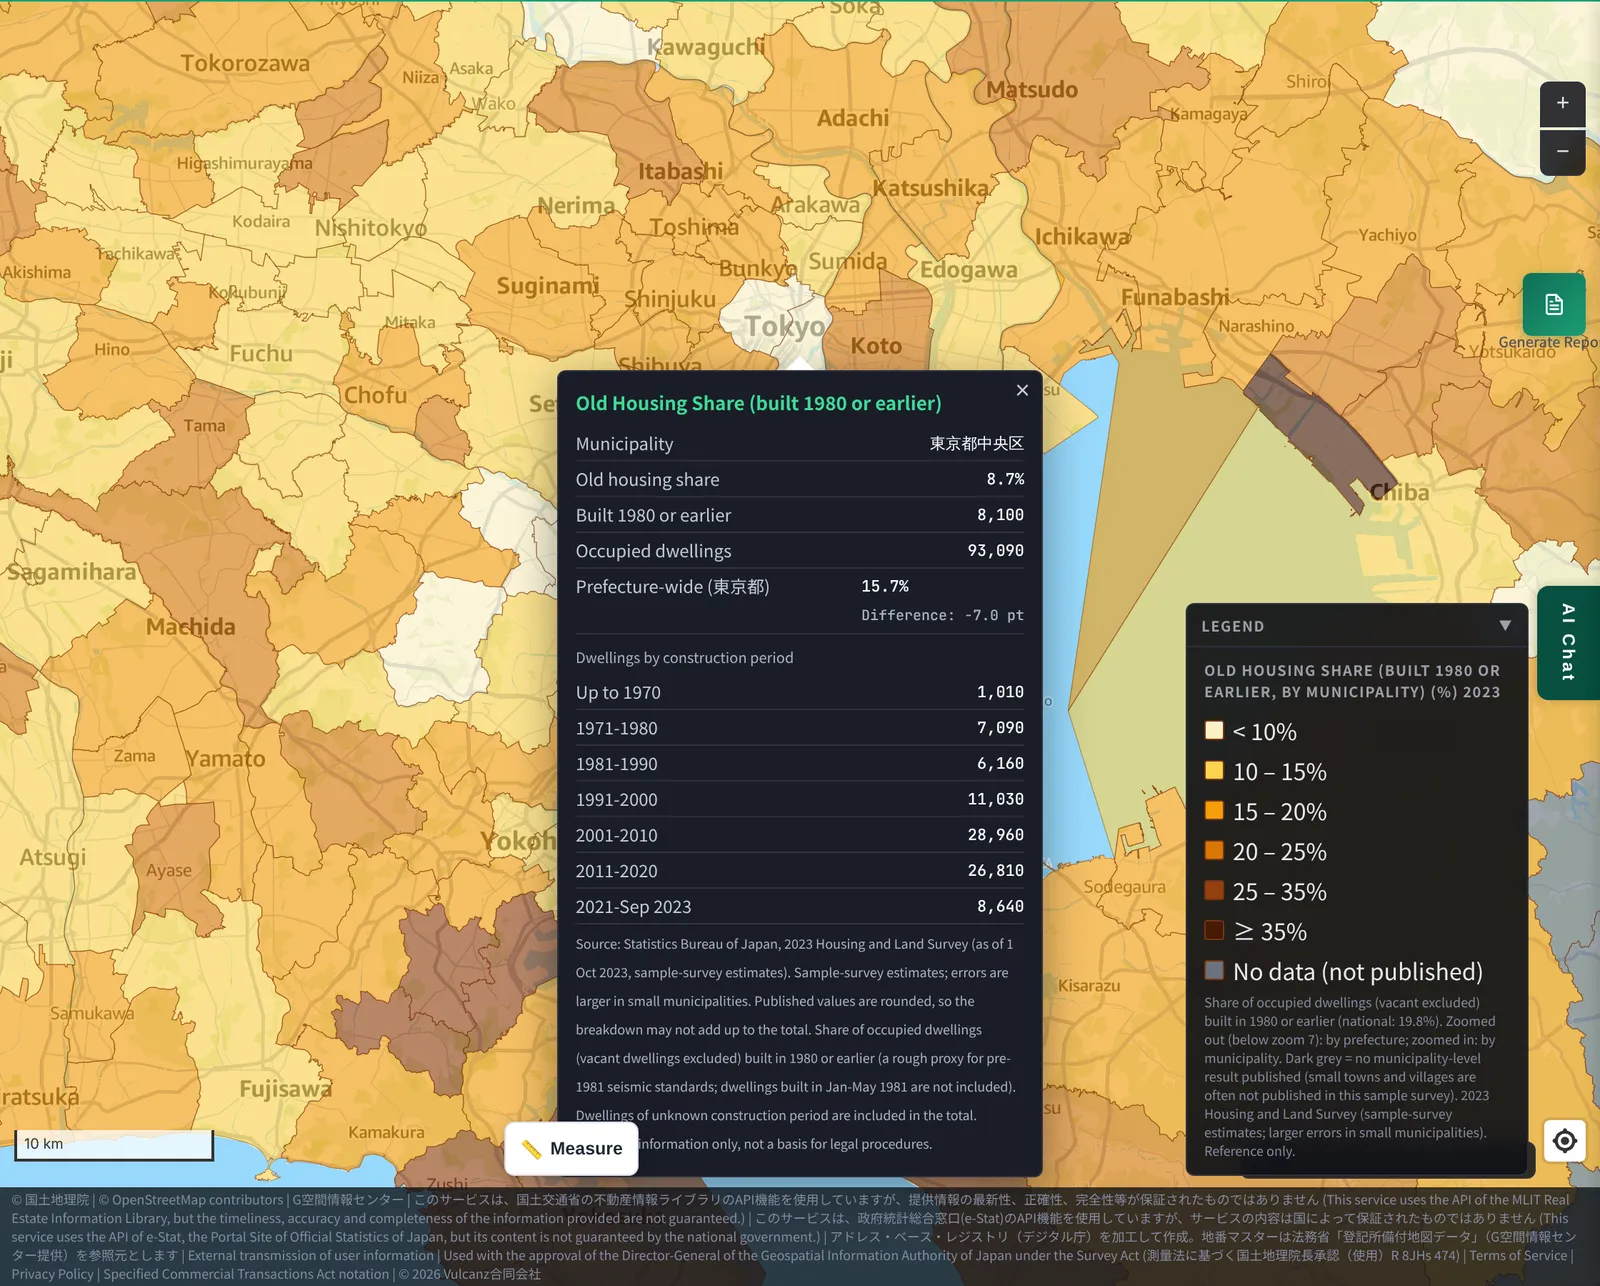
Central Tokyo is a little different. A single large complex such as a tower condominium can add hundreds to a thousand new homes at once.
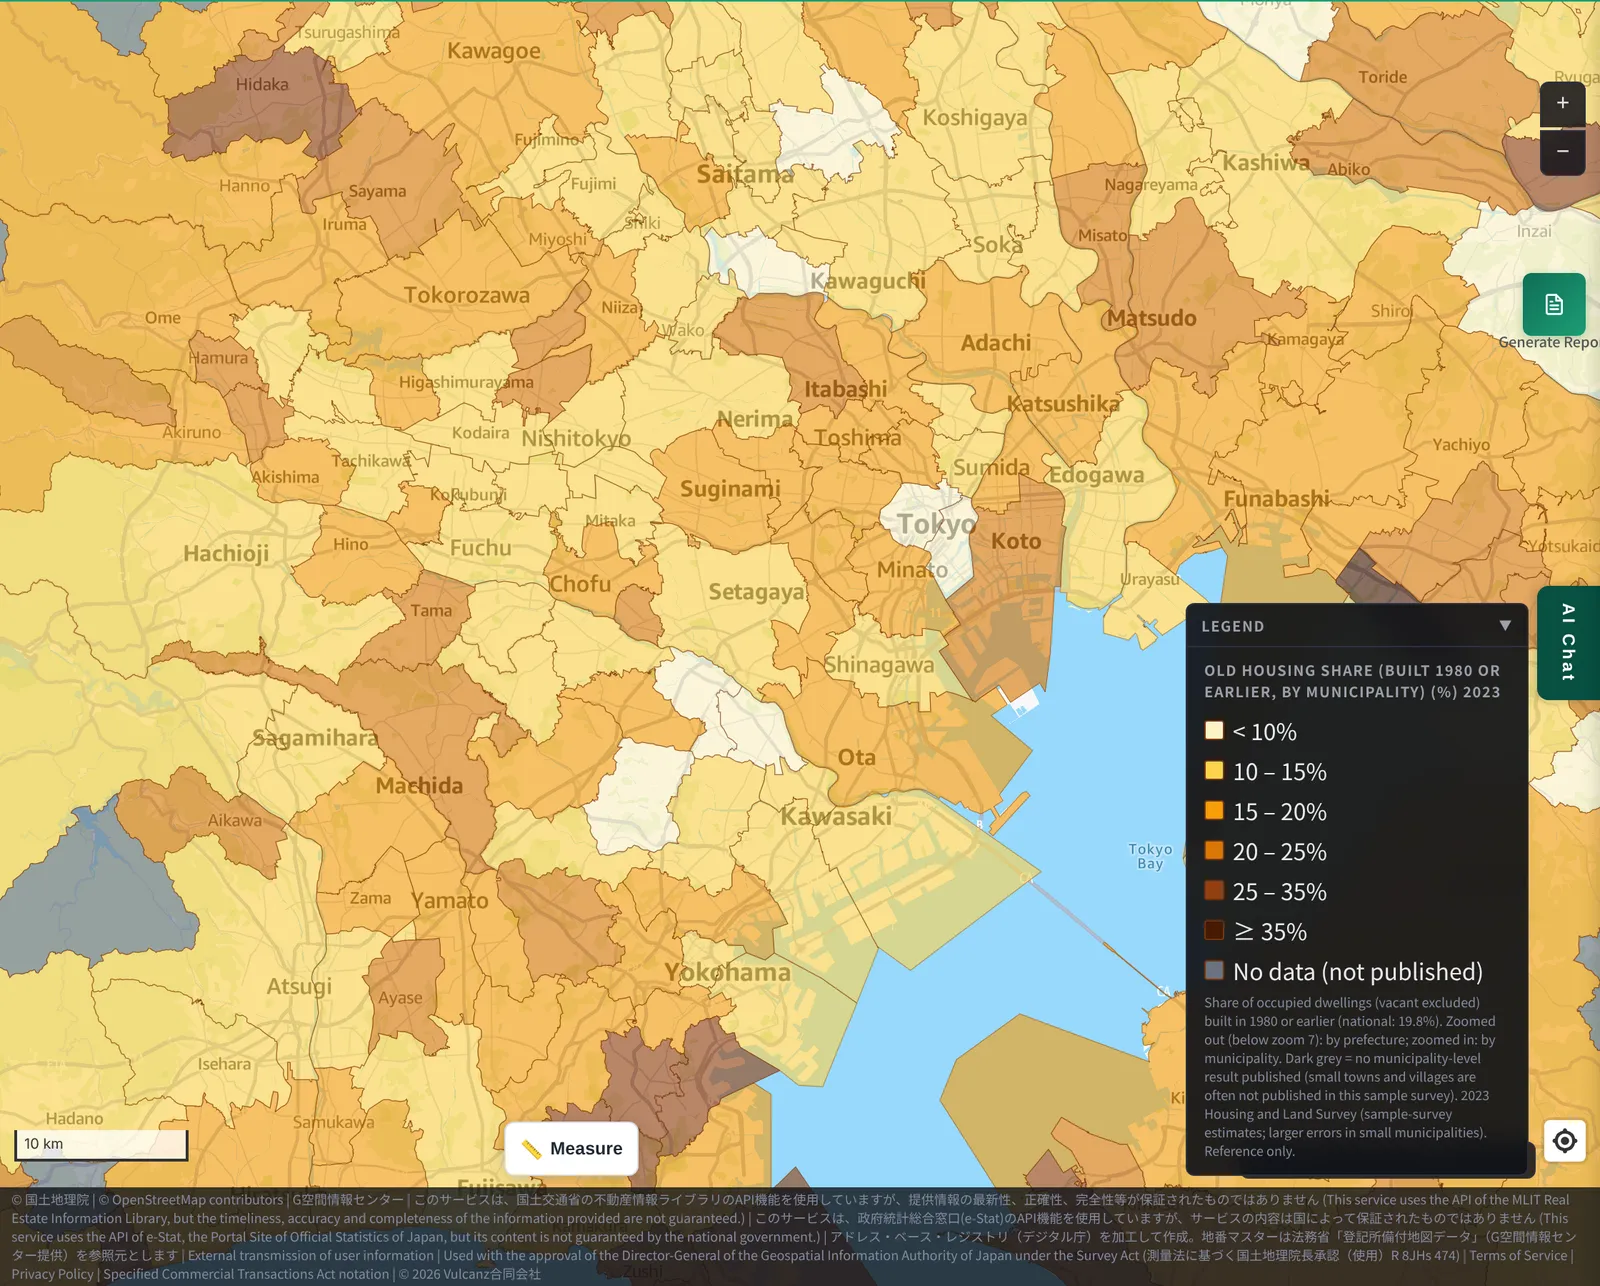
- Chuo Ward, Tokyo: 8.7%
- Chiyoda Ward: 9.2%
- Nakahara Ward, Kawasaki (around Musashi-Kosugi): 6.4%
- Minato Ward: 16.3%
Chuo, Chiyoda and Nakahara are in the single digits. Minato is below the national figure (19.8%), but a fair number of older homes remain, so it is higher than these wards.
3. “Next to a big city” does not always mean “new”
So far we have looked at new towns, but not every suburb of a big city is new.
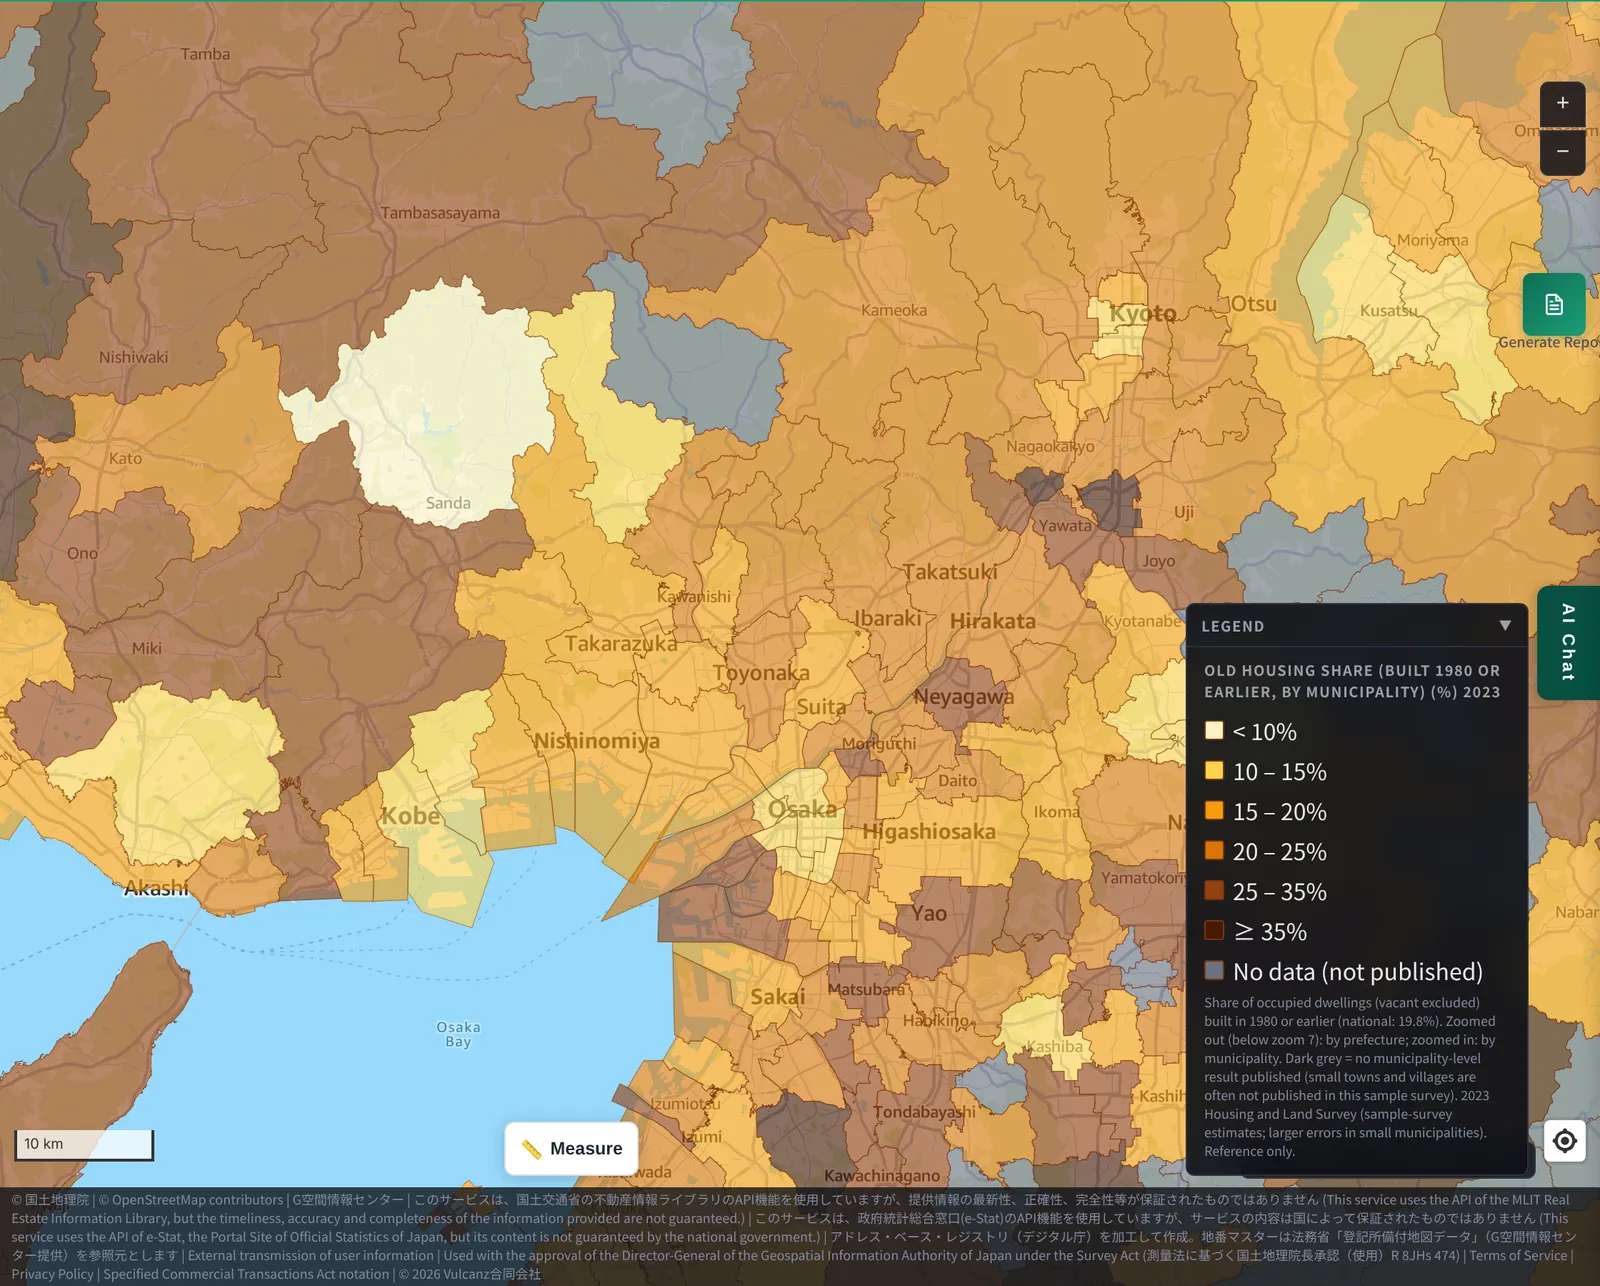
Around Osaka, many municipalities are above the national figure, such as Minoh (23.4%) and Hirakata (23.3%).
On the other hand, Sanda in Hyogo Prefecture is low at 8.8% — a newer town even within the same region. Minoh and Hirakata are probably commuter towns that were developed earlier than Nagakute or Shingu. Even among “satellite cities of a big city,” the color differs by the generation in which they were developed.
4. Towns with many older homes
Let's also look at the high end.
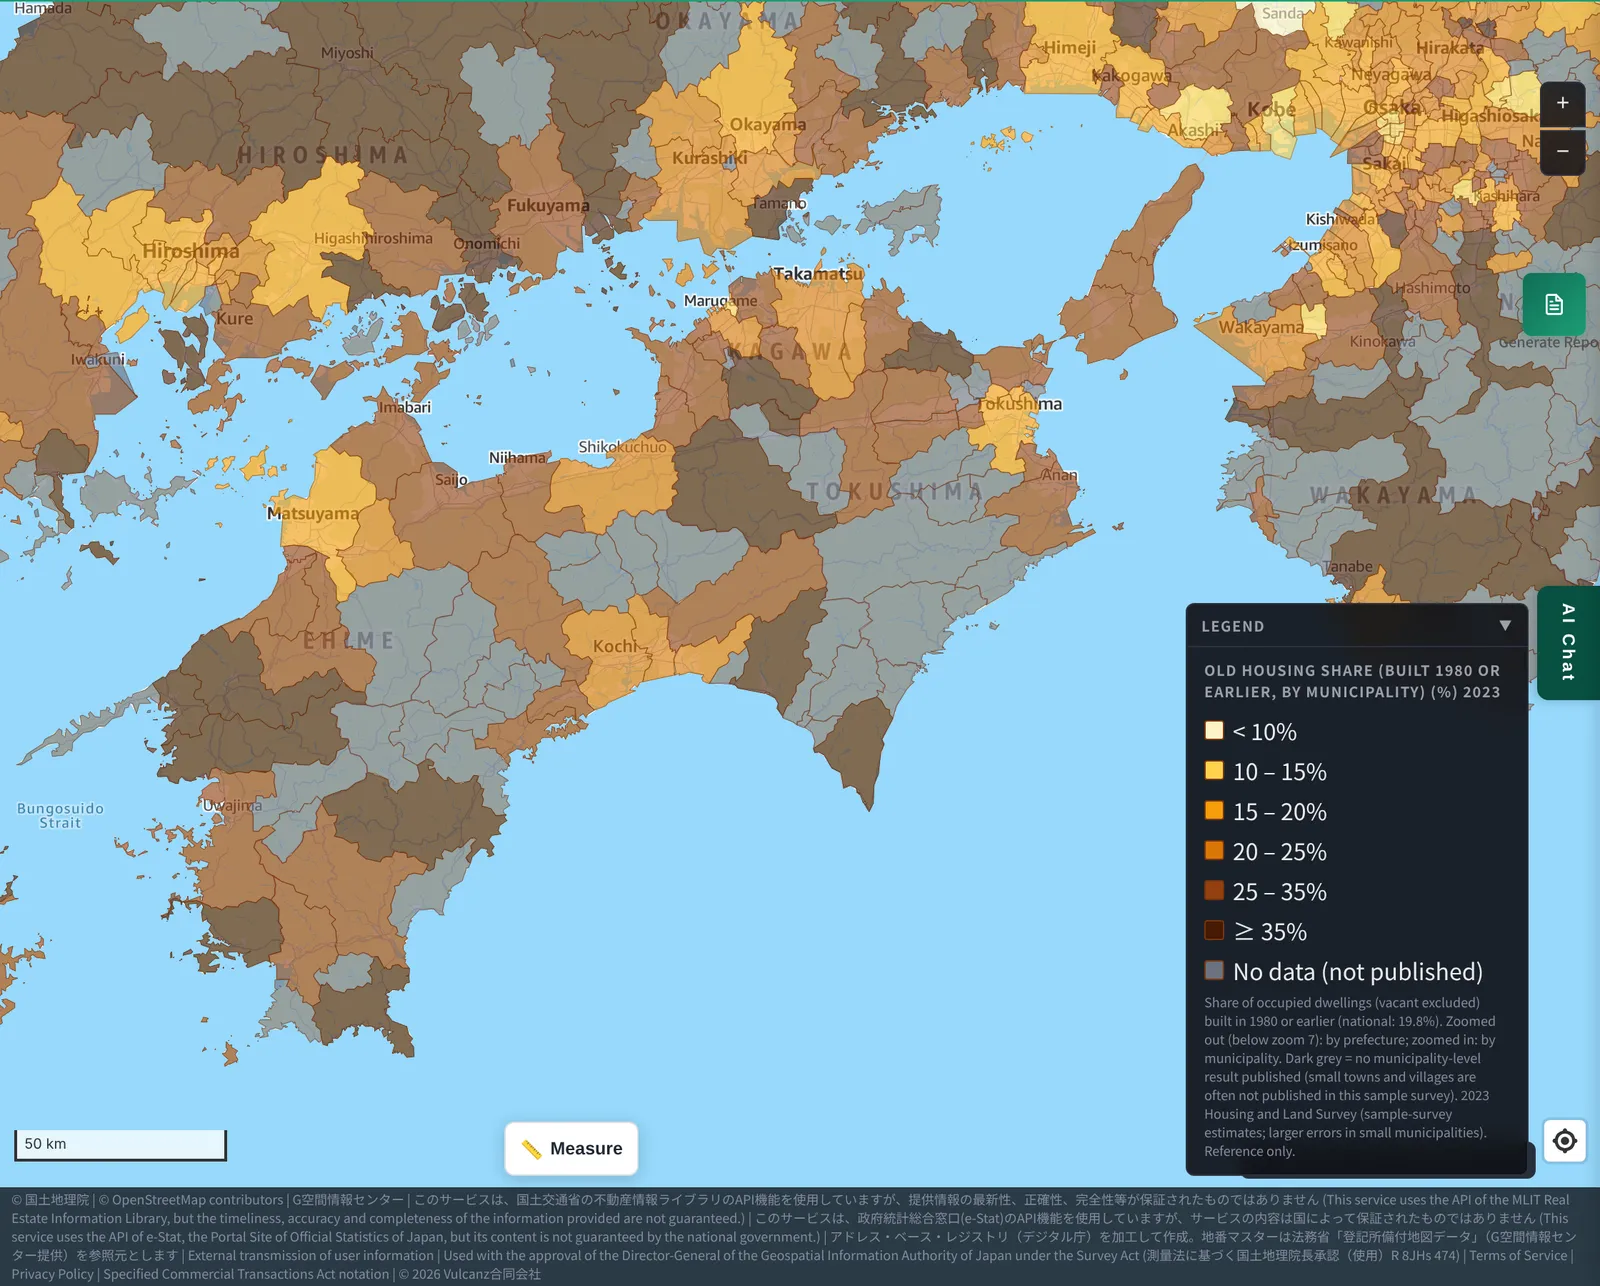
In southern Shikoku, Muroto in Kochi Prefecture is at 54.0% and Tosashimizu at 48.0%. Among prefectures, Shimane (32.3%) and Wakayama (29.0%) are high.
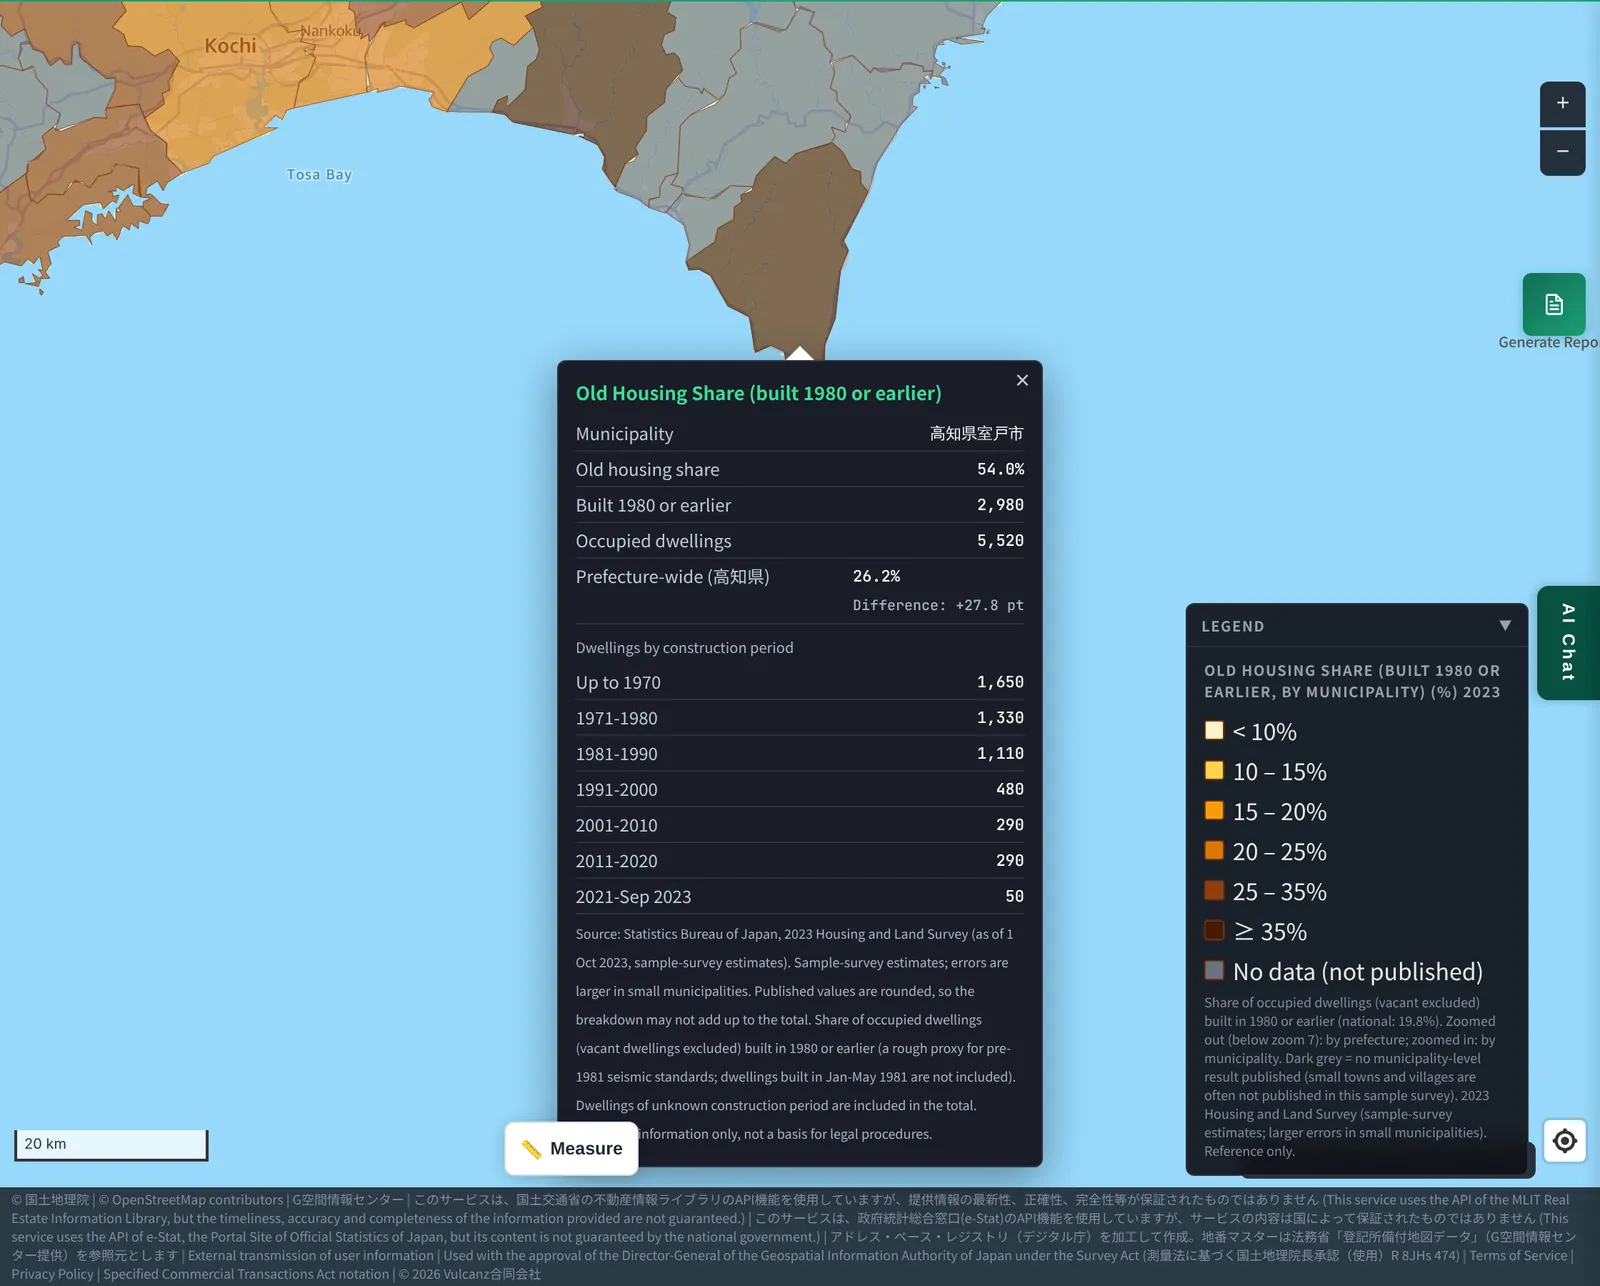
In municipalities with small populations, few new homes get built, which probably pushes the share up.
5. Notes on reading the map
- The Housing and Land Survey is a sample survey every five years. These are estimates, so the smaller the population, the larger the error.
- Municipalities without published results are shown in gray (no data).
- The Old Housing Share does not show the age of individual buildings, nor seismic performance or deterioration.
- Published figures are rounded, so breakdowns may not add up to the total.
- This is reference information, not a basis for legal procedures, valuation or transactions.
* All images in this article show the layer above as displayed on November 18, 2026. Maps were zoomed and panned for readability.
6. What we can and cannot tell
What we can tell
- Towns with a low Old Housing Share are towns where housing grew rapidly from a certain period — commuter towns around big cities, and areas around large apartment complexes in city centers.
- Towns with a high share are towns where new homes were built more slowly.
What we cannot tell
- Why housing grew (or did not) in a given town. Population and development history cannot be read from this layer alone.
- The age or seismic performance of individual buildings.
7. Layer used
- “Old Housing Share (built 1980 or earlier, by municipality)” (the “Living” group in the map app): available on the Starter plan and above. You can switch between 2023 and 2018.
Sources
- Statistics Bureau of Japan, “2023 Housing and Land Survey,” Basic Tabulation on Housing and Households (e-Stat; Government of Japan Standard Terms of Use, v2.0)
- Statistics Bureau of Japan, “2018 Housing and Land Survey” (e-Stat)
Tags: #old housing share #housing age #old seismic code #commuter towns #tower condominiums #Housing and Land Survey #heatmap #municipalities
Other-language share text (exception cases)
Quick share above follows our platform-locked language policy (X-family in Japanese, LinkedIn in English). The four panes below let you grab the opposite-language body when needed — e.g. introducing an English post to a Japanese audience on X, or posting a Japanese article to LinkedIn in Japanese. Each pane offers both a copy button and a direct intent link.
📝 新しい街・古い街が、色でわかる ― 「築古住宅率」で見る、ベッドタウンとタワマンの街
名古屋の長久手、福岡と北九州の間の新宮、東京の湾岸。街が急に新しくなった場所は、地図の上で色が薄く抜けて見えます。MAPRISEに追加した「築古住宅率」(1980年以前に建てられた住宅の割合)のレイヤで、新しい住宅が多い街と、古い住宅が多い街を比べました。クリックで、住宅数や建築時期の内訳も確認できます。
https://maprise.jp/ja/blog/housing-age-old-rate-heatmap/ #築古住宅率 #築年数
🆕 新しいブログ記事を公開しました。

《新しい街・古い街が、色でわかる ― 「築古住宅率」で見る、ベッドタウンとタワマンの街》

名古屋の長久手、福岡と北九州の間の新宮、東京の湾岸。街が急に新しくなった場所は、地図の上で色が薄く抜けて見えます。MAPRISEに追加した「築古住宅率」(1980年以前に建てられた住宅の割合)のレイヤで、新しい住宅が多い街と、古い住宅が多い街を比べました。クリックで、住宅数や建築時期の内訳も確認できます。

👉 詳しくはこちら: https://maprise.jp/ja/blog/housing-age-old-rate-heatmap/
📝 New Towns, Old Towns, Seen in Color — The “Old Housing Share” Layer, Commuter Suburbs and Tower-Condo Districts
Nagakute near Nagoya, Shingu between Fukuoka and Kitakyushu, Tokyo's bay area: places where housing suddenly…
https://maprise.jp/en/blog/housing-age-old-rate-heatmap/ #oldhousingshare #housingage
🆕 New on the MAPRISE blog.

《New Towns, Old Towns, Seen in Color — The “Old Housing Share” Layer, Commuter Suburbs and Tower-Condo Districts》

Nagakute near Nagoya, Shingu between Fukuoka and Kitakyushu, Tokyo's bay area: places where housing suddenly turned over show up as pale patches on the map. We compared towns with mostly new housing and towns with mostly old housing using MAPRISE's new “Old Housing Share” layer (the share of homes built in 1980 or earlier). Click a municipality to see housing counts and a breakdown by construction period.

👉 Read the full post: https://maprise.jp/en/blog/housing-age-old-rate-heatmap/

#oldhousingshare #housingage #oldseismiccode #commutertowns #towercondominiums
Related posts
- A Seawall That Still Protects Us 170 Years Later: Hamaguchi Goryo, the Hirokawa Embankment, and the 10 Metres to Hiro Hachiman Shrine2026-11-15
- Were There Warning Signs Before the Aichi Intensity 5+ Earthquake of Nov. 8? Checking 30 Days of Seismicity with MAPRISE's Earthquake Layer2026-11-10
- Are Bear Sightings Caused by Megasolar? We Overlaid Sighting Points, Municipal Heatmaps, National Forests and Solar Plants to Find Out2026-11-07