You inherit your parents' house in the countryside, but demolishing it costs money and finding a buyer is hard. With the population shrinking, vacant homes keep increasing across Japan. MAPRISE now has a vacancy-rate heatmap based on the 2023 Housing and Land Survey: by prefecture when zoomed out, and by municipality when zoomed in.
Hello from the MAPRISE team.
You inherit your parents' house in the countryside, but demolishing it costs money, finding a buyer is hard, and inheritance procedures turn out to be more work than expected. Vacant homes are no longer someone else's problem; they are a social problem. With the population declining, they keep increasing across the country.
So we added a vacancy-rate heatmap to MAPRISE. Based on official statistics, it color-codes the vacancy rate by prefecture and by municipality.
Key points
- Based on the 2023 Housing and Land Survey (as of 1 October 2023) by the Statistics Bureau of Japan. The national vacancy rate is 13.8%.
- Zoomed out (below zoom 7) it is shown by prefecture; zoomed in, by municipality.
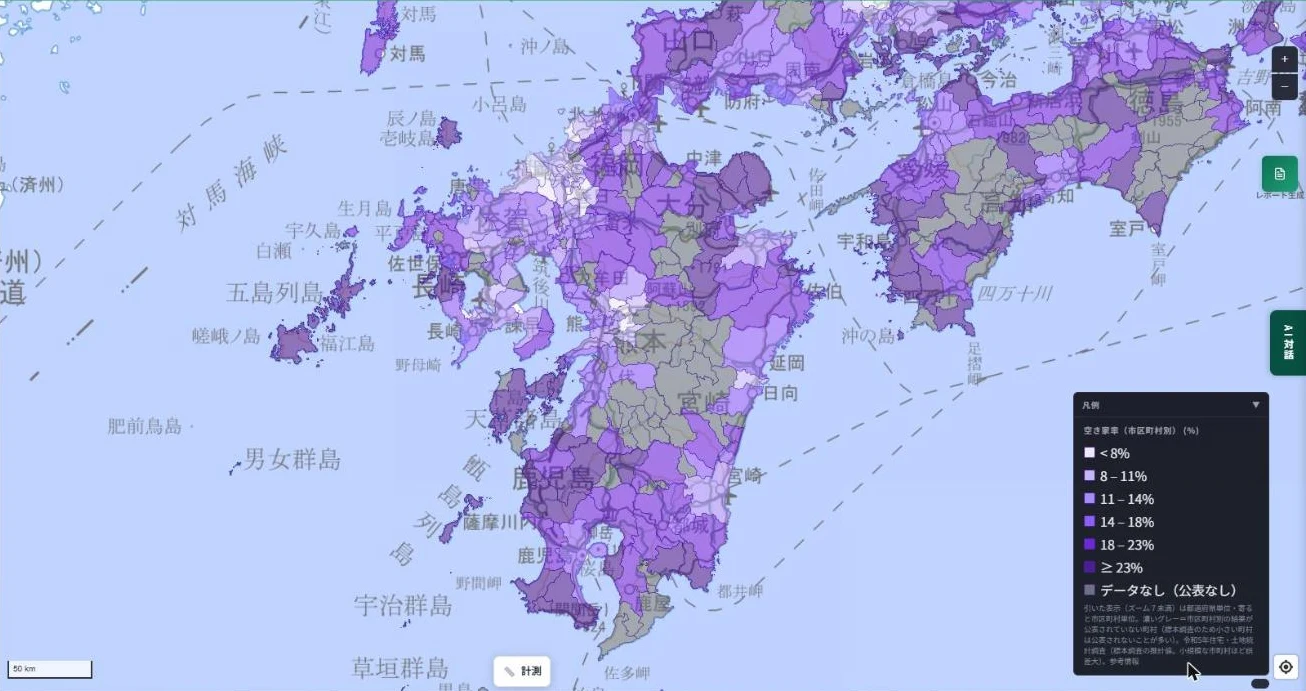
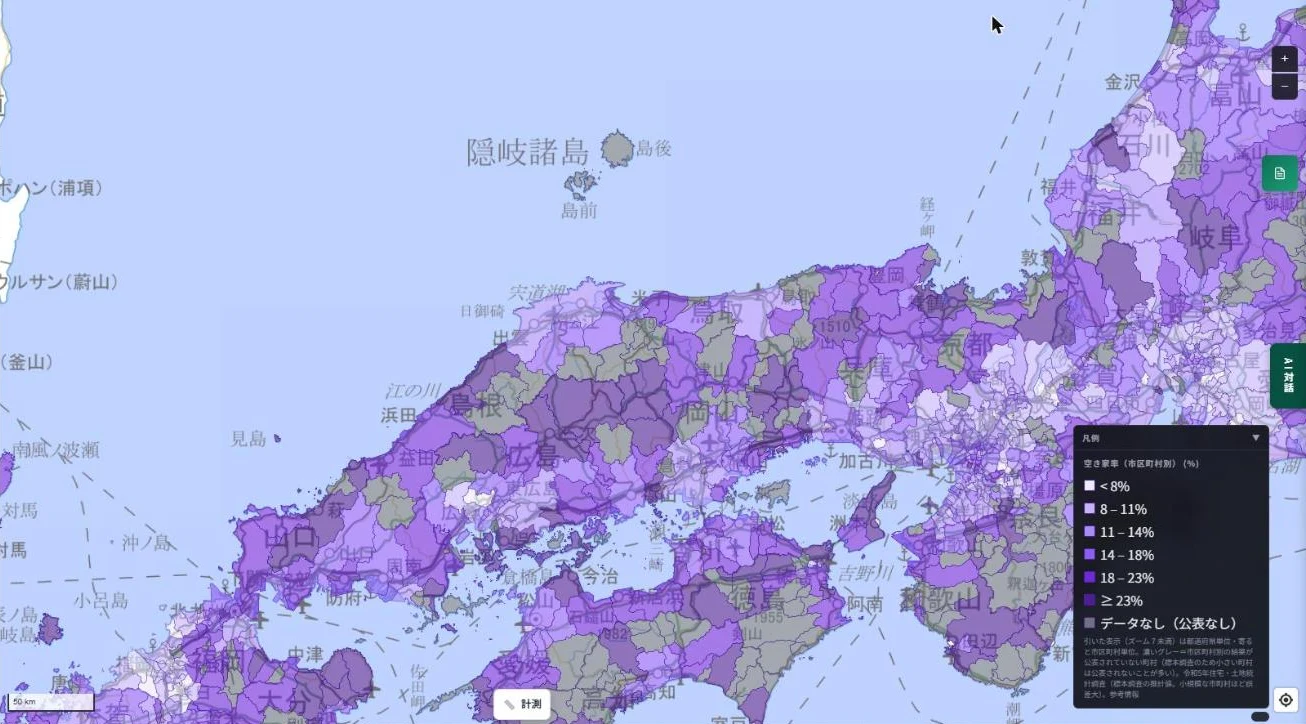
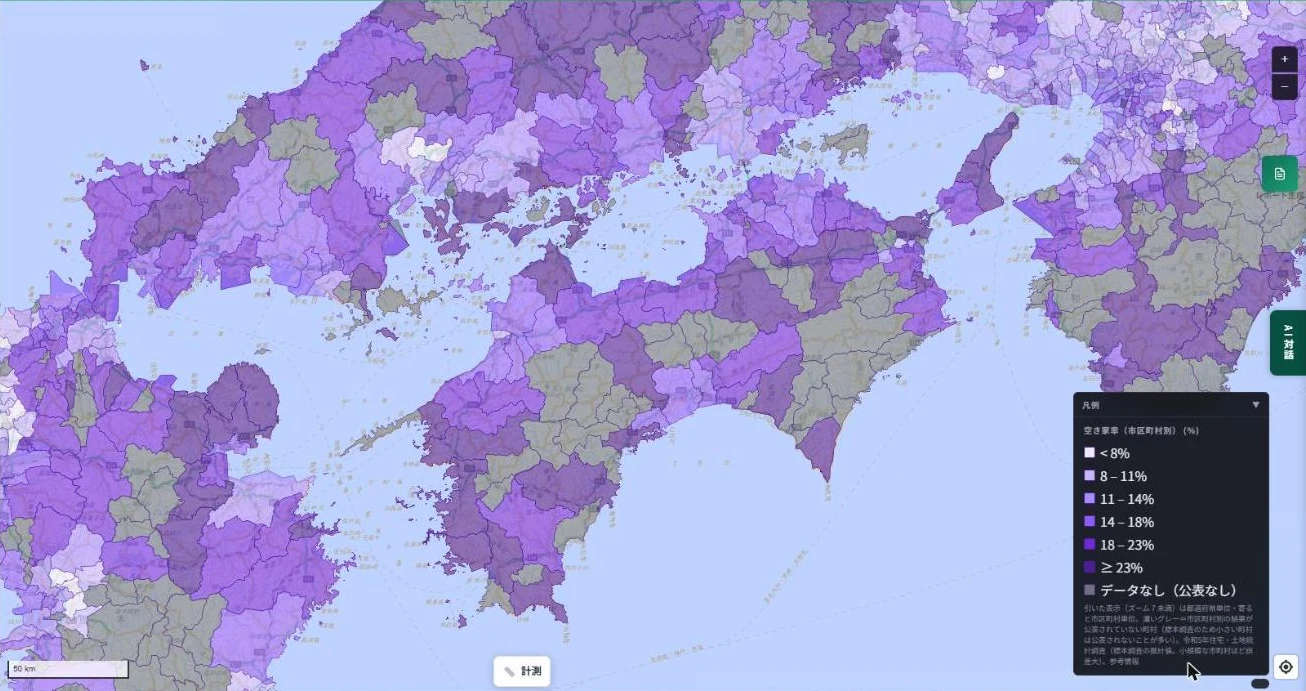
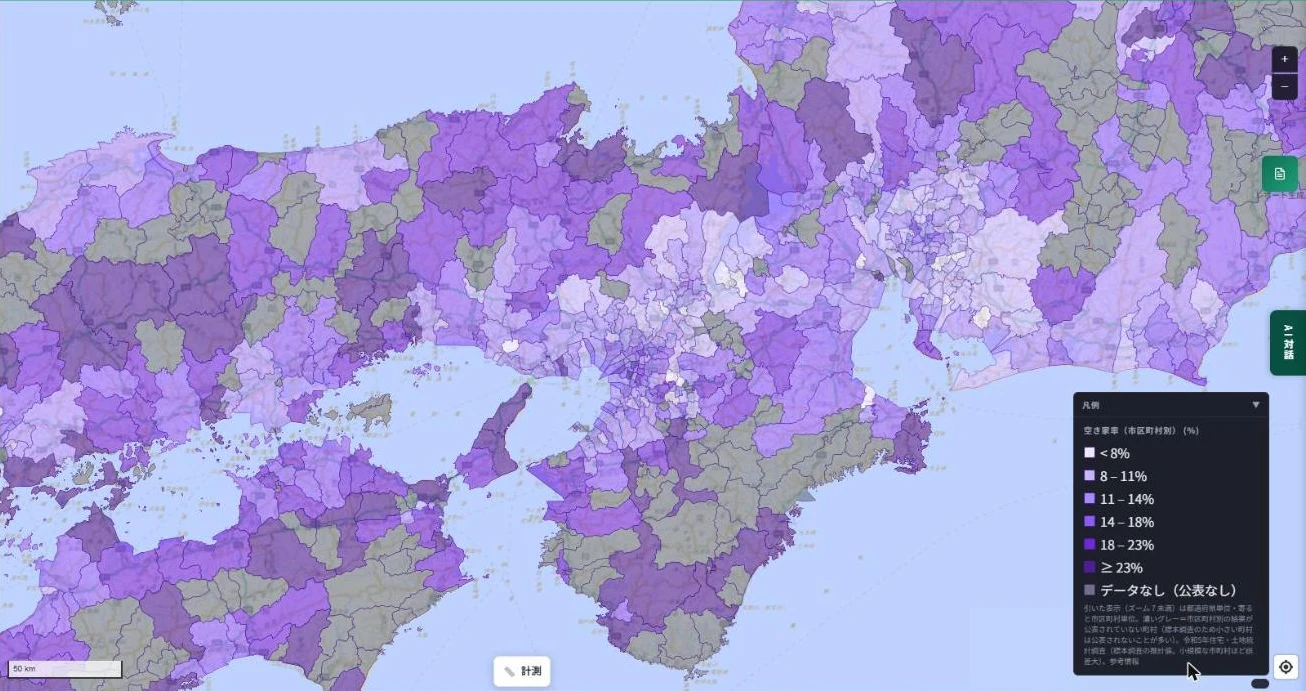
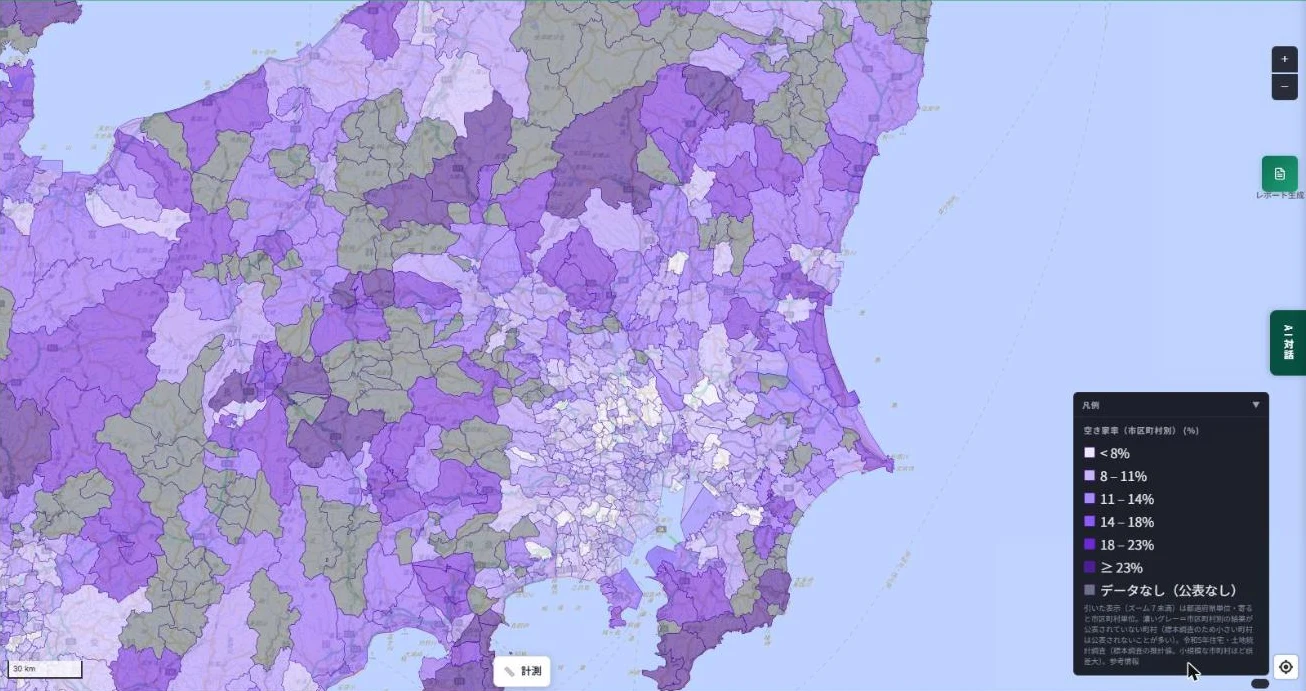
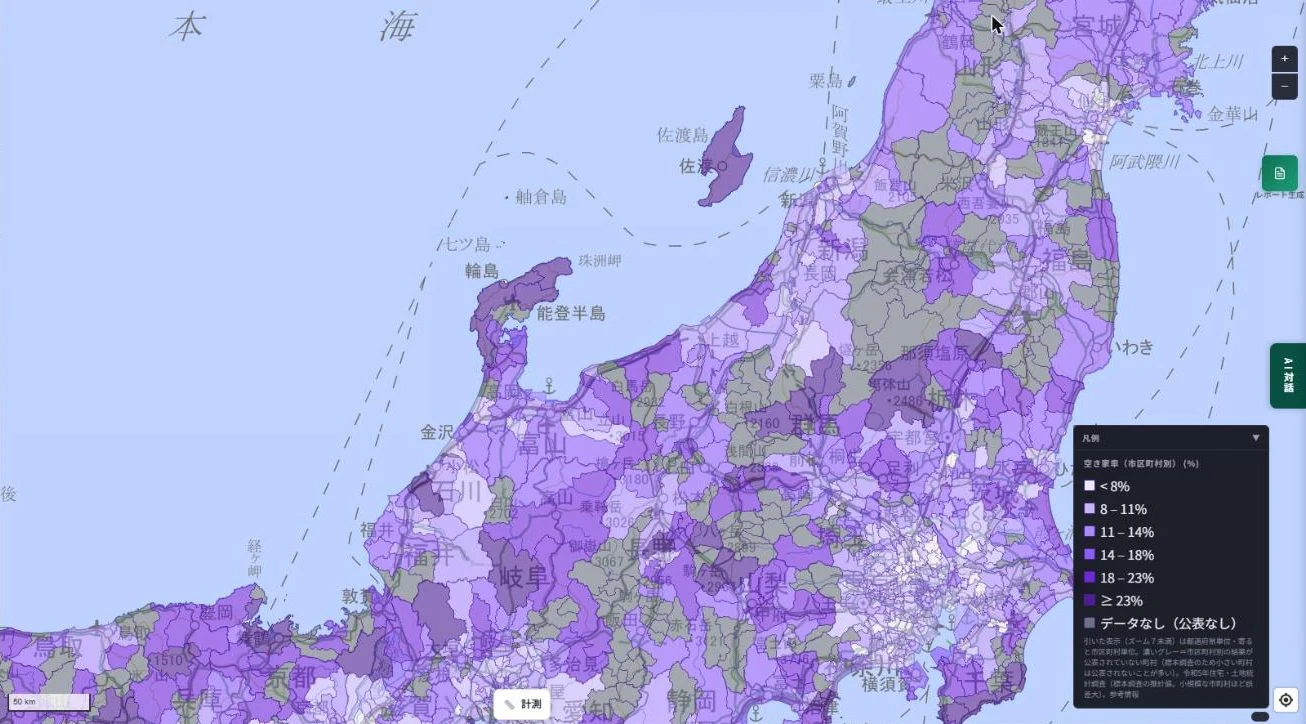
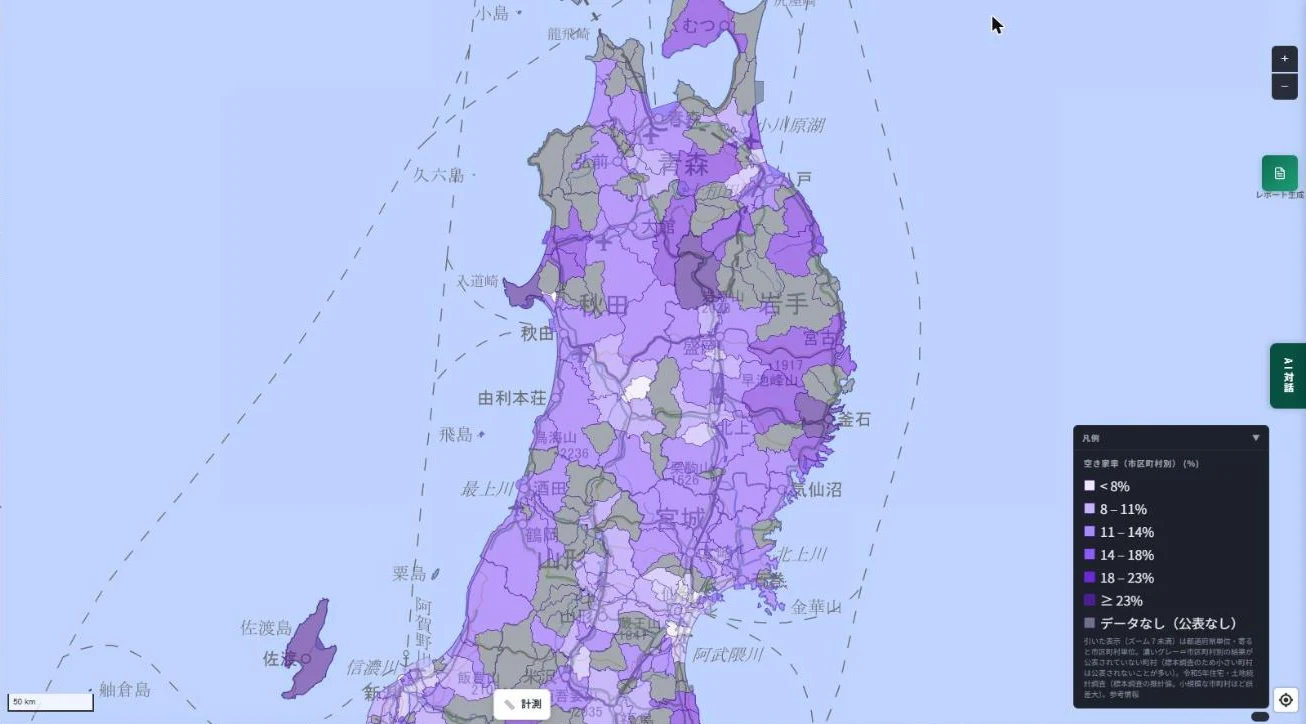
- About 680 towns and villages for which no municipality-level result was published are shown in grey (no data).
- It does not show the location of individual vacant houses.
1. Why are vacant homes increasing?
- Population decline: fewer residents mean more unused homes.
- Inheritance: many heirs already live elsewhere.
- Demolition costs: tearing down an old house takes real money.
- Hard to sell: depending on the location, buyers are scarce.
Many vacant homes, with some work, can still be lived in. We believe they should be put to better use, for municipalities, owners, and people looking for a home alike.
2. A nationwide map
Zoomed out: by prefecture
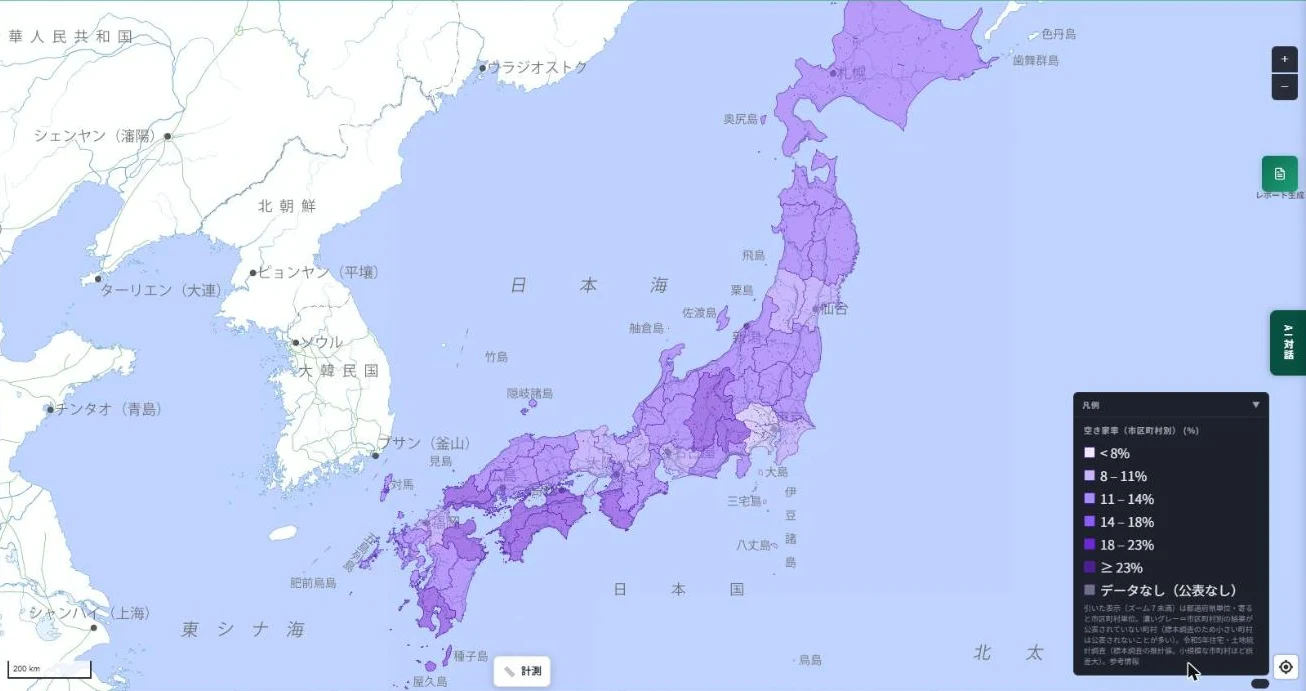
Zoomed in: by municipality
Click a municipality to see the number of vacant and total dwellings and a breakdown (for rent, for sale, second homes, other). Designated cities are shown by ward.
3. Regional views
Kyushu, Chugoku, Shikoku, Kansai, Kanto, Hokushinetsu, Tohoku, and Hokkaido.
Kyushu
Chugoku
Shikoku
Kansai
Kanto
Hokushinetsu
Tohoku
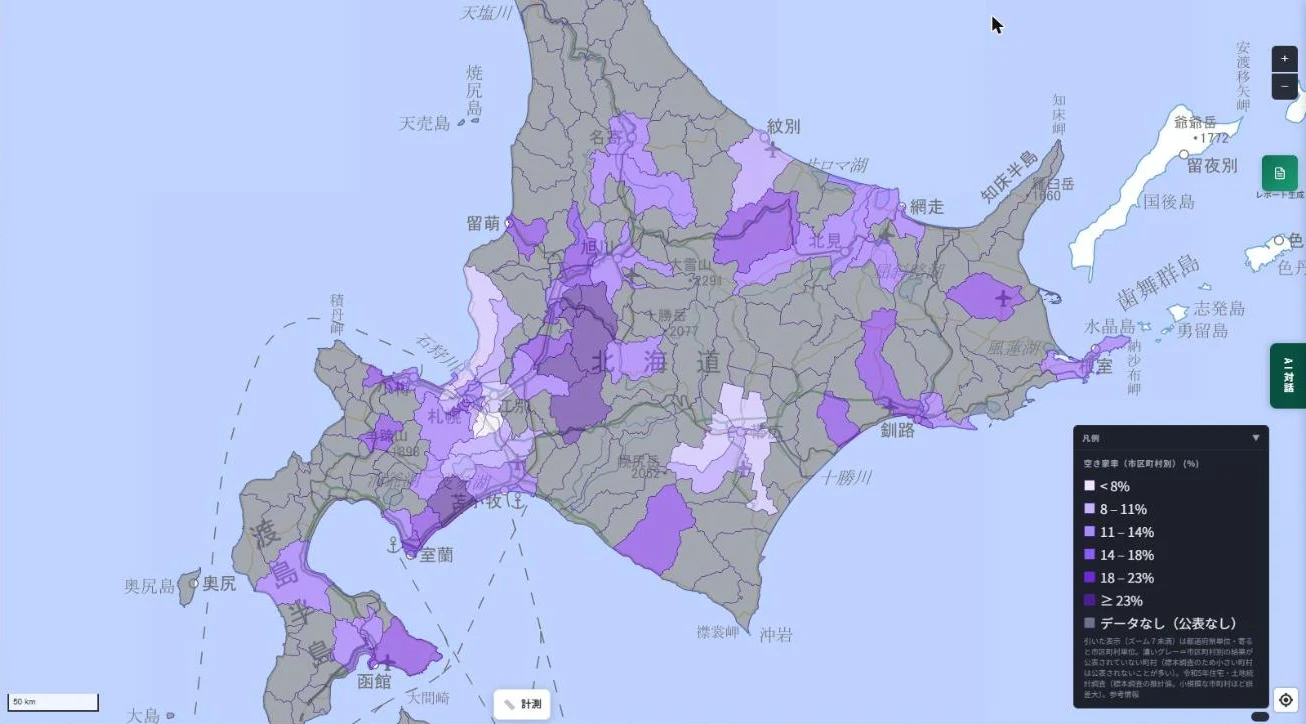
Hokkaido
Most towns and villages in Hokkaido are grey (no data) because no municipality-level result was published for them.
4. Notes
- The survey is a sample survey conducted every five years, so smaller municipalities have larger errors.
- Grey (no data) municipalities show the prefecture-wide figure for reference when clicked; it is not the value of that municipality.
- Published dwelling counts are rounded, so breakdowns may not sum to the number of vacant dwellings.
- The vacancy rate is calculated by us as vacant dwellings divided by total dwellings.
- For reference only; not a basis for legal procedures, valuation or transactions.
5. Publishing carefully
Vacant homes should be used. But publishing them indiscriminately worries many owners, who fear squatters. That is why we start by visualizing regional trends, not individual buildings.
6. What's next
Some people have ancestral land; some want a better place to live; some value their local community. MAPRISE will handle this data over time and make changes visible.
7. Layer used
- "Vacant Housing Rate (by municipality)" (Living group), available on the Starter plan and above.
Source
- Statistics Bureau of Japan, 2023 Housing and Land Survey, Basic Tabulation on Housing and Households (e-Stat; Government of Japan Standard Terms of Use v2.0)
Tags: #vacant homes #vacancy rate #population decline #inheritance #heatmap #Housing and Land Survey #municipality #prefecture
Other-language share text (exception cases)
Quick share above follows our platform-locked language policy (X-family in Japanese, LinkedIn in English). The four panes below let you grab the opposite-language body when needed — e.g. introducing an English post to a Japanese audience on X, or posting a Japanese article to LinkedIn in Japanese. Each pane offers both a copy button and a direct intent link.
📝 空き家は、もう社会問題 ― 全国の空き家率を、都道府県別・市区町村別のヒートマップにしました
親から引き継いだ田舎の家は、壊すにもお金がかかり、売ろうにも買い手がつかない。人口減少が進むなか、空き家は各地で増え続けています。MAPRISEに、総務省統計局の住宅・土地統計調査(令和5年)をもとにした「空き家率」のヒートマップを追加しました。広域では都道府県ごと、ズームすると市区町村ごとに、空き家率を色分けで確かめられます。
https://maprise.jp/ja/blog/housing-vacancy-rate-heatmap/ #空き家 #空き家率
🆕 新しいブログ記事を公開しました。

《空き家は、もう社会問題 ― 全国の空き家率を、都道府県別・市区町村別のヒートマップにしました》

親から引き継いだ田舎の家は、壊すにもお金がかかり、売ろうにも買い手がつかない。人口減少が進むなか、空き家は各地で増え続けています。MAPRISEに、総務省統計局の住宅・土地統計調査(令和5年)をもとにした「空き家率」のヒートマップを追加しました。広域では都道府県ごと、ズームすると市区町村ごとに、空き家率を色分けで確かめられます。

👉 詳しくはこちら: https://maprise.jp/ja/blog/housing-vacancy-rate-heatmap/
📝 Vacant Homes Are Now a Social Problem — We Mapped Japan's Vacancy Rate by Prefecture and Municipality
You inherit your parents' house in the countryside, but demolishing it costs money and finding a buyer is hard. With the …
https://maprise.jp/en/blog/housing-vacancy-rate-heatmap/ #vacanthomes #vacancyrate
🆕 New on the MAPRISE blog.

《Vacant Homes Are Now a Social Problem — We Mapped Japan's Vacancy Rate by Prefecture and Municipality》

You inherit your parents' house in the countryside, but demolishing it costs money and finding a buyer is hard. With the population shrinking, vacant homes keep increasing across Japan. MAPRISE now has a vacancy-rate heatmap based on the 2023 Housing and Land Survey: by prefecture when zoomed out, and by municipality when zoomed in.

👉 Read the full post: https://maprise.jp/en/blog/housing-vacancy-rate-heatmap/

#vacanthomes #vacancyrate #populationdecline #inheritance #heatmap
Related posts
- A Map of Water Utilities Is Now Live — Find Out Whom to Contact Before You Move or Build2026-11-01
- Where Do Airplanes Actually Fly? Haneda, Narita, Kansai, Itami and Fukuoka on the Aircraft Overflight Layer2026-10-21
- How Do Airports on the Sea Look on a Map? Kansai and Centrair on the Aircraft Overflight Layer2026-10-21