A new JR station and a skyline of residential towers made Musashi-Kosugi one of the most talked-about districts in Greater Tokyo. In 2019 a typhoon brought flooding that made the news. We lay elevation maps, landform classes, a late-1940s aerial photo and the national flood inundation assumptions side by side to explain how the land was formed and how the location looks now that countermeasures are in place.
Hello from the MAPRISE development team.
In 2010 a new Yokosuka Line station opened, residential towers rose one after another around it, and the district became a standard answer to "where would you most like to live?" It is Musashi-Kosugi, in Nakahara Ward, Kawasaki City. Then, in October 2019, flooding around the station during Typhoon Hagibis (Typhoon No. 19) was in the news day after day.
Almost seven years have passed. In this post we lay out the GSI (Geospatial Information Authority of Japan) elevation data that MAPRISE uses, together with other public data, and ask four questions: what kind of land is this?, what caused the flooding at the time?, how far have the countermeasures gone?, and how should we read it today as a real estate location? We rely on public documents and numbers, not on impressions or rumor.
Three conclusions first
- The station sits at about 7 m above sea level. Most of the land within 1 km is flat low ground at 6 to 9 m. The station itself is not unusually low; the whole district lies on a broad plain built by the Tama River. About 3 km away, the Hiyoshi upland stands at roughly 24 m, so very different heights are close together along the same railway line.
- The 2019 flooding was not a levee breach. Kawasaki City's review concluded that the river rose, and river water flowed back up through stormwater "drainage sluices" (haisui himon) and the sewer system. The city has since improved sluice gates, installed water-level gauges, introduced remote control and pump trucks, and built a bypass pipe.
- In the national flood inundation assumptions (maximum scale), most of the station area falls in the "0.5 to 3 m" class. The realistic way to see it is as a location where you know the numbers and prepare accordingly: where equipment sits and how evacuation works matter as much as the address.
The history of the land: from post town to factories to station front
Let us go back in time first.
| Period | What happened |
|---|---|
| Edo period | A post town on the Nakahara Kaido road (linking Edo and Sagami). The place name "Kosugi-Gotenmachi" comes from a temporary lodge (Kosugi Goten) built by Tokugawa Hidetada, according to a City of Kawasaki document |
| 1926 | Tokyu Toyoko Line (then Tokyo Yokohama Electric Railway) opens between Maruko-Tamagawa and Kanagawa |
| 1927 | Nambu Railway opens "Ground-mae" stop, named for a Yokohama Specie Bank sports ground near the station |
| Late 1930s | Factories, mainly electrical and electronic, arrive in numbers; Tokyu opens "Kogyo-toshi" station in 1939 |
| 1944-1953 | The Nambu line is nationalized and the stop becomes "Musashi-Kosugi Station"; in 1953 the station moves to a point between it and Kogyo-toshi, and the two merge |
| 1980 | The Shinagawa-Tsurumi freight line (today's Yokosuka Line tracks) starts carrying passengers |
| 2009 | Park City Musashi-Kosugi is completed on the former Yokohama Specie Bank ground |
| 2010 | The Yokosuka Line station opens (March 13) |
| 2013-2014 | Large commercial facilities open one after another by the station |
| 2019 | Through service with the Sotetsu Line begins (November 30) |
The next figure shows an aerial photograph taken by US forces in the late 1940s (left) beside a current photograph (right). The red ring is the present position of Musashi-Kosugi Station.
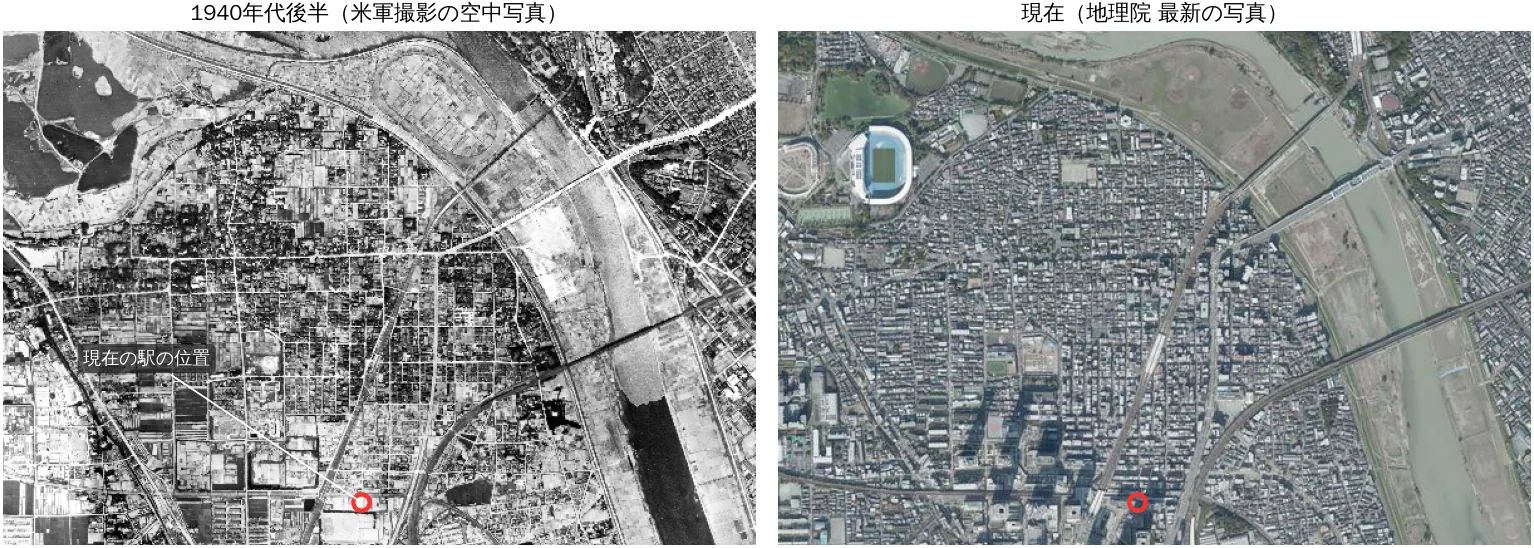
In the old photograph, orderly, field-like parcels spread west of the station. An old settlement fills the area to the north, with large buildings that look like factories scattered about. The Tama River's gravel bed looks far wider than today. The district was originally flat land beside a river, with farmland, a road-side town, and later factories.
From 2009 onward, former factory and corporate sports-ground sites became housing and commercial facilities. Tokyu recorded about 210,000 passengers a day in fiscal 2025 (Toyoko and Meguro lines combined), and JR East about 110,000 boardings a day in fiscal 2024. It has grown into a major transport hub (figures as listed on the station's reference page).
Elevation: the station is about 7 m, about 17 m below the Hiyoshi upland
Now elevation. From GSI's 5 m mesh elevation (DEM5A) we drew a map close to MAPRISE's colored contour map, with contours every 1 m from 2 to 30 m. Blue is low, brown is high.
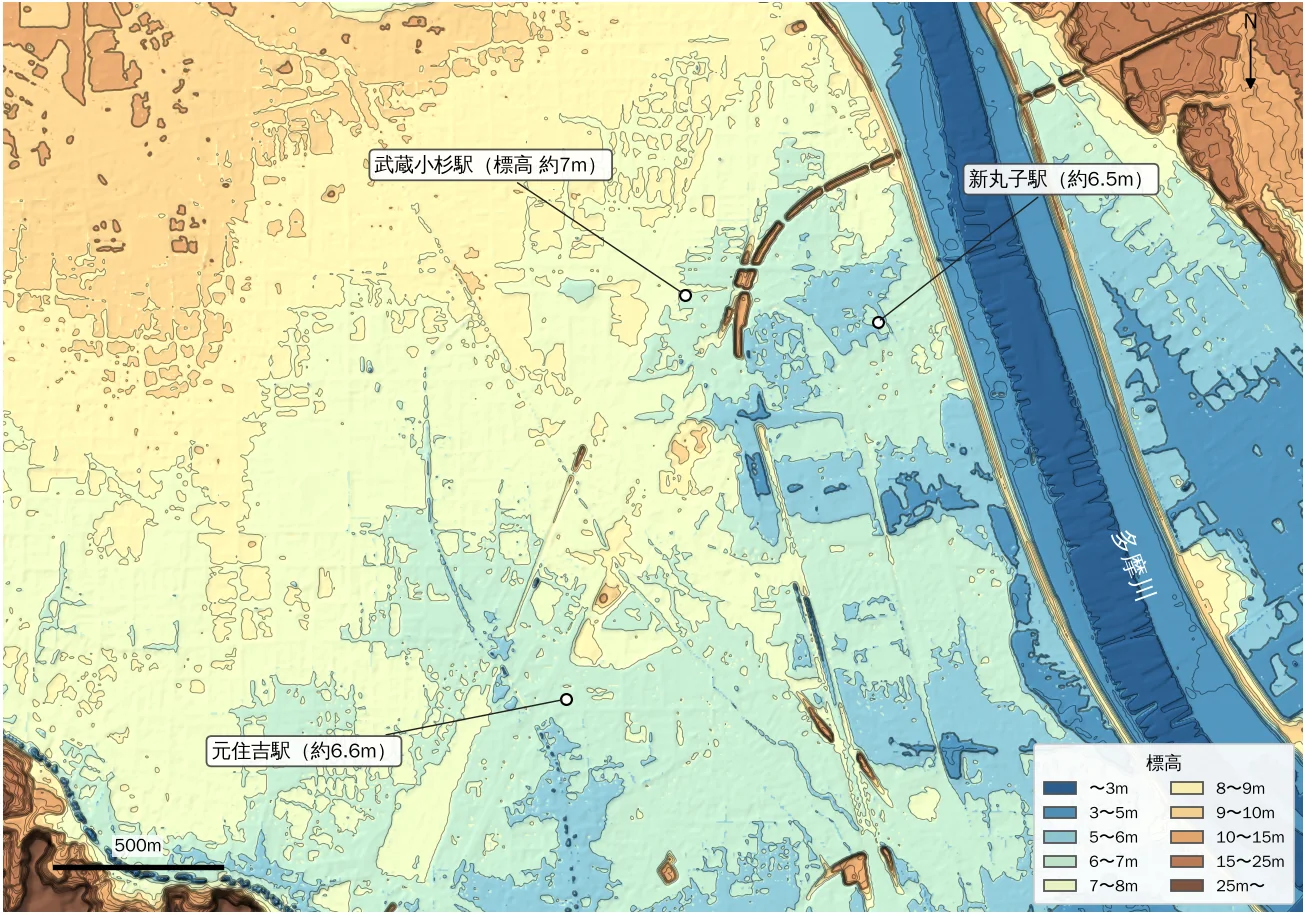
The map shows the following.
- Around the station the ground is pale yellow-green to light blue (6 to 8 m) and nearly flat.
- Northwest of the station (toward Kosugi-Gotenmachi) there is a slightly higher band (8 to 10 m).
- Approaching the Tama River, a blue band at 3 to 5 m and below appears; outside the levee is the river bed.
- In the lower-left corner (Hiyoshi) the ground climbs onto an upland and turns brown, meaning high.
The next figure is a cross-section measured along a polyline from Hiyoshi Station through Motosumiyoshi, Musashi-Kosugi and Shinmaruko to the Tama River.
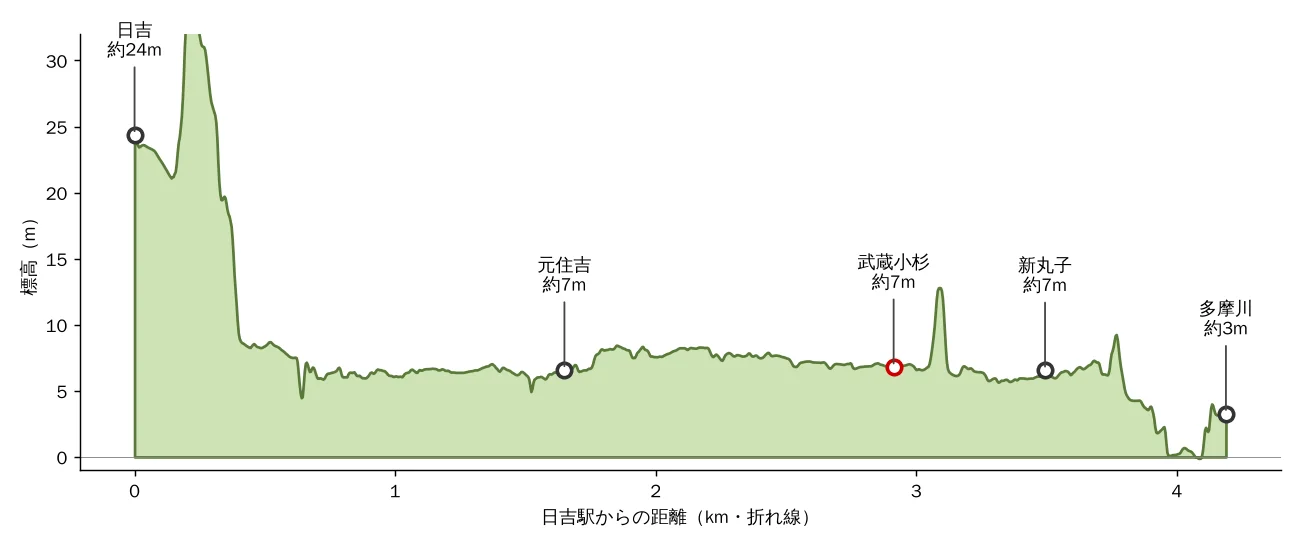
| Place | Elevation (approx.) | Note |
|---|---|---|
| Near Hiyoshi Station | 24 m | On the upland |
| Motosumiyoshi Station | 6.6 m | Flat low ground |
| Musashi-Kosugi Station | 6.9 m | Mean of the 5 m cells around the station |
| Shinmaruko Station | 6.5 m | |
| Kosugi-Gotenmachi | 8.7 m | Slightly higher band along the old road |
| Tama River levee crest | about 9 m | Value along this section |
| Tama River bed (near water) | about 0 to 3 m | Water surface is not in the elevation data, so this is the river bed |
Summarizing the area around the station:
- Within 500 m, elevation is 6.0 to 8.1 m (10th to 90th percentile), with a median of 7.3 m.
- Within 1 km, it is 5.7 to 8.6 m, with a median of 7.5 m.
- Within 1 km, about 30% of the land is lower than the station. The station sits close to the median of its surroundings.
In other words, Musashi-Kosugi Station is not an outlier standing in an unusually low spot. A more accurate picture is that the whole flat lowland around the station is the Tama River's floodplain.
How the land formed: the road-side "micro-highs" and the station's position
We overlaid landform classes from GSI's Land Condition Map (Digital Map 25000). Yellow is "micro-high ground along rivers (natural levees and similar)", and orange is "upland".
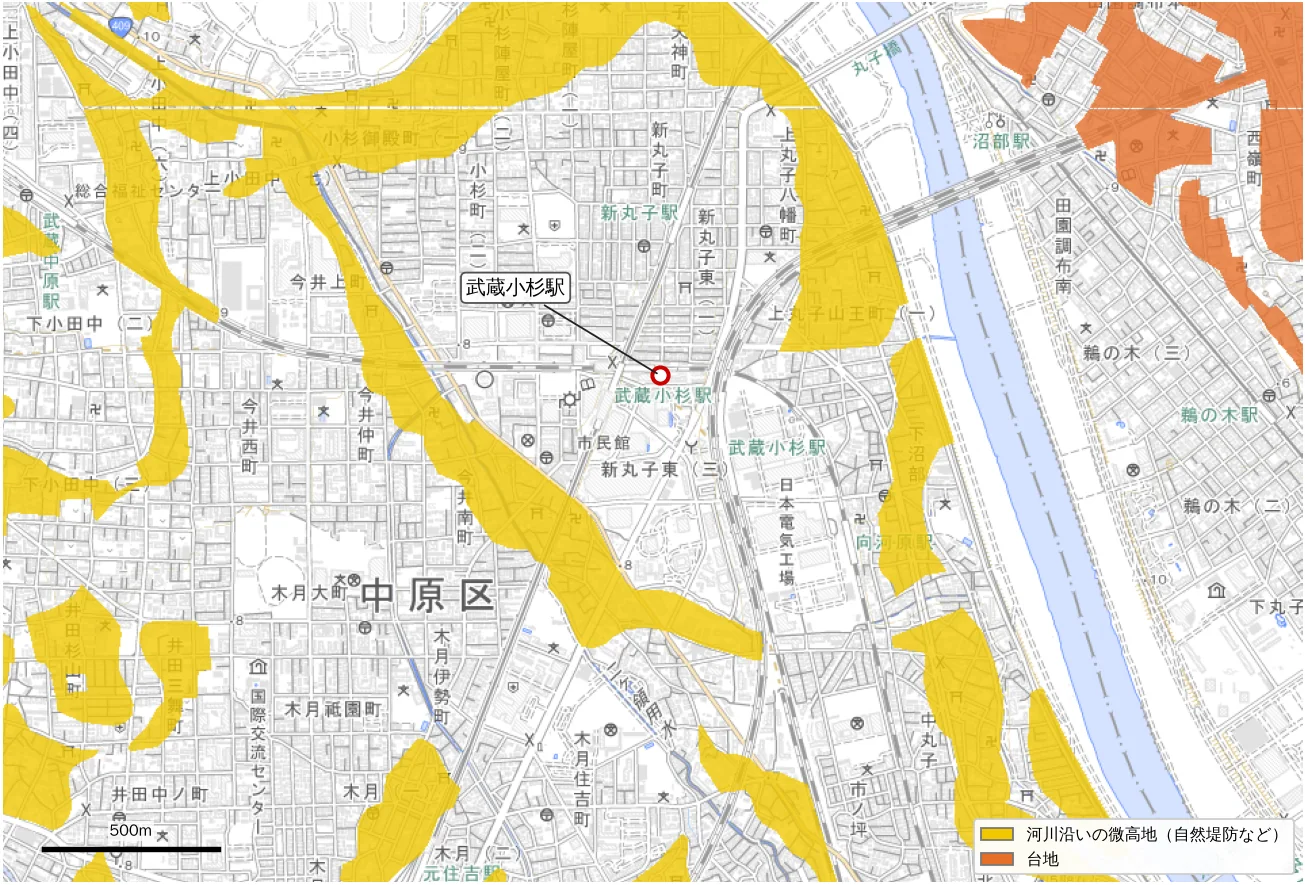
The yellow band is a micro-high ridge running northwest to southeast from Kosugi-Gotenmachi toward Imai and Kizuki. It was probably formed by a former river flow and stands a little higher than its surroundings. The Nakahara Kaido runs along this ridge. People of the time likely laid out the road, and built the post town, along the higher ground that floods less.
Musashi-Kosugi Station is just east of this micro-high, on its slightly lower side. Redevelopment went onto large vacant factory and sports-ground sites, so a big new district came to stand on land a little lower than the ridge.
Some press reports describe Musashi-Kosugi as lying on a former Tama River channel. Which band counts as a former channel may differ by source. This post stays within what the national Land Condition Map shows (micro-highs and uplands) and does not assert that any part is a former channel.
What happened in Typhoon Hagibis in 2019?
From October 12 to 13, 2019, Typhoon Hagibis (Typhoon No. 19) crossed the Kanto region. At the Den-en-chofu (upstream) gauge and others, the Tama River recorded its highest level on record, above the design high-water level. Around Musashi-Kosugi Station there was flooding, and at some residential towers, basement electrical equipment was submerged, causing power and water outages.
Kawasaki City Waterworks and Sewerage Bureau's review (April 8, 2020) summarizes the event as follows.
- The flooding was not caused by a levee breach or by water overflowing the levee.
- As the Tama River rose, river water flowed back up through the drainage sluices that normally carry stormwater to the river, and through the sewer system. Rainwater that could no longer drain to the river (internal water) also overflowed.
- At the Sanno drainage sluice, backflow continued from a little after 14:00 on October 12 until about 3:40 on October 13. More than 70% of the flood water is said to have been backflow from the Tama River.
- A calculation also shows that closing the gate at 15:00 on October 12 would have kept the damage to a very small area. The review also notes that, under the forecast rain, closing the gate would have kept the rain falling on the town from draining, so the decision was difficult.
So it was not that "the river overflowed"; the river's high water blocked the outlet that normally carries rain to the river. The same structure exists in other low areas along the Tama River.
How far have countermeasures gone?
Kawasaki City has carried out the following.
| When | Countermeasure |
|---|---|
| By July 2020 | Improved drainage sluice gates, installed gauges and other observation equipment, revised operating procedures, introduced remote control and pump trucks (short-term measures) |
| August 2023 | Completed a bypass pipe and backflow prevention valve near the Sanno sluice to send rainwater to another trunk sewer |
| Ongoing | Drills for gate operation and pump-truck drainage |
| Medium to long term | Policy of building sewer facilities that reduce flooding even when gates are closed |
The city calculated the effect of these measures under the same rainfall and Tama River level as the 2019 typhoon (materials for the Kawasaki City Council's Environment Committee, November 2024). For the area around the Sanno drainage sluice:
| Around the Sanno drainage sluice | Equivalent to above-floor flooding (depth 50 cm or more) | Equivalent to below-floor flooding |
|---|---|---|
| Before measures (typhoon day) | about 151,000 sq m | about 159,000 sq m |
| After measures (calculated) | 0 sq m | 0 sq m |
In this calculation, under the same conditions as Typhoon Hagibis, flooding is prevented. For the other four sluices (Miyauchi, Suwa, Futako, Unane), the above-floor-equivalent area is calculated to fall by 44 to 94%. These are of course results under the same conditions; rain and river levels beyond them still call for preparation.
That is the extent of what public documents say about progress in countermeasures. Sources are listed at the end.
The current inundation assumptions: most of the station area is in the "0.5 to 3 m" class
Next, how deep water is assumed to become in the future. We overlaid the Ministry of Land, Infrastructure, Transport and Tourism's flood inundation assumptions (maximum scale) on the map. For the Tama River they are calculated for a levee failure under the maximum conceivable rainfall (588 mm total over two days), a rare event of roughly once in a thousand years.
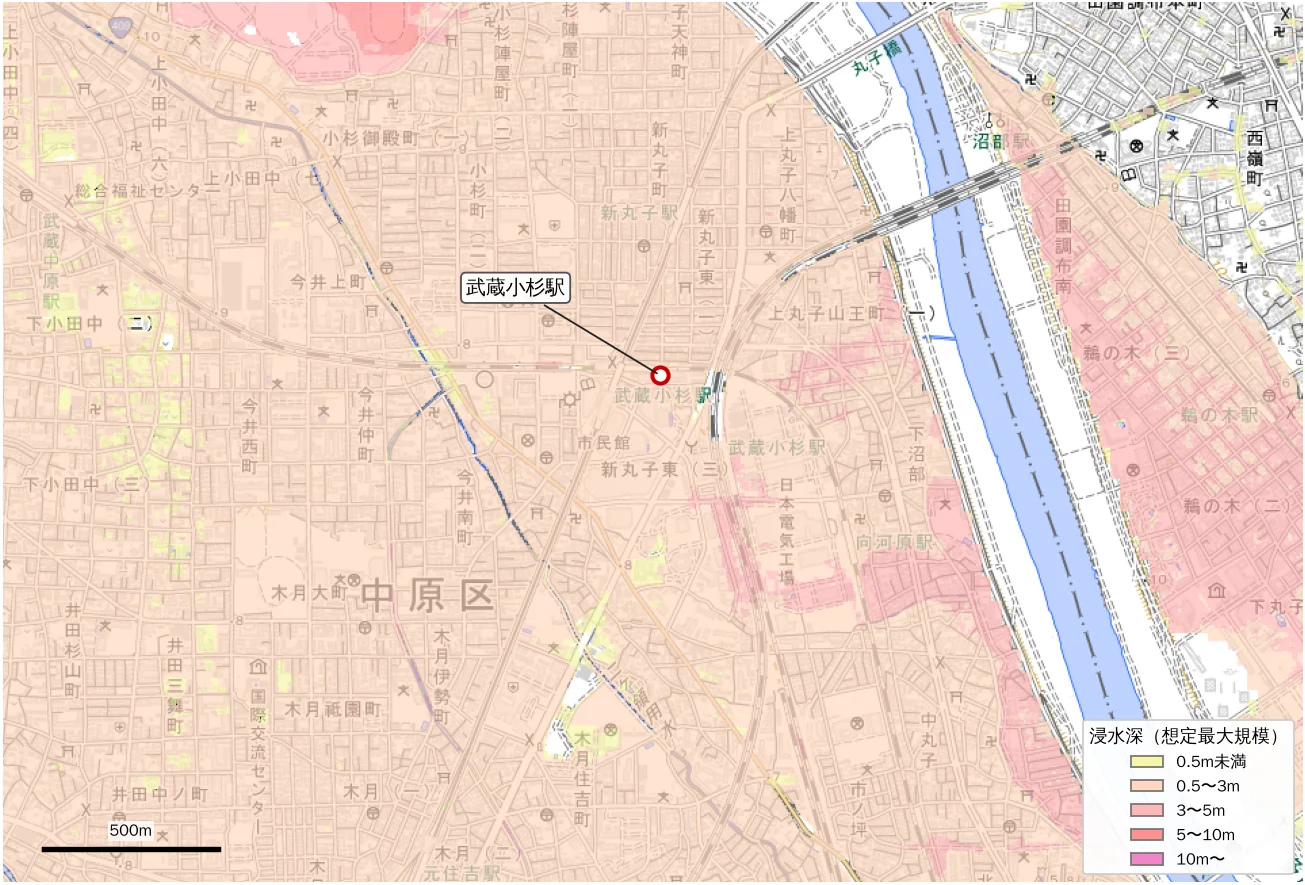
Tallying the national data, about 95% of the land within 500 m of the station is in the "0.5 to 3 m" class, and about 4% in the 3 to 5 m class. Assumed depth increases closer to the Tama River.
Two points need saying here.
- The maximum scale presumes a rare, worst-class case. It does not express the probability that applies to everyday life.
- At the same time, it is a fact that the station area is in the "0.5 to 3 m" class. Which floor you choose, where electrical equipment and machine rooms are, and the evacuation route bear directly on real safety.
Note also that, following a revision of the enforcement regulations of the Real Estate Brokerage Act, since August 28, 2020, explaining the location of the property on the flood hazard map has been mandatory in the important-matters explanation (flood, stormwater and storm surge). When showing Musashi-Kosugi properties, checking Kawasaki City's hazard maps (flood and stormwater) together with the client is the baseline.
Re-assessing the location
We split what we have into strengths and points that need preparation.
| Viewpoint | Strengths | Points needing preparation |
|---|---|---|
| Transport and urban functions | A hub where two Tokyu lines and JR lines (Nambu, Yokosuka and others) meet, with direct service toward Shibuya, Yokohama, Shinagawa and Tokyo. Commercial facilities cluster at the station | - |
| Elevation and landform | The station area is at about 7 m and nearly flat. About 3 km from the station is the Hiyoshi upland (about 24 m). A micro-high ridge is nearby | Low floodplain of the Tama River, close to the river |
| River flooding | A nationally managed first-class river with continuously built levees | In the maximum-scale assumption, most of the area is in the 0.5 to 3 m class. Treat it as an assumption, and check evacuation and floor choice |
| Stormwater and backflow | The city has improved gates, installed gauges, pump trucks and a bypass pipe. Under the 2019 typhoon's conditions, the calculation shows flooding prevented around Sanno | Rain or river levels beyond the assumptions call for preparation. The location of building equipment also matters |
| Land-use history | Former factory and sports-ground sites redeveloped at scale as planned districts | Check ground conditions in each property's survey documents |
Overall, we see Musashi-Kosugi as a location that combines strong transport and urban functions with the water-related preparation typical of the Tama River lowland. Avoiding it by looking only at the weaknesses, or forgetting preparation by looking only at the strengths, are both unwise. Knowing the numbers and choosing your preparations is the right way to engage.
In property proposals, checks like these help:
- Floor level of electrical equipment, machine rooms and parking (basement or upper floor; are there flood barriers or watertight doors)
- The owners' association's or management company's flood preparation (evacuation plans, emergency power, stockpiles)
- The unit's floor in relation to the assumed inundation depth
- Both the hazard maps (flood and stormwater) and actual elevation
Viewing it in MAPRISE
MAPRISE lets you overlay the same kinds of data as in these figures on one map.
- Switch the contour interval of the "colored contour map" background to check height differences around the station.
- Overlay the national assumptions with the "flood and tsunami inundation assumptions" layer.
- Check present conditions with the aerial photograph background.
Viewing elevation, landform and assumed water depth side by side for each property deepens your understanding of the location.
About the data in this article
- The figures were drawn by us from the same kinds of GSI data that MAPRISE uses (elevation tiles, pale map, Land Condition Map, aerial photographs) and the MLIT's flood inundation assumptions (maximum scale). They are not MAPRISE screenshots.
- Elevation comes from GSI's 5 m mesh (DEM5A) and contains error. The station position is approximate as read on the figure. Elevation is ground height without buildings or fill, and does not guarantee the actual ground level or the height of equipment.
- The flood inundation assumptions are for the maximum scale (a rare rainfall). The percentage tallies follow the color scheme of GSI's hazard map portal and do not predict actual damage. For the latest official information, check Kawasaki City's hazard maps (flood and stormwater).
- The causes of the 2019 flooding and the countermeasures follow Kawasaki City documents and the published review. For depth and extent figures from the Typhoon Hagibis review, see the city's report itself. The effect figures are the city's calculations under the same conditions.
- The aerial photograph was taken by US forces around 1945 to 1950 (GSI). Appearance varies with shooting date and location.
- The history follows the references below. We do not assert how the micro-high ridge was formed (whether a former channel or not).
- The flood hazard map explanation duty covers flood, stormwater and storm surge. Treatment may differ by municipality.
Closing
Musashi-Kosugi has changed quickly, from post town to factory district to a district of residential towers. The character of the land, a Tama River lowland, has not changed. What matters is to understand it and to view the location together with the city's countermeasures and the building's own preparation.
MAPRISE will keep helping you check elevation, hazards and land history for each property quickly.
Questions and comments are welcome at info@maprise.jp.
Sources and references
- Kawasaki City Waterworks and Sewerage Bureau, "Future flood countermeasures around drainage sluices (Sanno drainage sluice area)" (Environment Committee materials, November 21, 2024): https://www.city.kawasaki.jp/800/cmsfiles/contents/0000188/188228/sannnou.pdf
- Kawasaki City Waterworks and Sewerage Bureau, "Review of flooding around drainage sluices in Typhoon Hagibis" (April 8, 2020), summarized on the Park City Musashi-Kosugi Mid Sky Tower owners' association site: https://www.midskytower.com/security/p=7206
- Kawasaki City, "Future flood countermeasures around drainage sluices (Miyauchi drainage sluice area)" (November 21, 2024): https://www.city.kawasaki.jp/800/cmsfiles/contents/0000188/188228/miyauti.pdf
- Musashi-Kosugi Station (Japanese Wikipedia): https://ja.wikipedia.org/wiki/%E6%AD%A6%E8%94%B5%E5%B0%8F%E6%9D%89%E9%A7%85
- City of Kawasaki document (origin of the place name Kosugi-Gotenmachi): https://www.city.kawasaki.jp/500/cmsfiles/contents/0000008/8745/soan-dai2bu.pdf
- Kono Machi Archives: Musashi-Kosugi (Tokyu line area history): https://smtrc.jp/town-archives/city/musashikosugi/p03.html
- Ministry of Land, Infrastructure, Transport and Tourism, press release on making explanation of the property's location on the flood hazard map mandatory in real estate transactions: https://www.mlit.go.jp/report/press/totikensangyo16_hh_000205.html
- Gendai Business, article on Musashi-Kosugi flooding (press coverage of the landform): https://gendai.media/articles/-/158387
- Maps and data: elevation tiles (DEM5A), pale map, Land Condition Map and aerial photographs (Geospatial Information Authority of Japan); flood inundation assumptions, maximum scale (MLIT, Hazard Map Portal). These are processed and displayed in MAPRISE. Providers and licenses for each dataset are listed on the Data sources page, and the data you can see on the map is summarized in the Layer catalog.
Tags: #Musashi-Kosugi #Kawasaki #Tama River #elevation #colored contour map #flood inundation assumptions #hazard map #land history #stormwater #drainage sluice #location assessment
Other-language share text (exception cases)
Quick share above follows our platform-locked language policy (X-family in Japanese, LinkedIn in English). The four panes below let you grab the opposite-language body when needed — e.g. introducing an English post to a Japanese audience on X, or posting a Japanese article to LinkedIn in Japanese. Each pane offers both a copy button and a direct intent link.
📝 武蔵小杉の今昔と、ハザードの現在地 ― 標高図・地形・歴史から、立地をあらためて見つめ直す
横須賀線の新駅とタワーマンションで、いちばん注目された街のひとつ、武蔵小杉。2019年の台風では浸水もニュースになりました。標高図・陰影・地形分類・戦後すぐの空中写真・国の洪水浸水想定を並べて、この土地の成り立ちと、対策が進んだ今の立地を整理します。
https://maprise.jp/ja/blog/musashi-kosugi-history-and-hazard/ #武蔵小杉 #川崎市
🆕 新しいブログ記事を公開しました。

《武蔵小杉の今昔と、ハザードの現在地 ― 標高図・地形・歴史から、立地をあらためて見つめ直す》

横須賀線の新駅とタワーマンションで、いちばん注目された街のひとつ、武蔵小杉。2019年の台風では浸水もニュースになりました。標高図・陰影・地形分類・戦後すぐの空中写真・国の洪水浸水想定を並べて、この土地の成り立ちと、対策が進んだ今の立地を整理します。

👉 詳しくはこちら: https://maprise.jp/ja/blog/musashi-kosugi-history-and-hazard/
📝 Musashi-Kosugi, Then and Now, and Where Its Hazards Stand Today ― Re-reading the Location Through Elevation, Landform and History
A new JR station and a skyline of residential towers made Musashi-Kosugi one of the most talk…
https://maprise.jp/en/blog/musashi-kosugi-history-and-hazard/ #Musashi-Kosugi #Kawasaki
🆕 New on the MAPRISE blog.

《Musashi-Kosugi, Then and Now, and Where Its Hazards Stand Today ― Re-reading the Location Through Elevation, Landform and History》

A new JR station and a skyline of residential towers made Musashi-Kosugi one of the most talked-about districts in Greater Tokyo. In 2019 a typhoon brought flooding that made the news. We lay elevation maps, landform classes, a late-1940s aerial photo and the national flood inundation assumptions side by side to explain how the land was formed and how the location looks now that countermeasures are in place.

👉 Read the full post: https://maprise.jp/en/blog/musashi-kosugi-history-and-hazard/

#Musashi-Kosugi #Kawasaki #TamaRiver #elevation #coloredcontourmap
Related posts
- Who Looks After the Slope and Retaining Wall Beneath a Cliff-Top Property? ― The Zushi Accident, and Yellow Zones Across Japan on a Split-Screen Elevation Map2026-10-24
- Don't Choose a Cliff-Top Home on View and Elevation Alone: Retaining Walls, Disclosure Rules, Land Prices and Yellow Zones, City by City (Part 2)2026-10-25
- Did the Rich Move Uphill to Avoid Floods? Testing 'Yamanote vs Shitamachi' in Tokyo, Nagoya, Osaka and Fukuoka with Four Maps2026-10-24