We've released the Serious Crime (Tokyo, by town) layer, built from the annual recognized-case counts per town published by the Tokyo Metropolitan Police (2009–2025). Here's a mostly visual tour: switching years, filtering by crime type, a 17-year history on click, and a side-by-side view with our earlier crime map.
Hello from the MAPRISE team.
If you can, you'd like to live somewhere safe. Most of us feel that way. Yet "safe" and "unsafe" are usually matters of impression, and there have been few chances to check for ourselves when, in which town, and what kind of crime actually happens, and how often.
The Tokyo Metropolitan Police Department publishes the number of recognized crimes by town, crime type and year as open data. We've turned this data into a map layer, "Serious Crime (Tokyo, by town)", now available for Tokyo. What a table of numbers makes hard to see, namely where counts are high and when they rose or fell, becomes much clearer through the colors on the map and the history that appears when you click. In this post, we'll show it mostly with images.
About the data, honestly
- Area: Tokyo only.
- Unit: annual recognized-case counts per town (chome-level, such as "Kabukicho 1-chome").
- Period: 17 years, 2009–2025.
- Crime types: eight categories: robbery, homicide/arson etc., bodily injury, assault, threats/extortion etc., burglary (empty house), sneak-in/occupied-house burglary, and other burglary. It complements our existing "Crime Incidents" layer, which plots theft methods such as bicycle theft and theft from vehicles as points and does not include these crime types.
- Source: "Recognized cases by town, crime type and method" from the Tokyo Metropolitan Police Department (Tokyo Open Data, CC BY 4.0). MAPRISE joins it to town boundaries and re-aggregates it.
The numbers on the map are annual counts per town, not the locations of individual incidents. They are provisional figures at the time of publication and may differ from other statistics.
A look at all of Tokyo
First, the 23 wards and their surroundings. The more incidents in a town, the darker its color. With "All years" selected, the color shows the yearly average over 17 years.
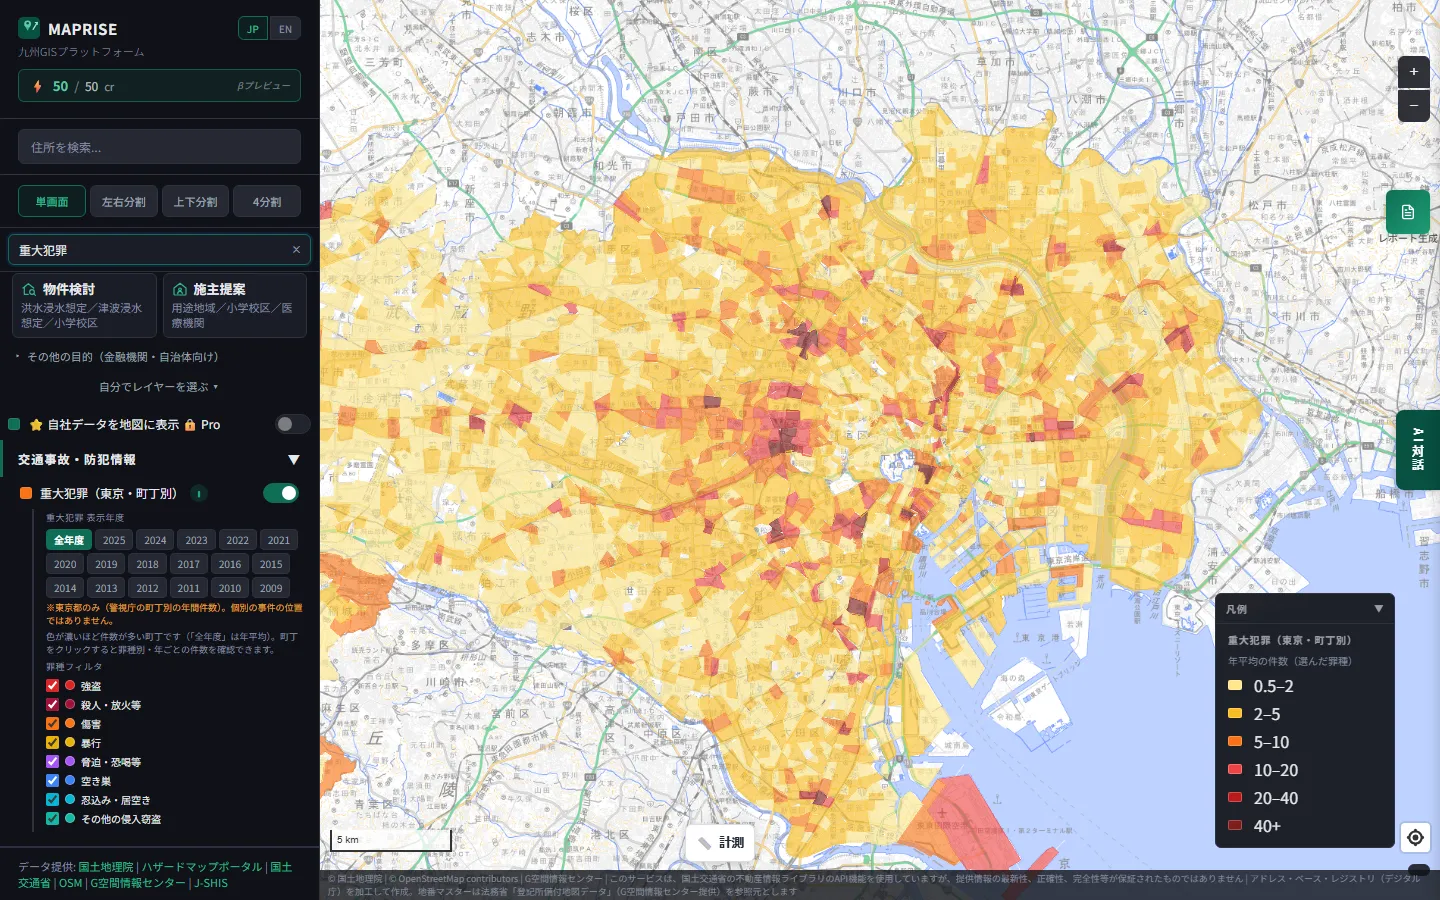
Seen as a whole, the darker towns cluster around big terminal stations and entertainment districts such as Shinjuku, Ikebukuro and Shibuya. Residential areas are mostly pale.
Switch the year, and the map changes
The panel on the left has year buttons from 2009 to 2025. Here is the same area at 2009, 2015, 2020 and 2025.
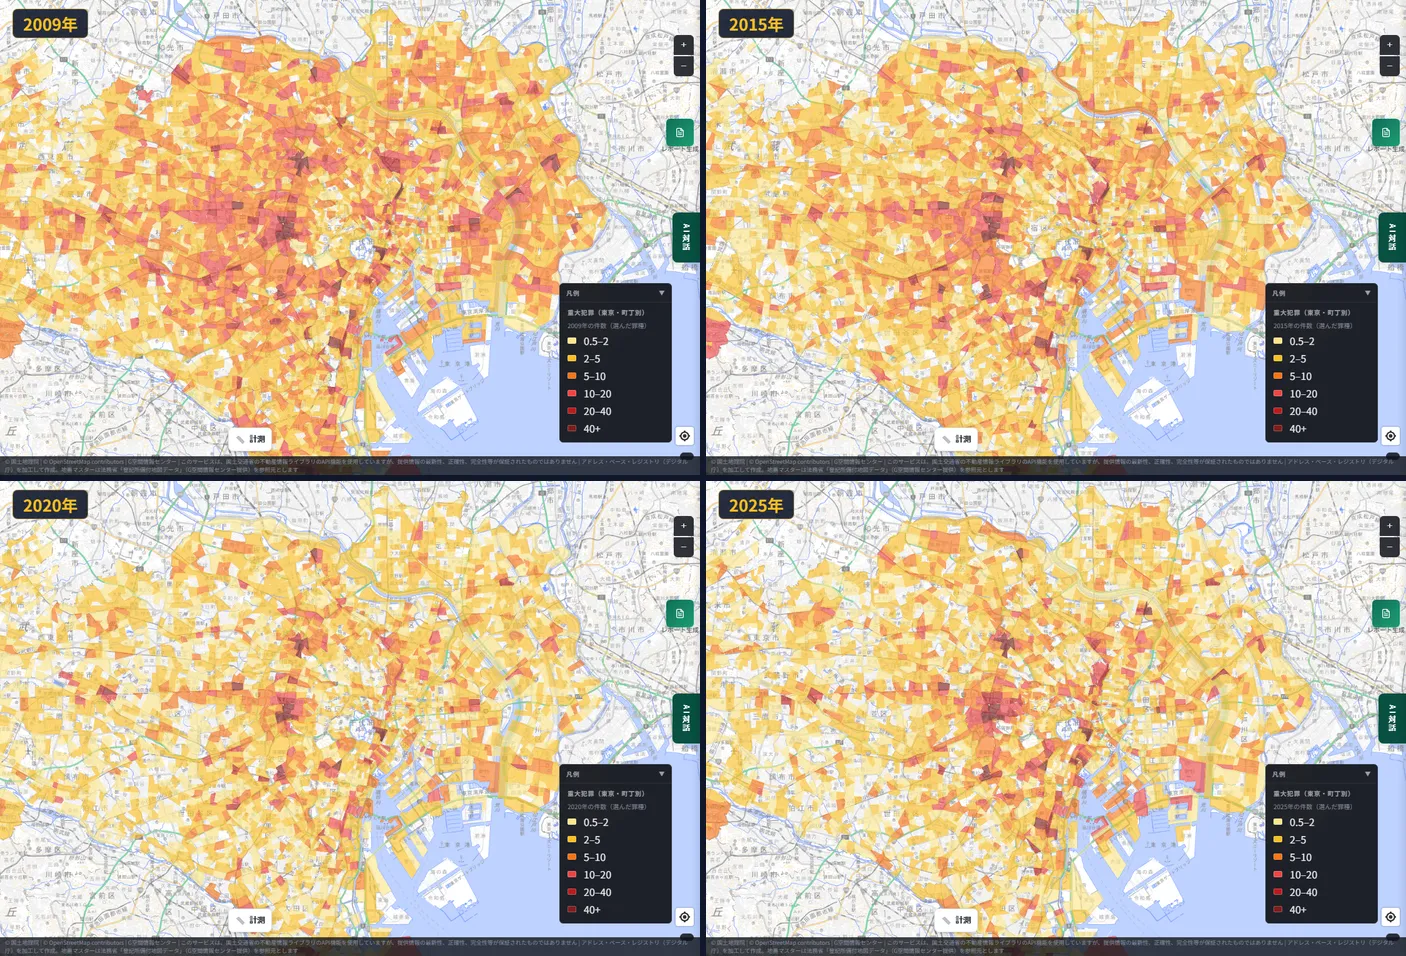
Visually, 2009 looks darker overall, 2015 and 2020 get paler, and in 2025 the darkness of the entertainment districts stands out again. Looking at the numbers, each town moves in its own way, which we'll see in the click screens below.
"All years" shows a smoothed, yearly-average picture across 17 years, which is handy when you want to see a town's usual level without the year-to-year swings.
Filter by crime type, and the map looks completely different
Each of the eight crime types can be switched on and off with a checkbox. Here, the same "All years" view shows only robbery, only burglary (empty house), only bodily injury, and only assault.
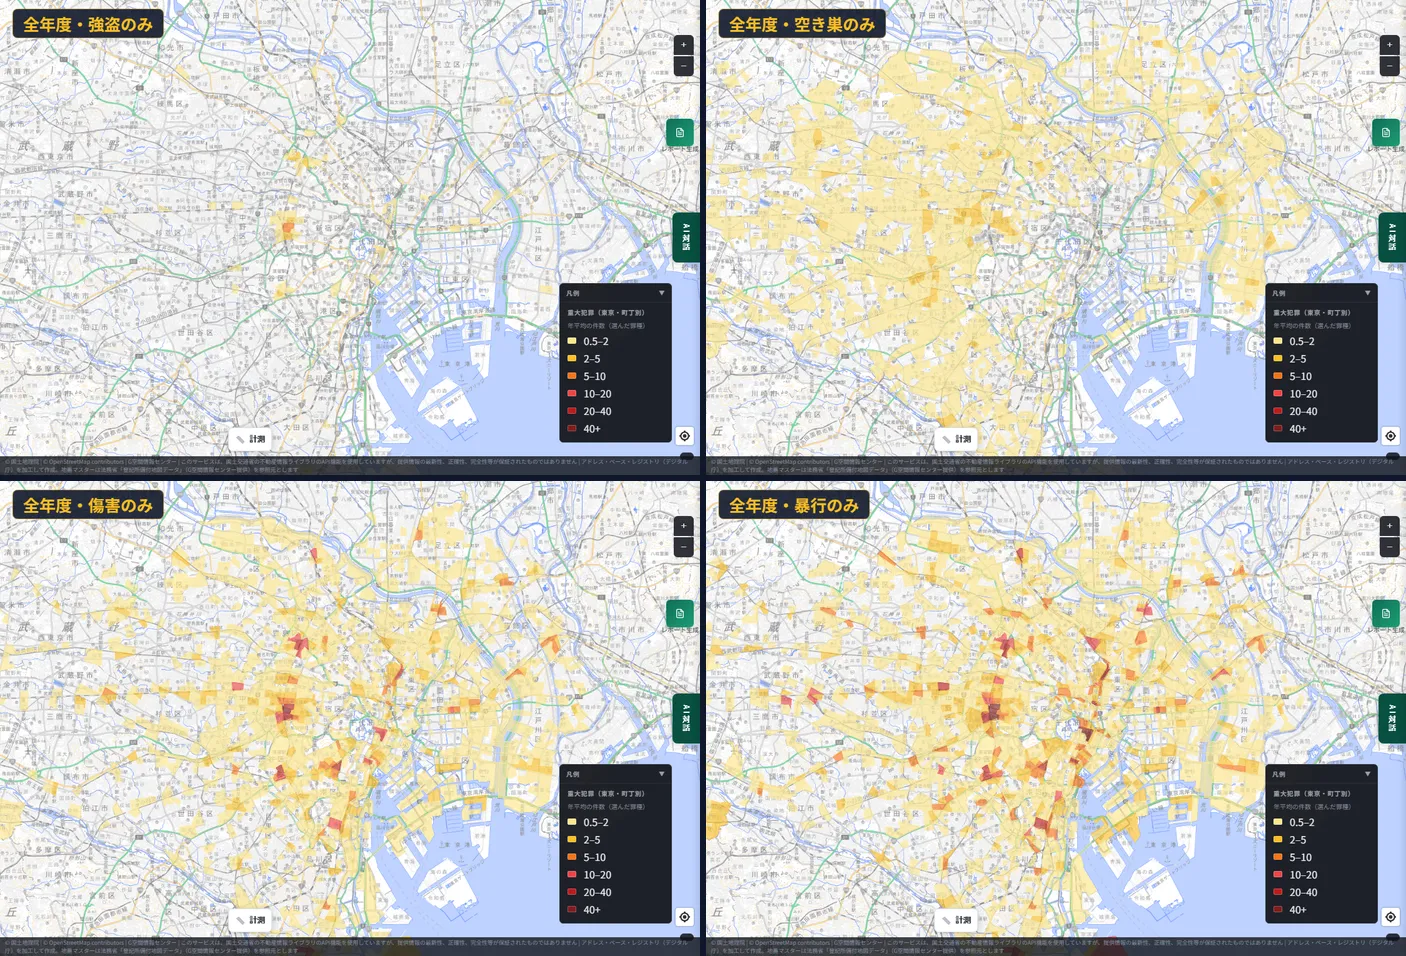
The map's look depends greatly on the crime type.
- Robbery: only a handful of towns are colored.
- Burglary (empty house): pale color spreads thinly over a wide area, including residential districts.
- Bodily injury and assault: strongly concentrated in entertainment-district towns.
Even "public safety" means different places depending on which crime you worry about. Burglary when choosing a home, injury and assault when opening a shop in a district where people gather at night. Being able to separate these by purpose is, we think, a real strength of a map.
Zooming in on towns with high counts
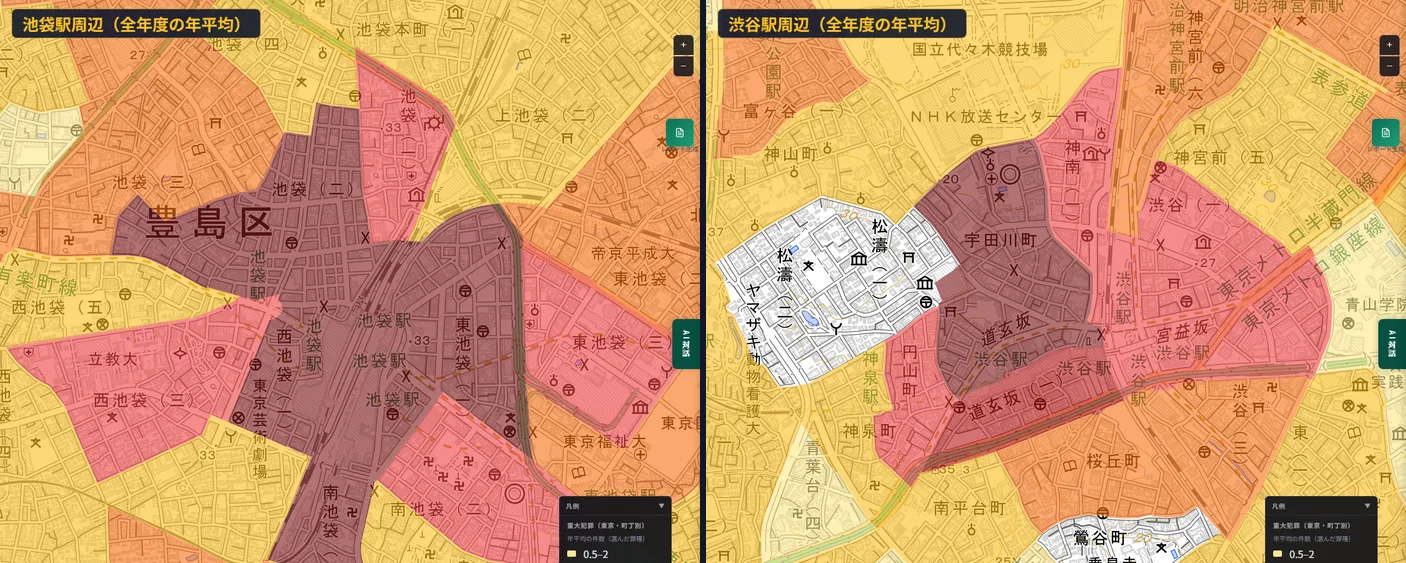
Within the area centered on the 23 wards that I checked, the towns with the highest yearly average across all years (sum of the eight types) were as follows.
| Town | Yearly average |
|---|---|
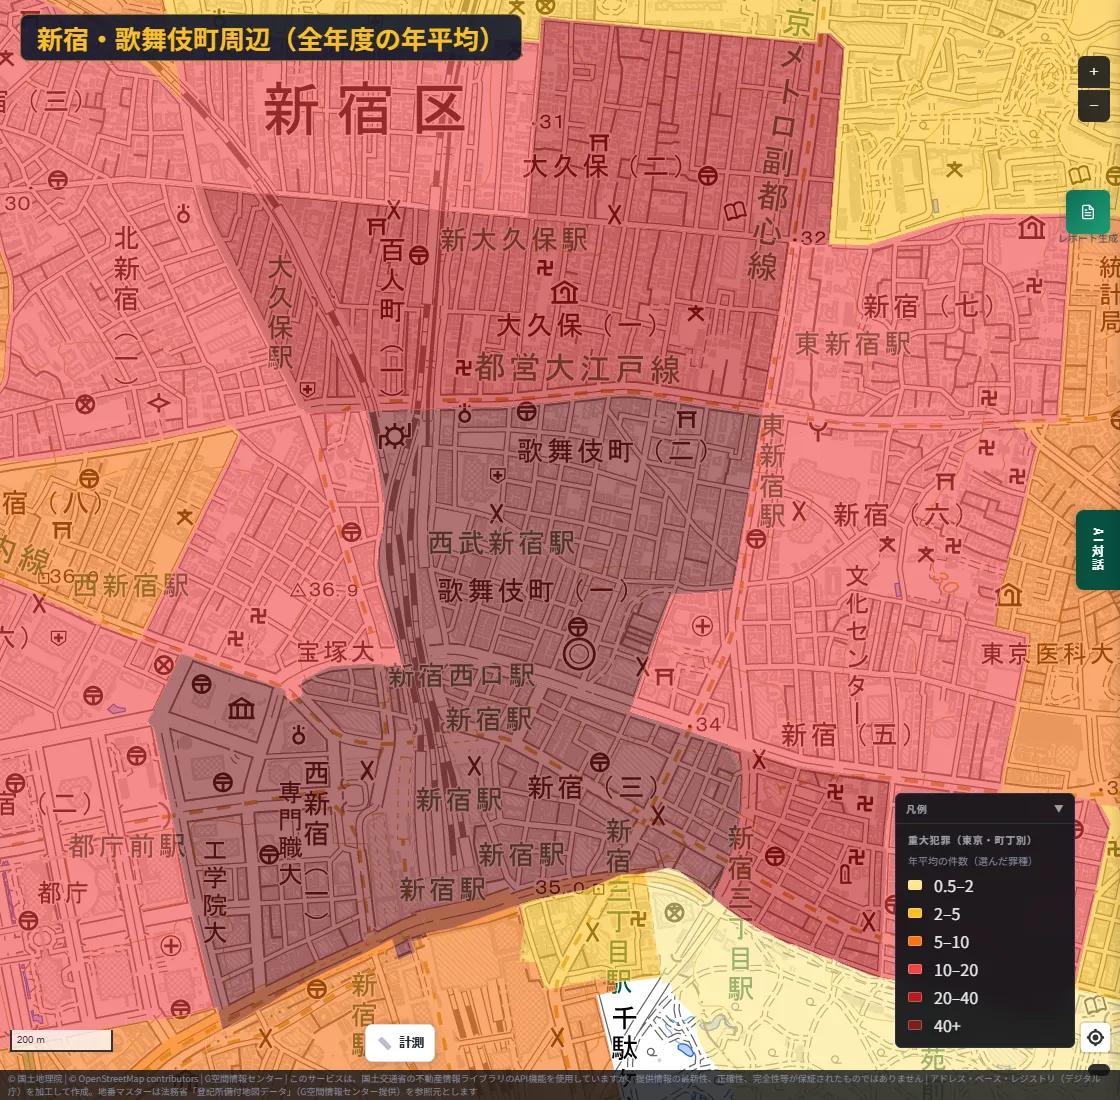
| Shinjuku-ku, Kabukicho 1-chome | about 156 |
| Shinjuku-ku, Kabukicho 2-chome | about 120 |
| Shinjuku-ku, Shinjuku 3-chome | about 107 |
| Minato-ku, Roppongi 3-chome | about 69 |
| Shibuya-ku, Dogenzaka 2-chome | about 67 |
| Toshima-ku, Nishi-Ikebukuro 1-chome | about 67 |
All are entertainment districts around major stations. Let's zoom in on each.
Around Shinjuku and Kabukicho
Around Ikebukuro Station and Shibuya Station
Around Roppongi
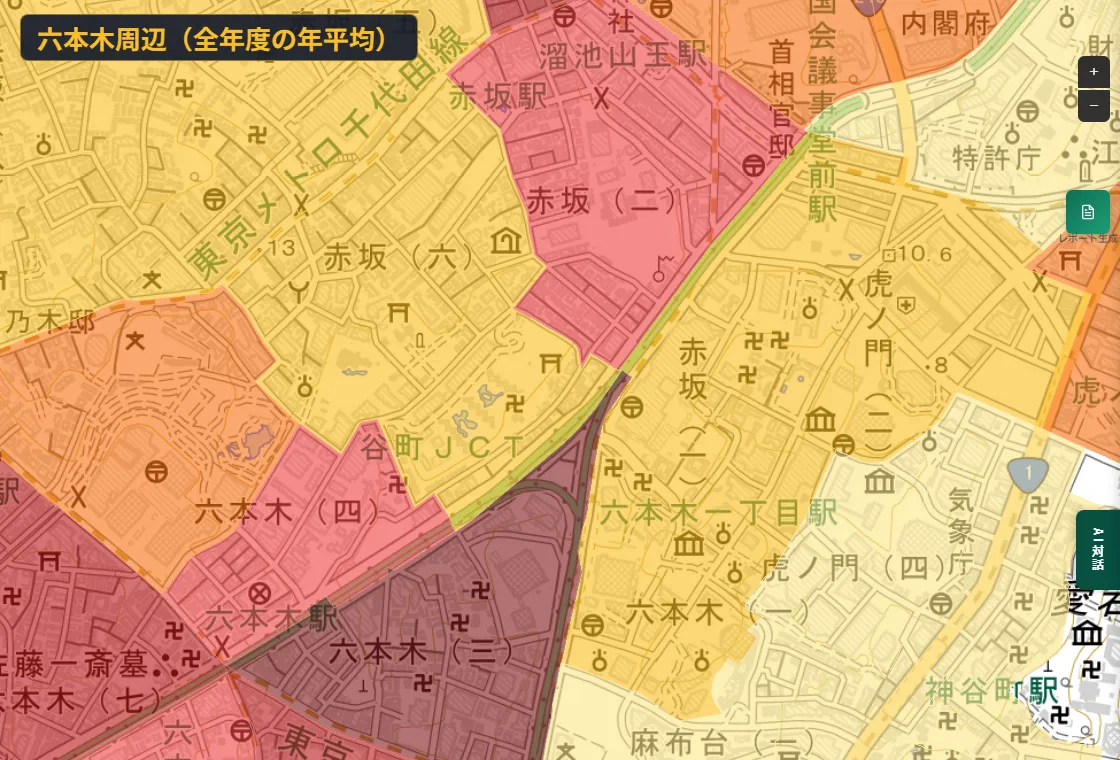
One important note. These are places with a great many workers, visitors and passers-through. This layer does not show a per-resident rate (incidents divided by population) but the count per town itself. A dark color therefore does not mean "dangerous for the people who live there"; it is closer to "a place where many people gather and many incidents are recorded." Please keep this in mind.
Click, and a 17-year history appears
Click a town and its history appears in a popup. Here we clicked Kabukicho 1-chome.
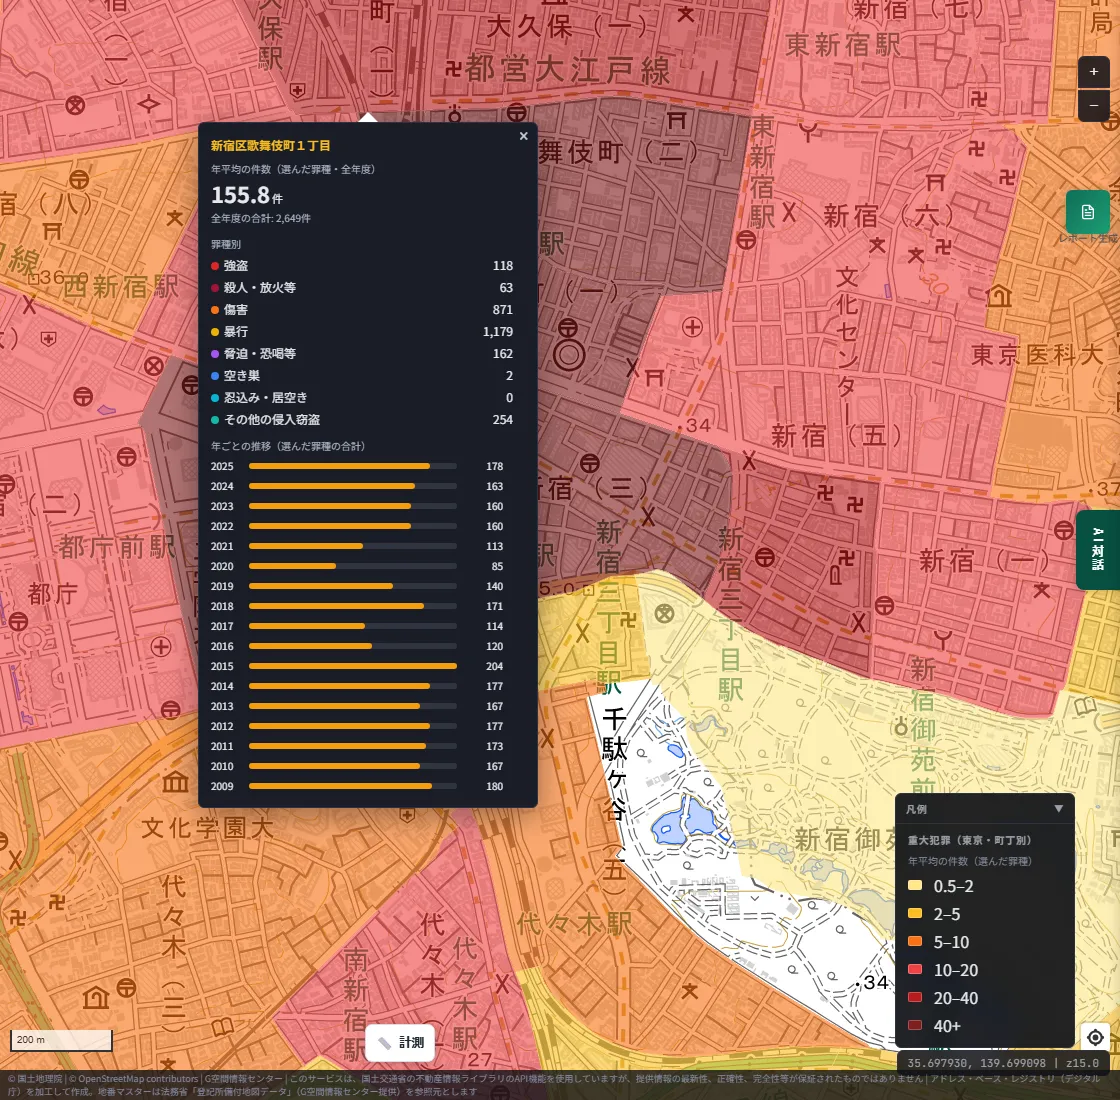
The popup shows the following.
- Counts by crime type: over the 17 years, 118 robberies, 63 homicide/arson etc., 871 bodily injury, 1,179 assault, 162 threats/extortion etc., 2 empty-house burglaries and 254 other burglaries.
- Yearly trend: counts from 2009 to 2025 as bars.
In the yearly trend, the peak is 204 in 2015, the lowest is 85 in 2020, and 2025 is 178. The sharp drop in 2020 overlaps with the period of COVID-19 restrictions. It gives us a hypothesis that the number of people moving around and the counts move together, but this data alone cannot tell us the cause.
If you select 2020 with the year buttons and then click, you get the breakdown by crime type for that year.
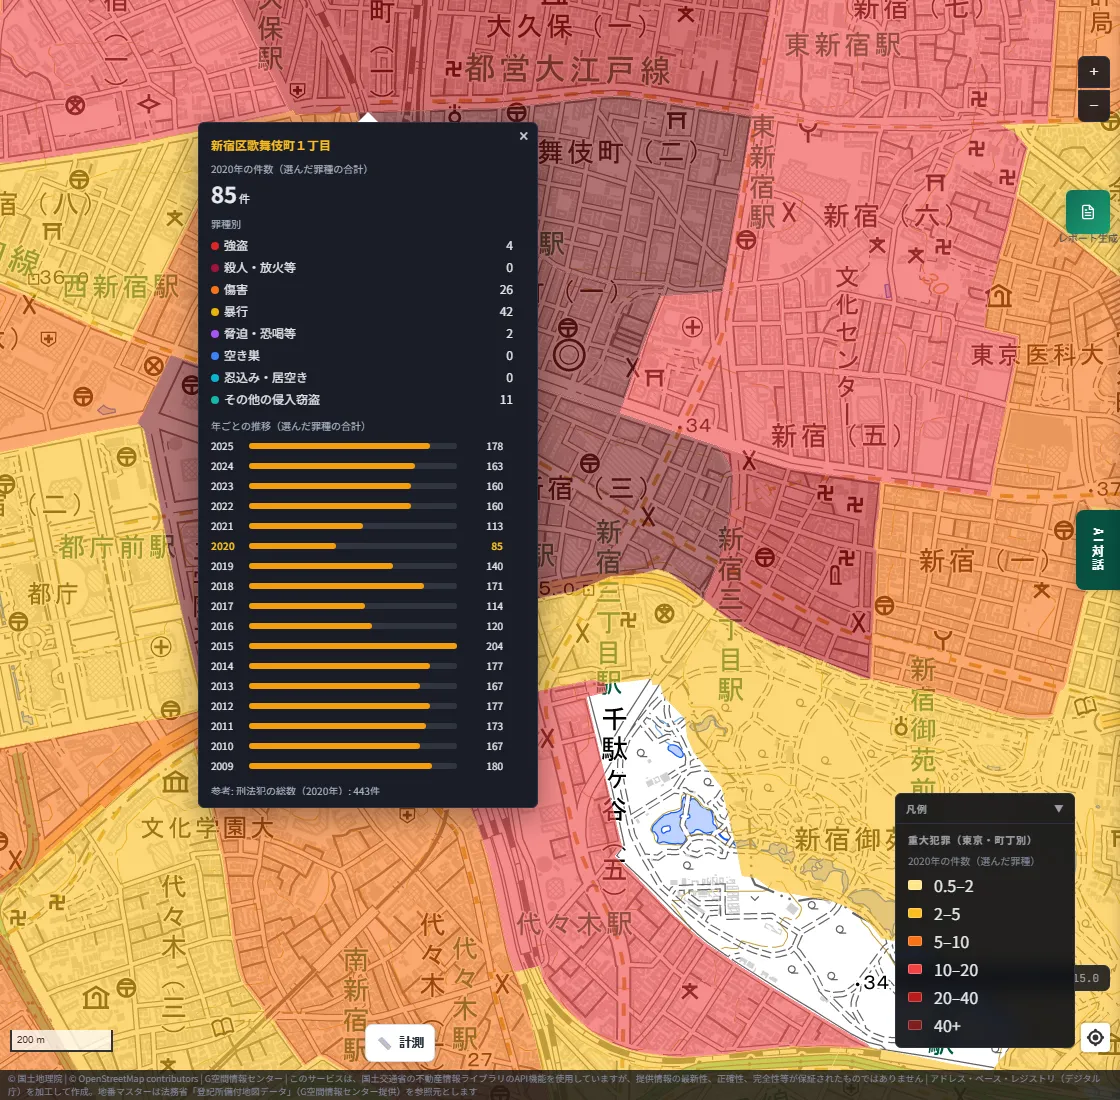
The best feature of this layer is that one screen answers "when, what kind of crime, and how many".
Let's look at another town: Udagawacho in Shibuya.
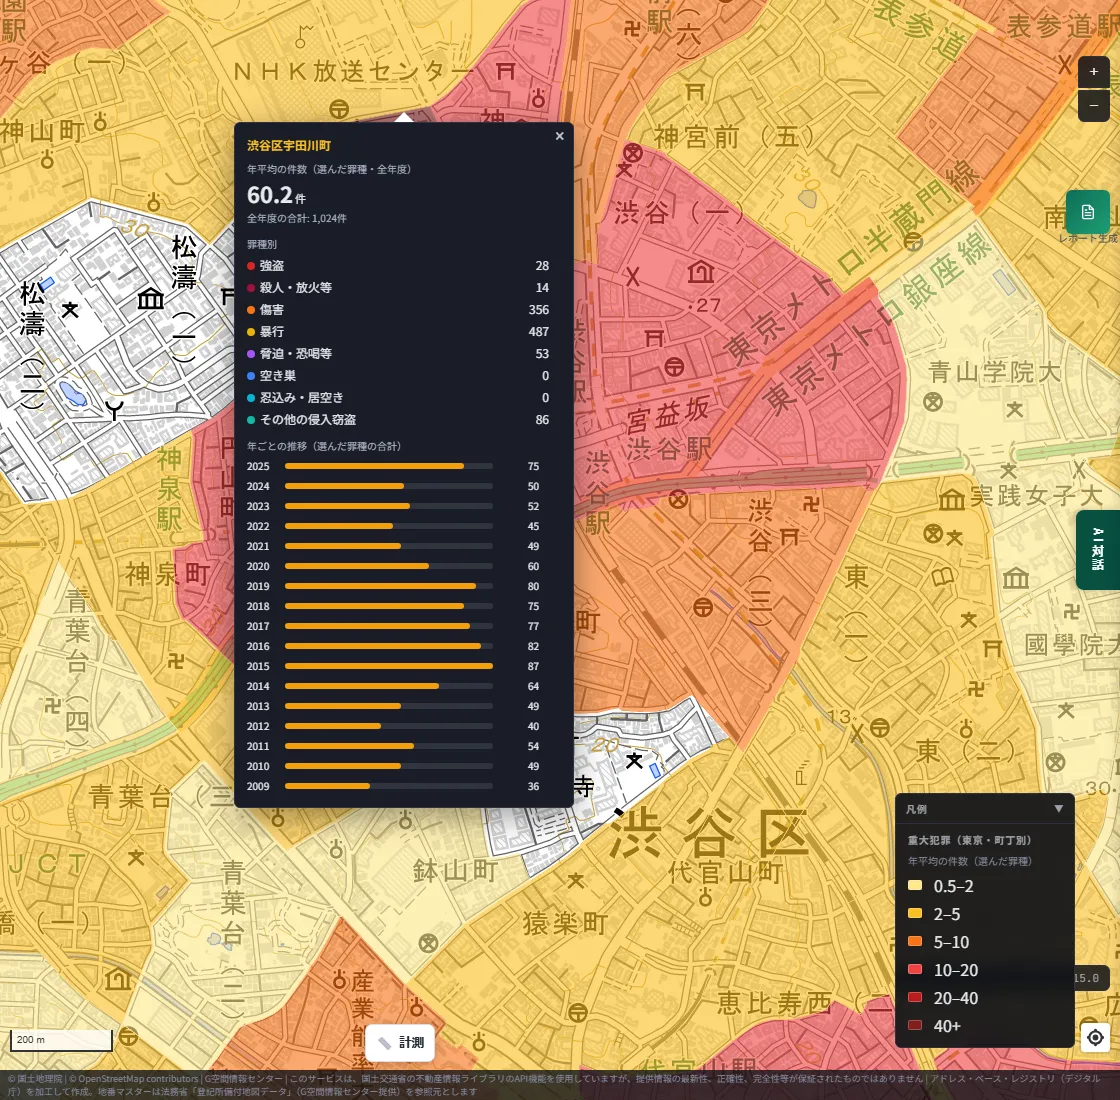
Udagawacho rose from 36 in 2009 to 87 in 2015, then fell for a while, and stands at 75 in 2025. Even among entertainment districts, the shape of the rise and fall differs by town. You can't see this from map colors alone; it is readable only because the yearly history is available for each town.
Quiet residential areas can be checked the same way
You can check towns with low counts just as easily. We clicked Kinuta 7-chome in Setagaya-ku.
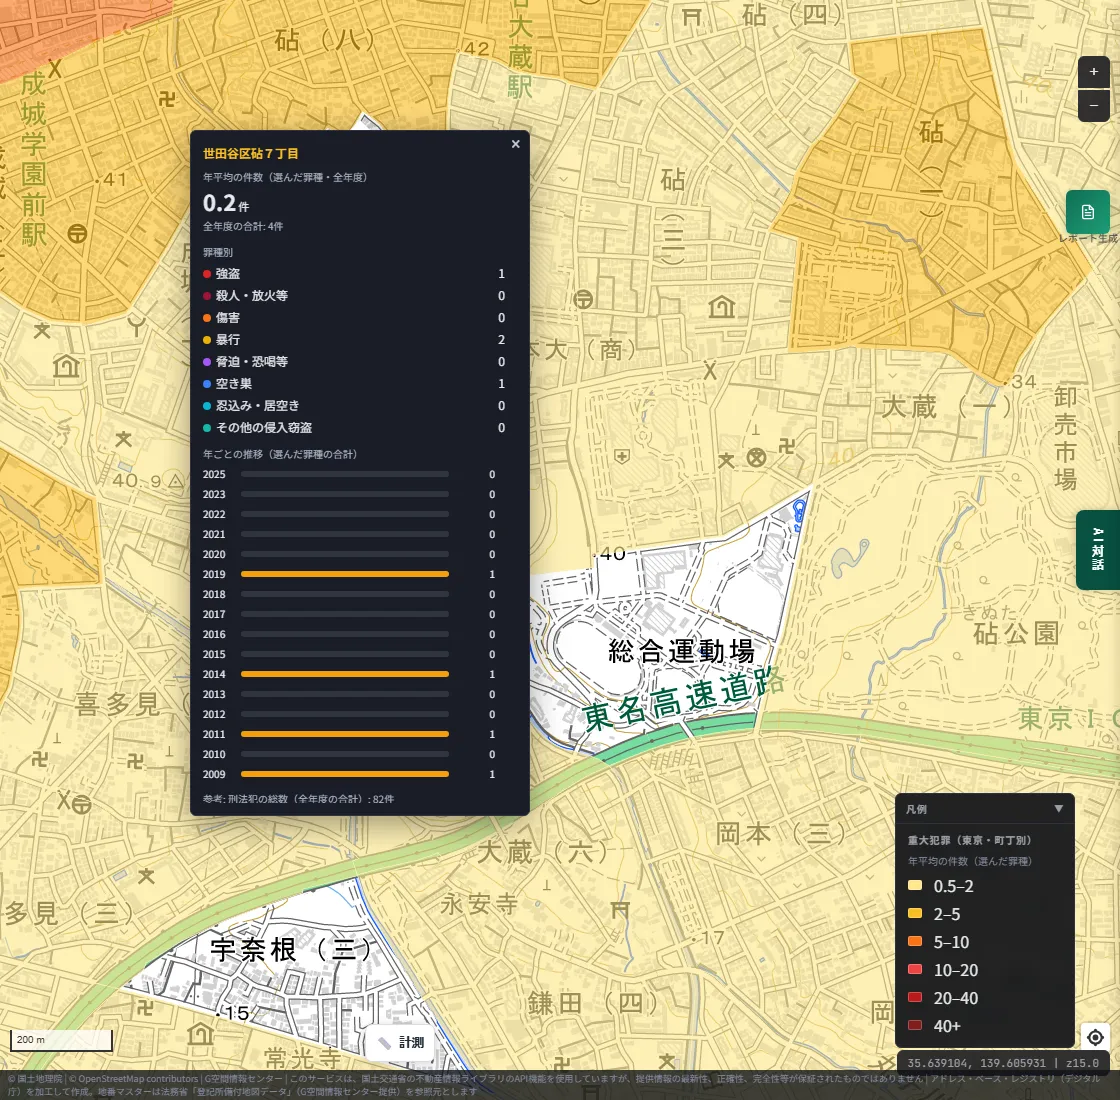
In this town, there were 4 incidents over 17 years: 1 robbery, 2 assaults and 1 empty-house burglary. Compared with 2,649 in Kabukicho 1-chome, that is how large the gap can be within the same Tokyo.
That said, a low count is not a guarantee of safety. It is only a record of cases the police recognized.
Compare with our earlier crime map on two screens
MAPRISE already has a "Crime Incidents" layer. It plots theft methods (bicycle theft, motorcycle theft, theft from vehicles, parts theft, car theft, snatching and vending-machine theft) as points. We split the screen left and right, with the new Serious Crime layer on the left and the earlier Crime Incidents layer on the right.
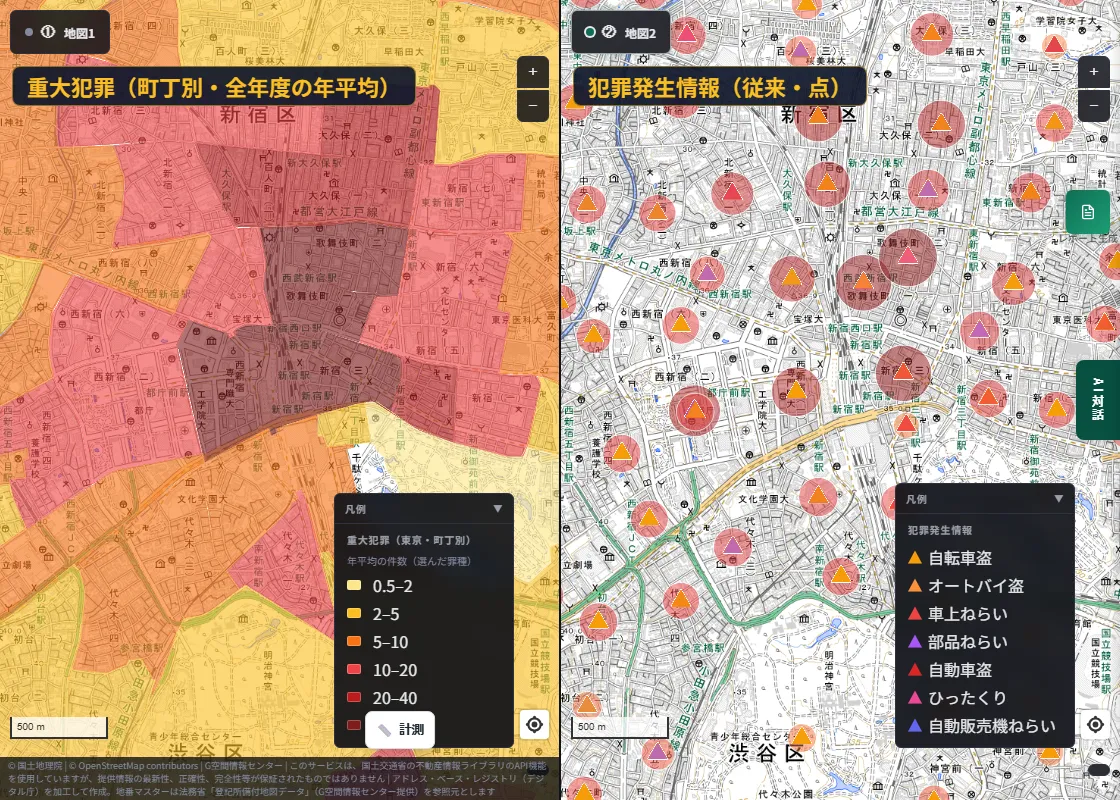
The left shows "how many per town" as areas, and the right shows "theft methods" as points. Around the same Shinjuku Station, putting the two side by side reveals different things.
- The earlier layer shows theft methods by pin position.
- The new layer shows robbery, bodily injury, assault, burglary and more by town area and history.
You can switch each on and off freely, so you can check a town you care about from both viewpoints. We wrote about the earlier layer in detail here.
Following a place through time is the point of a map
What we most wanted to convey in this post is time.
A statistical table is good for lining up the numbers of one year, but following "how did this town move over 17 years", town by town and crime type by crime type, is hard. In MAPRISE you switch the whole map with the year buttons, see the 17-year trend by clicking, and separate crime types with checkboxes. Being able to divide by time, and to do so on the place itself, is what a map does well.
Buying or renting a home, considering a shop location, planning crime prevention: there are many occasions to choose a place. Open data published by the authorities can now be checked in terms of when, in which area, and what kind of crime, both qualitatively and quantitatively.
Limitations, honestly
- Counts on the map are annual recognized-case counts per town. They do not show the locations of individual incidents.
- They are not divided by population. Places with many people tend to have more incidents.
- Recognized cases are those the police are aware of. Cases not known to them are not included.
- When a town is divided into several map areas, every area shows the whole town's count.
- "Homicide, arson, etc." cannot be separated so that homicide appears alone.
- Figures are provisional at publication and may differ from other statistics.
- The Free plan shows only 2019. Showing all years requires Starter or above (all years are available during the current beta period).
- Tokyo only. We'll consider other areas in the future.
In closing
When choosing where to live or work, we'd be glad if a map can help you check the record of facts, along the flow of time, and not only impressions. When you look at it, please avoid jumping to "many incidents means a dangerous town", and read how people gather and how things change over time as well.
Questions or feedback are always welcome at info@maprise.jp.
The serious crime counts shown on the maps in this post are reference information that MAPRISE (Vulcanz LLC) joined to town boundaries and re-aggregated from "Recognized cases by town, crime type and method", Tokyo (Metropolitan Police Department), Creative Commons Attribution 4.0 International (CC BY 4.0). They were not created or published by the Tokyo Metropolitan Government or the Metropolitan Police Department. They are provisional figures at the time of publication and may differ from other statistics. Maps are based on GSI Tiles from the Geospatial Information Authority of Japan, among others. This post is not intended to evaluate or criticize any particular area or people.
Tags: #Crime #Public safety #Tokyo #Open data #Time series
Other-language share text (exception cases)
Quick share above follows our platform-locked language policy (X-family in Japanese, LinkedIn in English). The four panes below let you grab the opposite-language body when needed — e.g. introducing an English post to a Japanese audience on X, or posting a Japanese article to LinkedIn in Japanese. Each pane offers both a copy button and a direct intent link.
📝 いつ、どの町で、どんな犯罪が ― 東京都の重大犯罪を、町丁別・17年分で地図にしました
警視庁が公表する町丁ごとの認知件数(2009〜2025年)を地図にした「重大犯罪(東京・町丁別)」レイヤーを公開しました。年ごとの切り替え、罪種ごとの絞り込み、クリックで見られる17年分の履歴、従来の犯罪マップとの2画面比較まで、画像を中心にご紹介します。
https://maprise.jp/ja/blog/tokyo-serious-crime-map/ #犯罪 #治安
🆕 新しいブログ記事を公開しました。

《いつ、どの町で、どんな犯罪が ― 東京都の重大犯罪を、町丁別・17年分で地図にしました》

警視庁が公表する町丁ごとの認知件数(2009〜2025年)を地図にした「重大犯罪(東京・町丁別)」レイヤーを公開しました。年ごとの切り替え、罪種ごとの絞り込み、クリックで見られる17年分の履歴、従来の犯罪マップとの2画面比較まで、画像を中心にご紹介します。

👉 詳しくはこちら: https://maprise.jp/ja/blog/tokyo-serious-crime-map/
📝 When, Where, and What Kind of Crime — Tokyo's Serious Crime, Mapped by Town Over 17 Years
We've released the Serious Crime (Tokyo, by town) layer, built from the annual recognized-case counts per town published by the Tokyo Metr…
https://maprise.jp/en/blog/tokyo-serious-crime-map/ #Crime #Publicsafety
🆕 New on the MAPRISE blog.

《When, Where, and What Kind of Crime — Tokyo's Serious Crime, Mapped by Town Over 17 Years》

We've released the Serious Crime (Tokyo, by town) layer, built from the annual recognized-case counts per town published by the Tokyo Metropolitan Police (2009–2025). Here's a mostly visual tour: switching years, filtering by crime type, a 17-year history on click, and a side-by-side view with our earlier crime map.

👉 Read the full post: https://maprise.jp/en/blog/tokyo-serious-crime-map/

#Crime #Publicsafety #Tokyo #Opendata #Timeseries
Related posts
- That intersection might actually be an accident hotspot - we mapped traffic accident and crime data2026-08-02
- Cemeteries, Mapped — A New Lens on Real-Estate Site Selection2026-09-26
- Religious Facilities, Mapped — From Shrines, Temples, and Churches to Mosques and 'Other Religious Facilities'2026-09-26