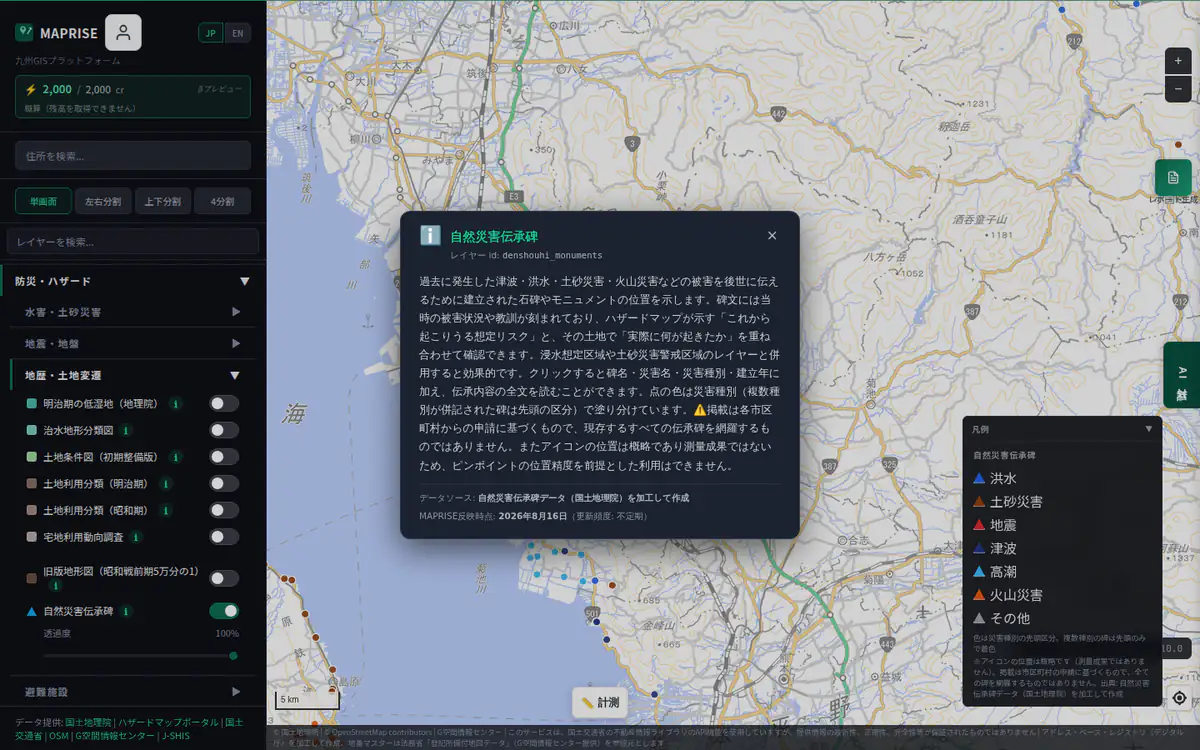
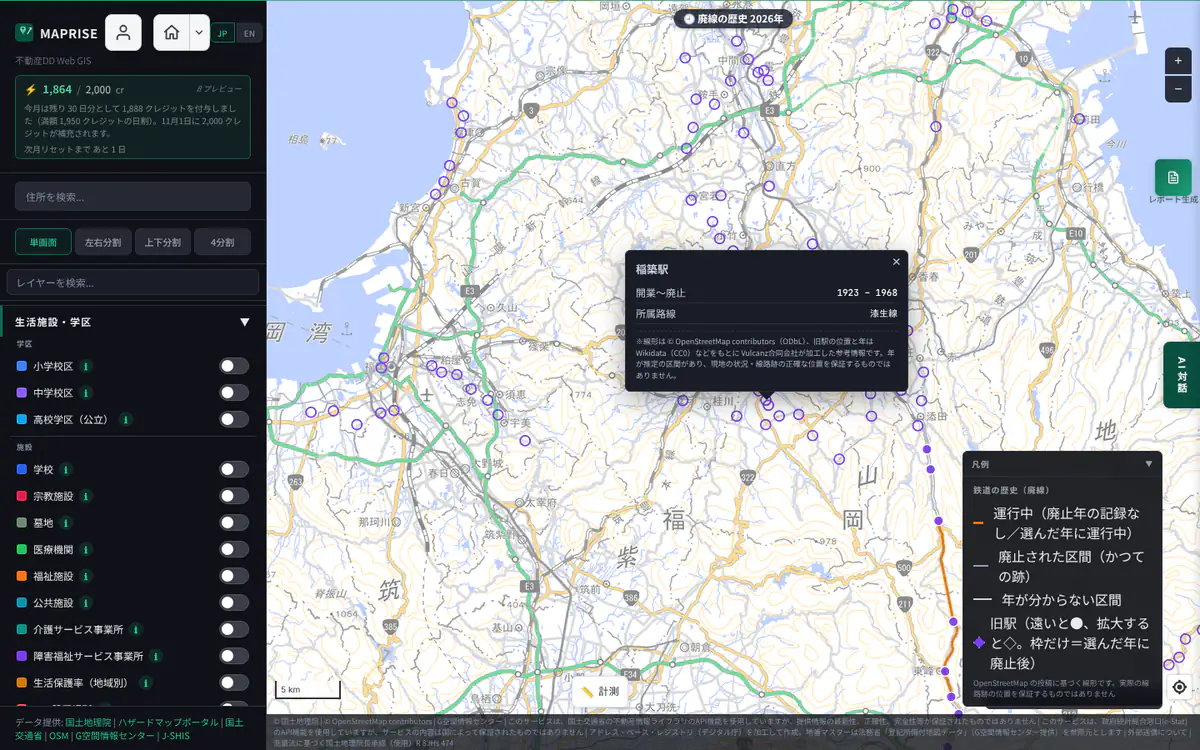
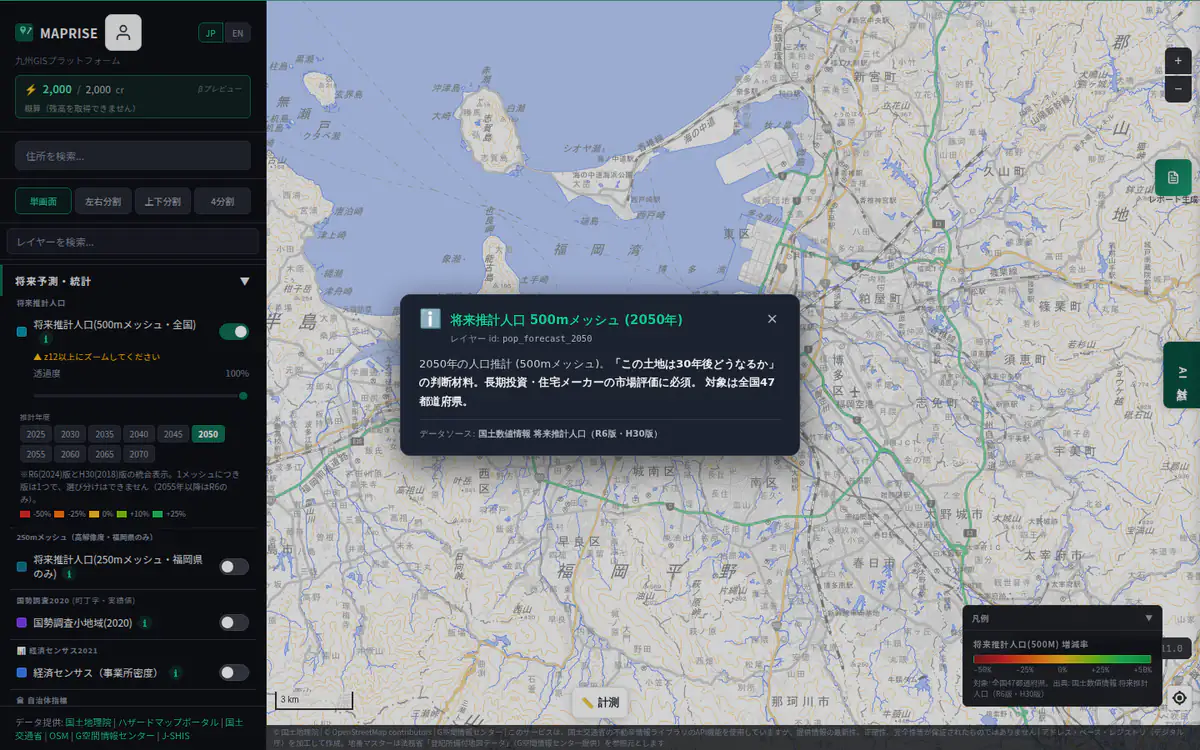
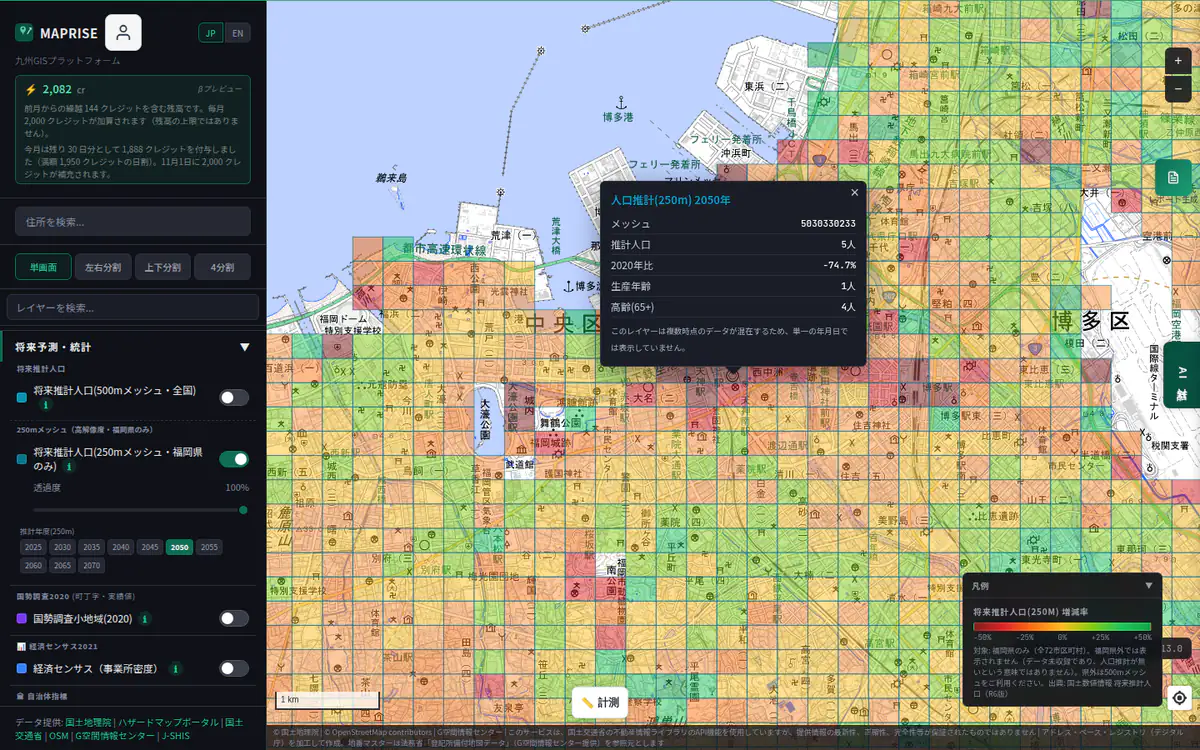
MAPRISE

LAYER CATALOGUE

Layer catalogue

A page for each map layer you can overlay in MAPRISE: what it shows, what it tells you, which everyday problems it helps with, with a real screen example and the data source.

Use "Copy link" beside each layer heading to get a URL that opens that layer directly (e.g. /en/layers/#flood-l2).

Base maps (standard, pale, aerial photo, colour elevation and more) are not layers: they are the map that layers are drawn on. Open the Base map catalogue

How to read the screen examples

  1. 1. Switch on the left

    The layer being introduced is switched ON.

  2. 2. Colours and symbols

    The data itself, drawn on top of the map.

  3. 3. Legend at bottom right

    Shows what each colour or symbol means, with the source.

  4. 4. Click popup

    Click a point on the map to open a callout with details for that spot.

Reading the plan iconsas of 15 November 2026

The icons show which plan each layer needs.

  • FreeAvailable on the free plan
  • Free (partly paid plans)Available free (some features need a paid plan)
  • Starter and aboveNeeds the Starter plan or above
  • Pro and aboveNeeds the Pro plan or above
→ See pricing

Reading the special notesas of 15 November 2026

Layers limited to some regions, in beta / early access, covering only part of the country or containing estimates carry an icon and a note beside the heading. No display does not necessarily mean no risk or no data.

  • Limited regionsCovers only certain regions, e.g. the 7 Kyushu prefectures or one city
  • Beta / early accessBeta, trial, early-access or research-stage feature
  • Partial coverageIncludes only the part of the country where data is available
  • EstimatePosition, extent or value is estimated, not measured

Layers with time-series dataas of 15 November 2026

Time-series dataLayers that can show past years carry a clock icon labelled “Time-series data” beside the heading, with the span they cover. Move the year with the timeline at the bottom of the map or the layer’s year buttons. Coverage can differ by year. Layers you can also ask the AI chat about for past years say so in their description.

Filter by industry

Scrolling through all 137 is a lot, so you can narrow the page to the layers each industry is likely to use. A layer used by several industries appears under each of them. Real-estate brokers and developers always include every layer related to the 重要事項説明 (important matters explanation).

"Related to 重説" marks layers tied to the items checked in a 重要事項説明 (statutes, zones, supply facilities, roads, registry). They are reference information and do not replace confirmation with the competent offices. The assignment to industries is a guide based on likely use. Layers not shown under an industry are still available when no industry is selected.

Regulations & zones362836122331 layers

Zoning, fire-prevention zones, city planning, natural parks, fill-land rules and more — the designations that decide what can be done on a parcel.

What this group tells you

  • The baseline for permitted use and scale (zoning, fire zones, height districts)
  • Areas where notification or permits may come into play (fill land, parks, buried cultural sites, soil contamination)
  • City policy: urbanisation control areas and location-optimisation plan zones

Everyday problems it helps with

  • Real Estate BrokersChecking legal restrictions one by one across several municipal sites for the important-matters briefing takes too long.
  • Developers / FundsWant to rule out sites that cannot be built on, or need heavy procedures, before visiting them.
  • Local GovernmentNeed to overlay multiple designations on one map when reviewing city planning and location-optimisation plans.

Layers in this group

Show layer list

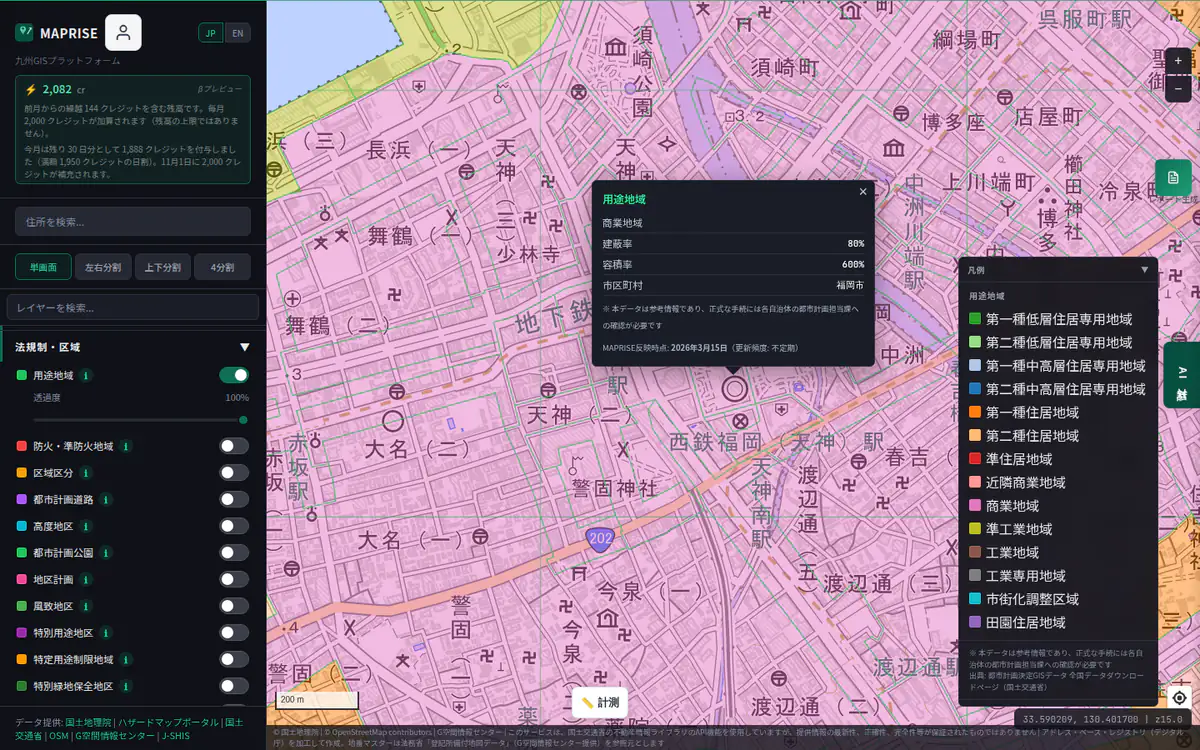
Use Zoning

Related to 重説Free (partly paid plans)
Show details

Free: zone colouring. Building-coverage and floor-area ratio values need Starter or above.

Overview

Residential/commercial/industrial zones under City Planning Act. Foundation for building coverage ratio, FAR, and use restrictions. Covers all 47 prefectures (as of Nov 2026). Essential for land acquisition and design.

Data source

KSJ A29 / City Planning Decision GIS Data - National Data Download Page (MLIT)

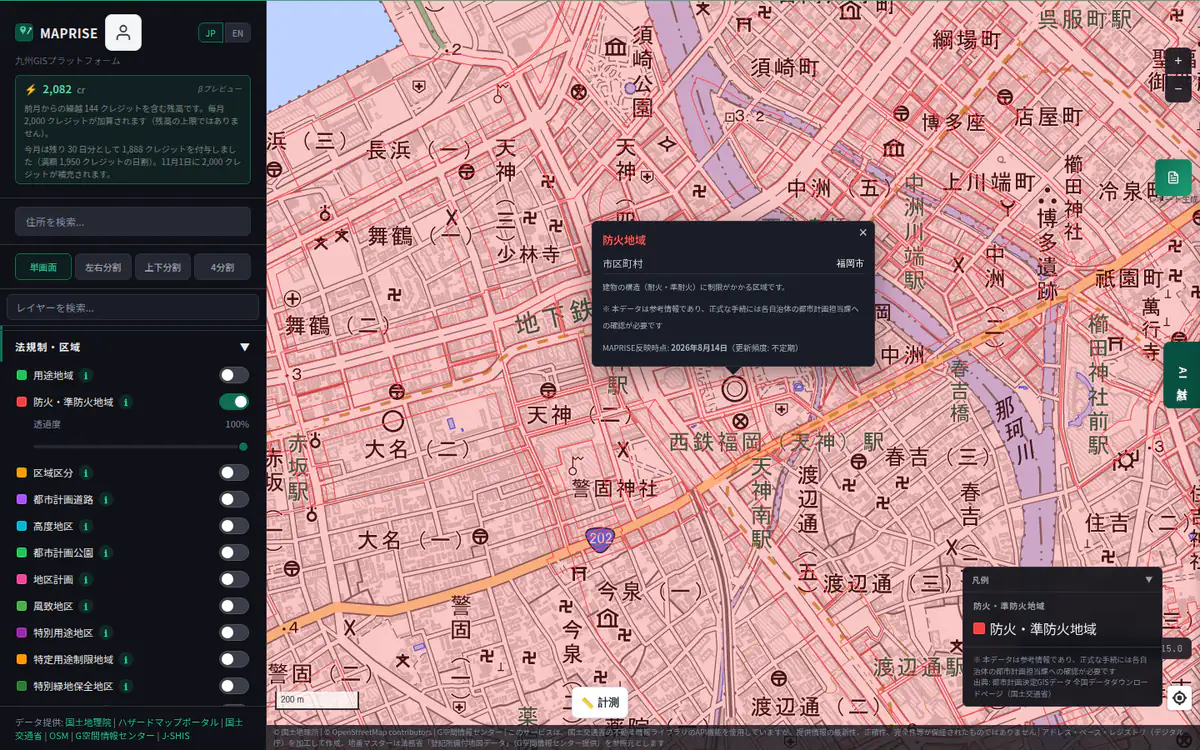
Use Zoning — Screen example (with legend and click popup)
Screen example (with legend and click popup) ・Click the image to open it full size

Fire Prevention Zones

Related to 重説Free
Show details

Overview

Areas requiring fire-resistant construction. Directly impacts material choice and building cost.

Data source

City Planning Decision GIS Data - National Data Download Page (MLIT)

Fire Prevention Zones — Screen example (with legend and click popup)
Screen example (with legend and click popup) ・Click the image to open it full size

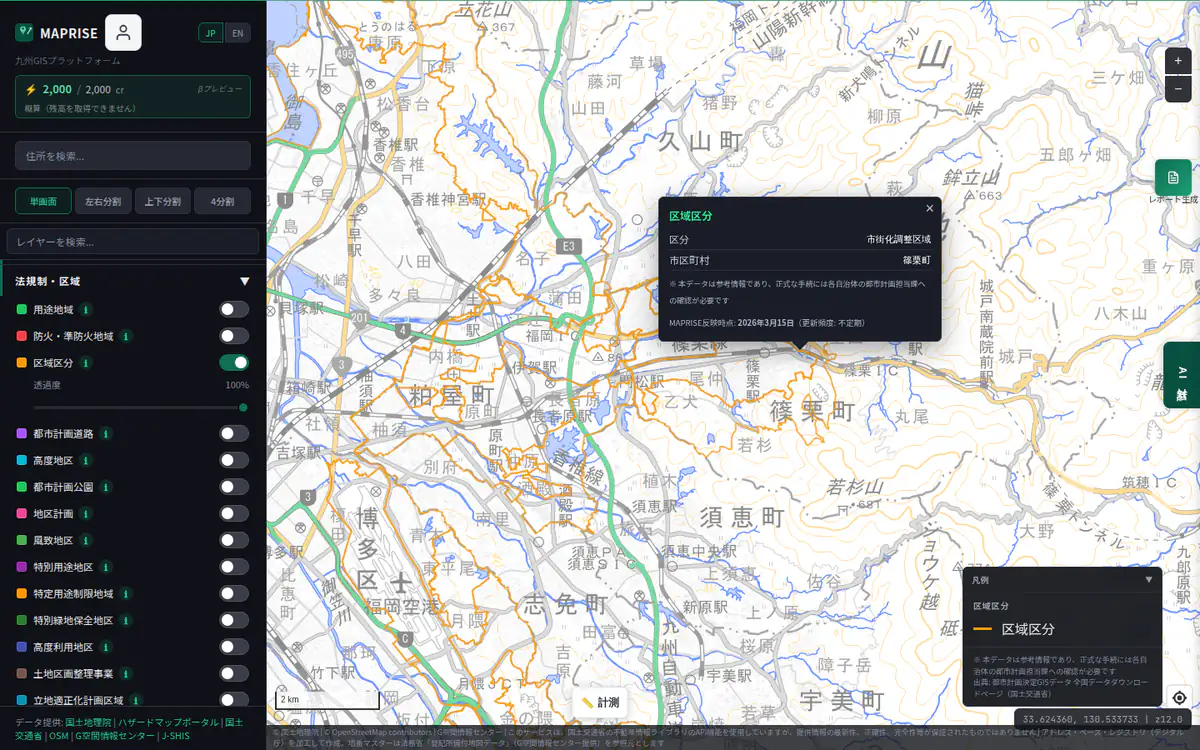
Urbanization Promotion / Control Zones

Related to 重説Free
Show details

Overview

Promotion = developable, Control = generally non-developable. Critical for development feasibility.

Data source

City Planning Decision GIS Data - National Data Download Page (MLIT)

Urbanization Promotion / Control Zones — Screen example (with legend and click popup)
Screen example (with legend and click popup) ・Click the image to open it full size

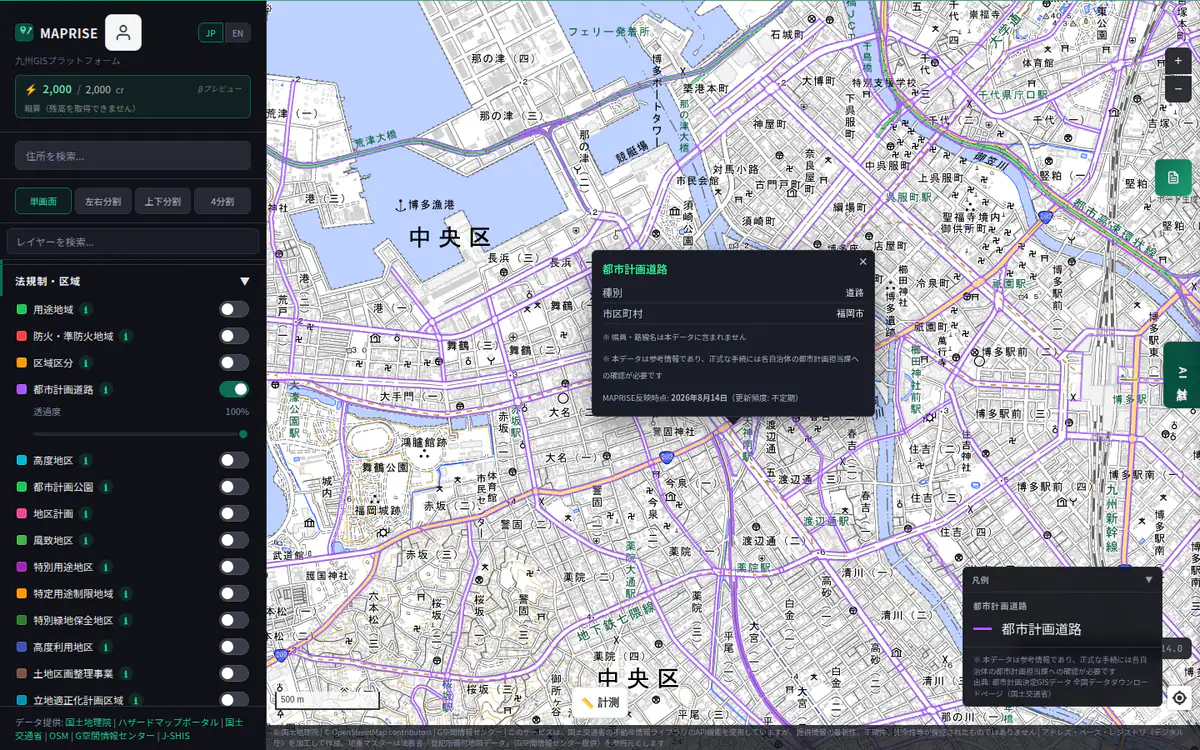
Planned City Roads

Related to 重説Free
Show details

Overview

Planned roads under city planning. Affects land acquisition and frontage valuation.

Data source

City Planning Decision GIS Data - National Data Download Page (MLIT)

Planned City Roads — Screen example (with legend and click popup)
Screen example (with legend and click popup) ・Click the image to open it full size

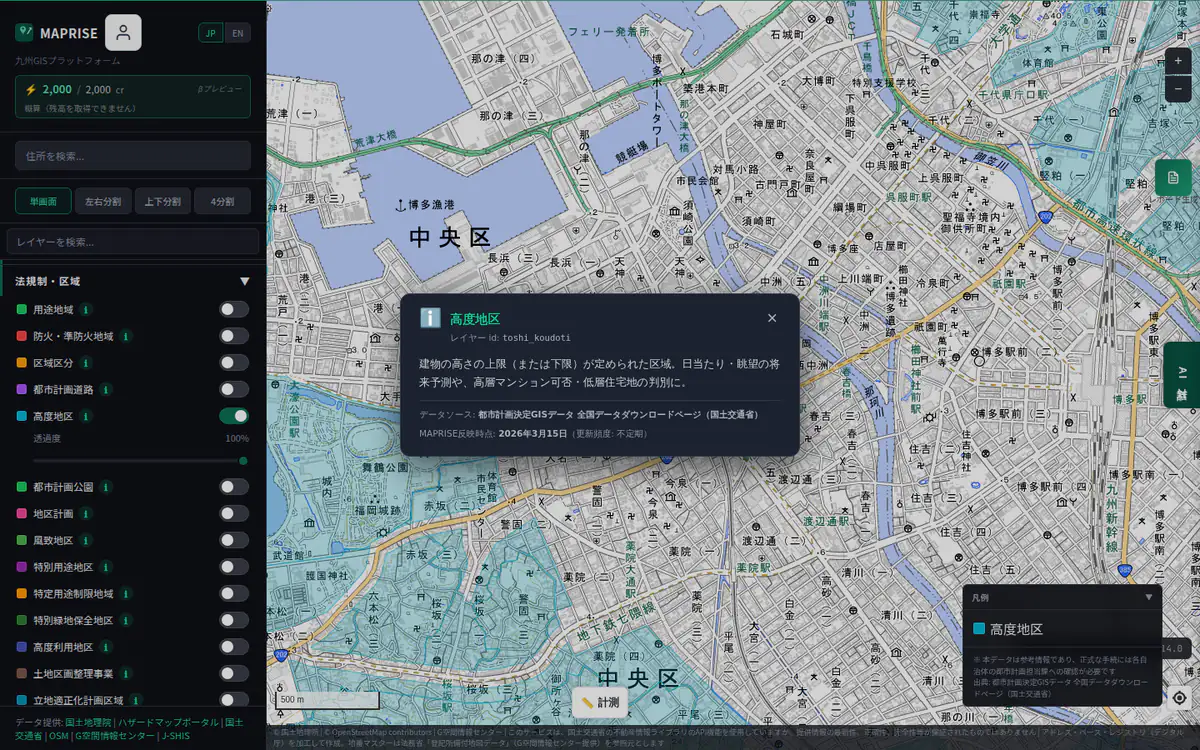
Height Districts

Related to 重説Free (partly paid plans)
Show details

Free: the area within about 10 km of each prefectural capital only. Full coverage needs Starter or above.

Overview

Maximum/minimum building height restriction zones. Distinguishes tower districts vs low-rise residential.

Data source

City Planning Decision GIS Data - National Data Download Page (MLIT)

Height Districts — Screen example (with legend and click popup)
Screen example (with legend and click popup) ・Click the image to open it full size

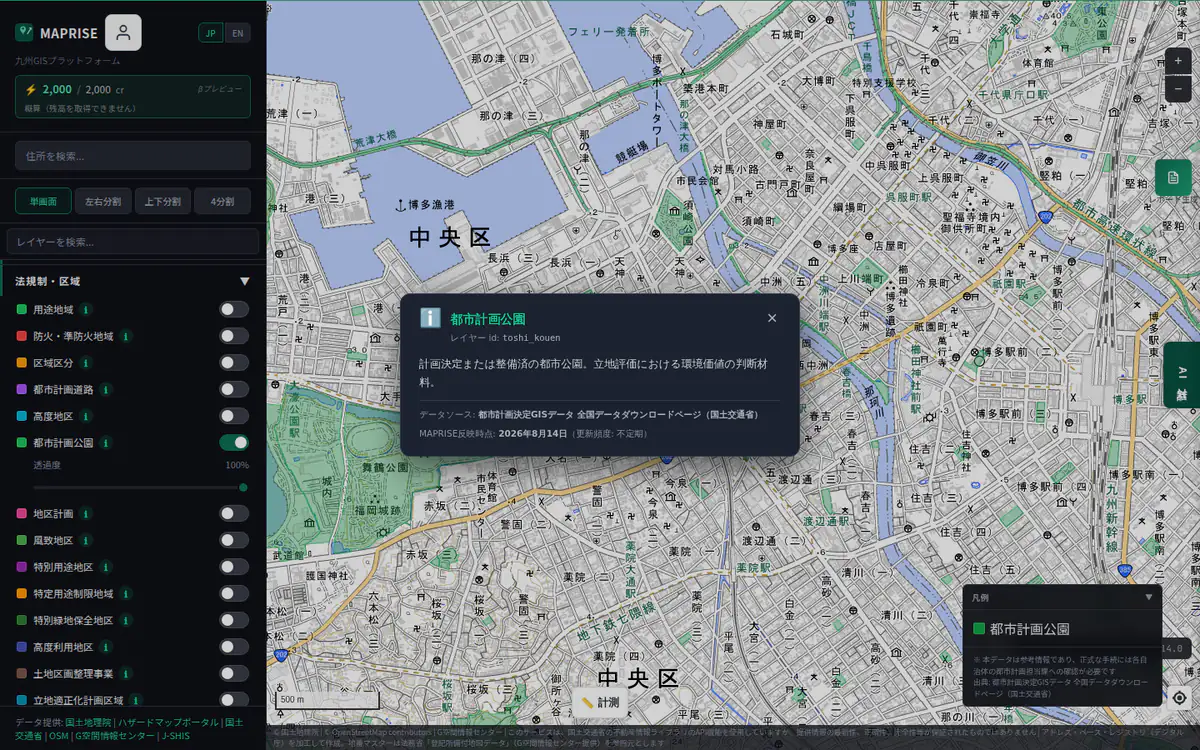
Planned City Parks

Related to 重説Free
Show details

Overview

Planned or completed urban parks. Environmental value for location assessment.

Data source

City Planning Decision GIS Data - National Data Download Page (MLIT)

Planned City Parks — Screen example (with legend and click popup)
Screen example (with legend and click popup) ・Click the image to open it full size

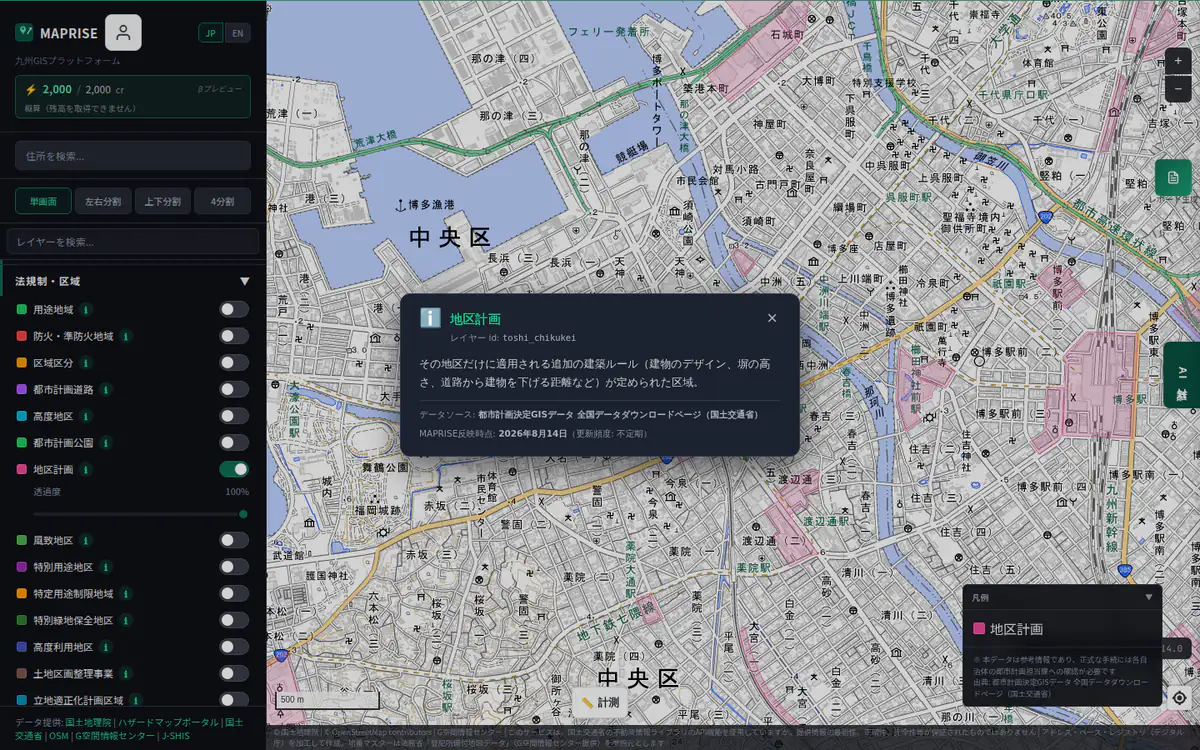
District Plans

Related to 重説Free (partly paid plans)
Show details

Free: the area within about 10 km of each prefectural capital only. Full coverage needs Starter or above.

Overview

Areas with district-specific building rules: design restrictions, setbacks, etc.

Data source

City Planning Decision GIS Data - National Data Download Page (MLIT)

District Plans — Screen example (with legend and click popup)
Screen example (with legend and click popup) ・Click the image to open it full size

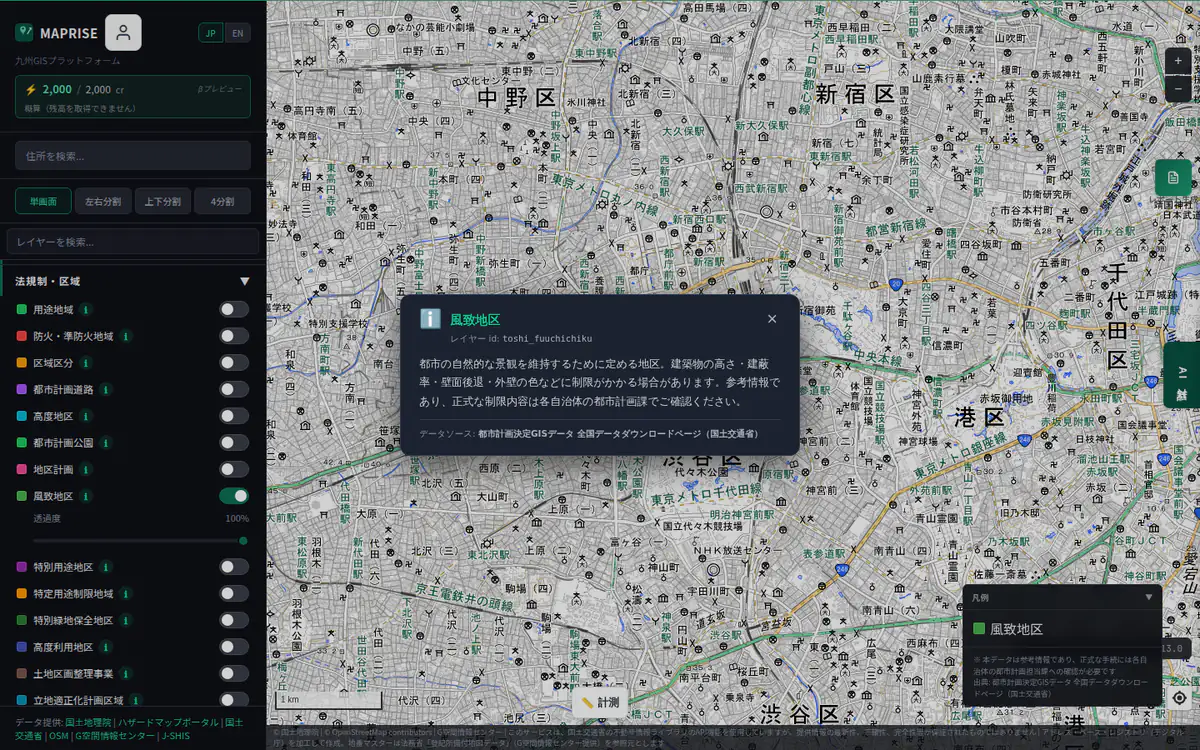
Scenic District

Related to 重説Free (partly paid plans)
Show details

Free: the area within about 10 km of each prefectural capital only. Full coverage needs Starter or above.

Overview

A district designated to preserve the natural scenery of urban areas. Building height, coverage, wall setback, and exterior color may be restricted. Reference only; confirm official restrictions with the municipal planning division.

Data source

City Planning Decision GIS Data - National Data Download Page (MLIT)

Scenic District — Screen example (with legend and click popup)
Screen example (with legend and click popup) ・Click the image to open it full size

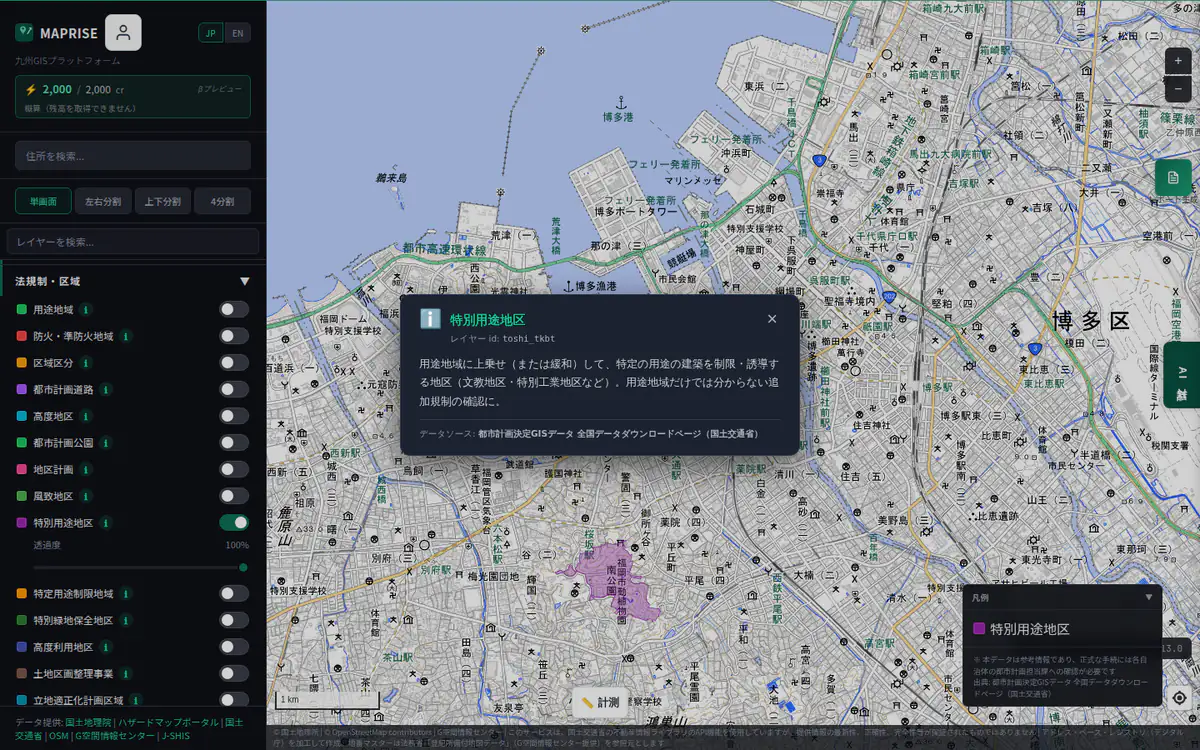
Special Use District

Related to 重説Free (partly paid plans)
Show details

Free: the area within about 10 km of each prefectural capital only. Full coverage needs Starter or above.

Overview

Districts that add to (or relax) the base use-zone to restrict or guide specific building uses (e.g. education, special industry). Check for extra rules beyond the base use zone.

Data source

City Planning Decision GIS Data - National Data Download Page (MLIT)

Special Use District — Screen example (with legend and click popup)
Screen example (with legend and click popup) ・Click the image to open it full size

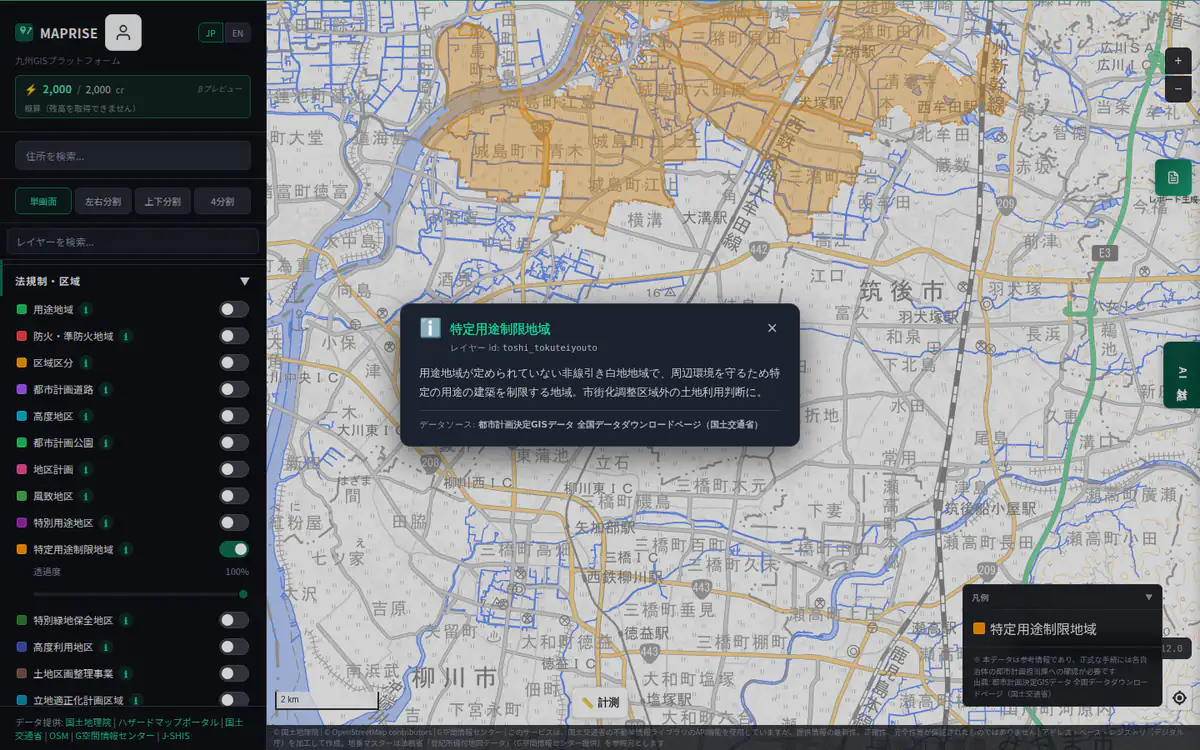
Specified Use Restriction Area

Related to 重説Free (partly paid plans)
Show details

Free: the area within about 10 km of each prefectural capital only. Full coverage needs Starter or above.

Overview

In non-zoned (white) areas without use zones, restricts specific building uses to protect the surrounding environment. Useful for land-use decisions outside urbanization-control areas.

Data source

City Planning Decision GIS Data - National Data Download Page (MLIT)

Specified Use Restriction Area — Screen example (with legend and click popup)
Screen example (with legend and click popup) ・Click the image to open it full size

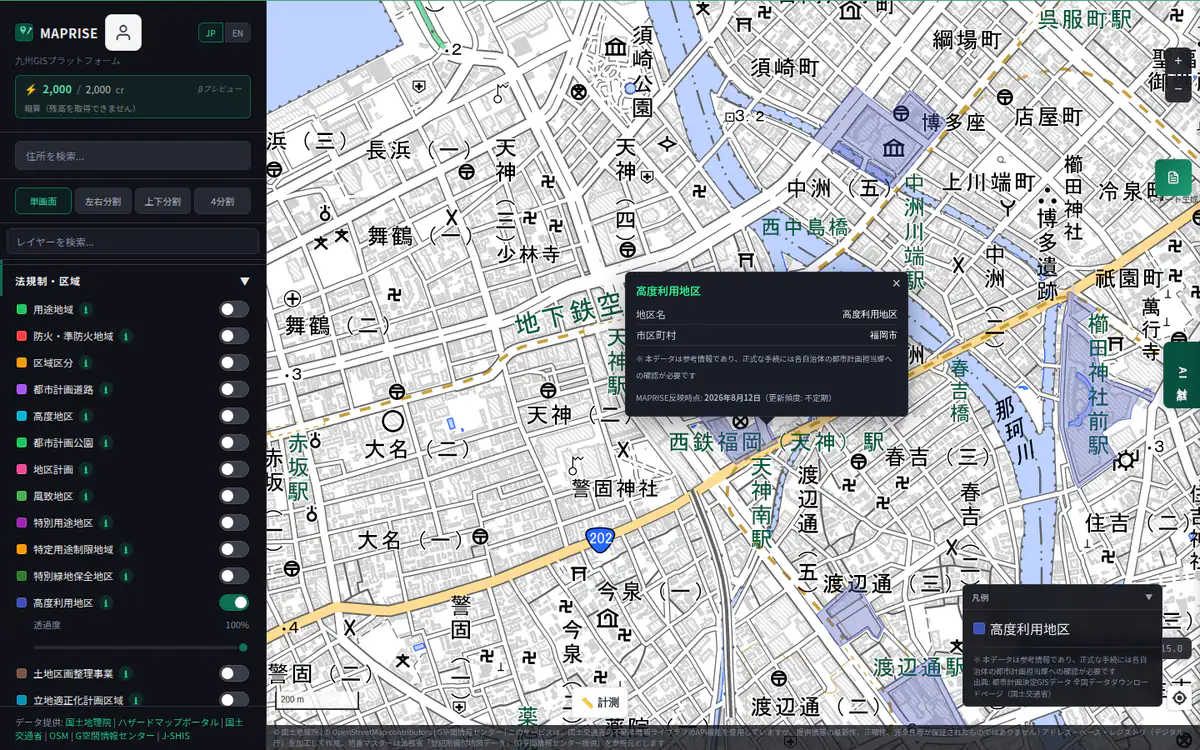
High-Rise Use District

Related to 重説Free (partly paid plans)
Show details

Free: the area within about 10 km of each prefectural capital only. Full coverage needs Starter or above.

Overview

Promotes intensive land use by setting minimum floor-area ratio, maximum building coverage, minimum building area, and wall positions. For redevelopment feasibility (distinct from Height Districts).

Data source

City Planning Decision GIS Data - National Data Download Page (MLIT)

High-Rise Use District — Screen example (with legend and click popup)
Screen example (with legend and click popup) ・Click the image to open it full size

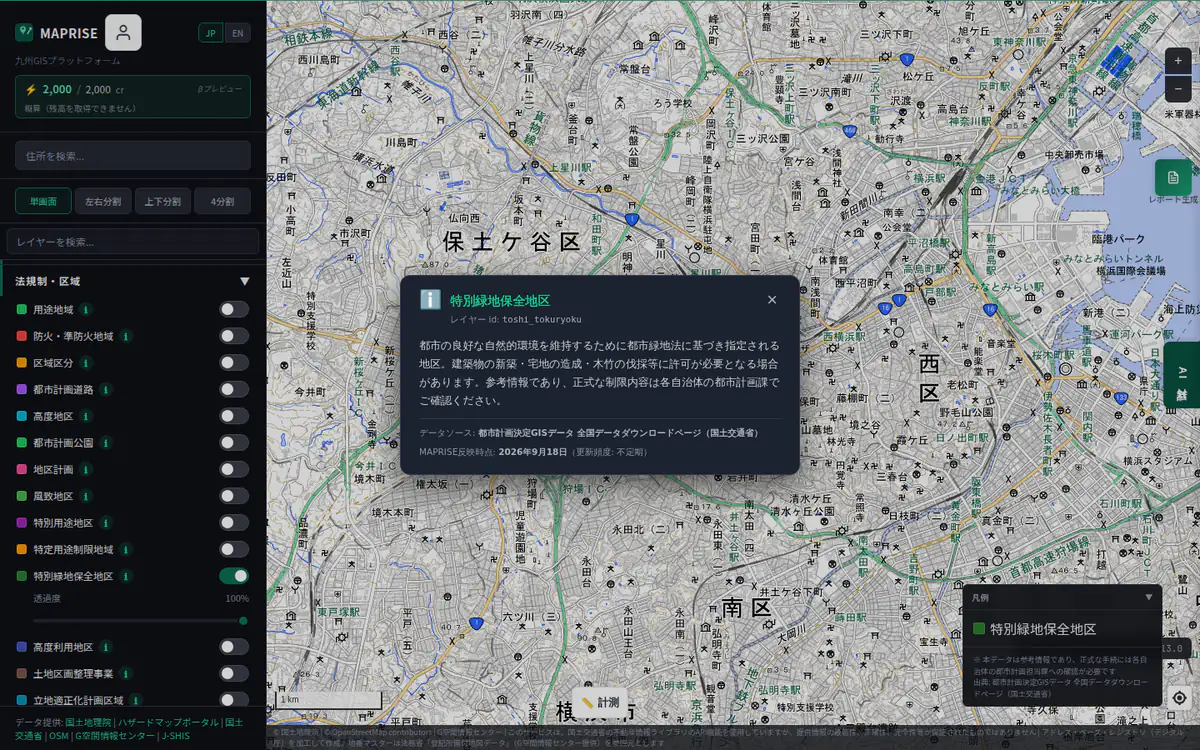
Special Greenery Conservation District

Related to 重説Free
Show details

Overview

A district designated under the Urban Green Space Conservation Act to preserve favorable natural environments in urban areas. Permits may be required for new construction, land development, or tree felling. Reference only; confirm official restrictions with the municipal planning division.

Data source

City Planning Decision GIS Data - National Data Download Page (MLIT)

Special Greenery Conservation District — Screen example (with legend and click popup)
Screen example (with legend and click popup) ・Click the image to open it full size

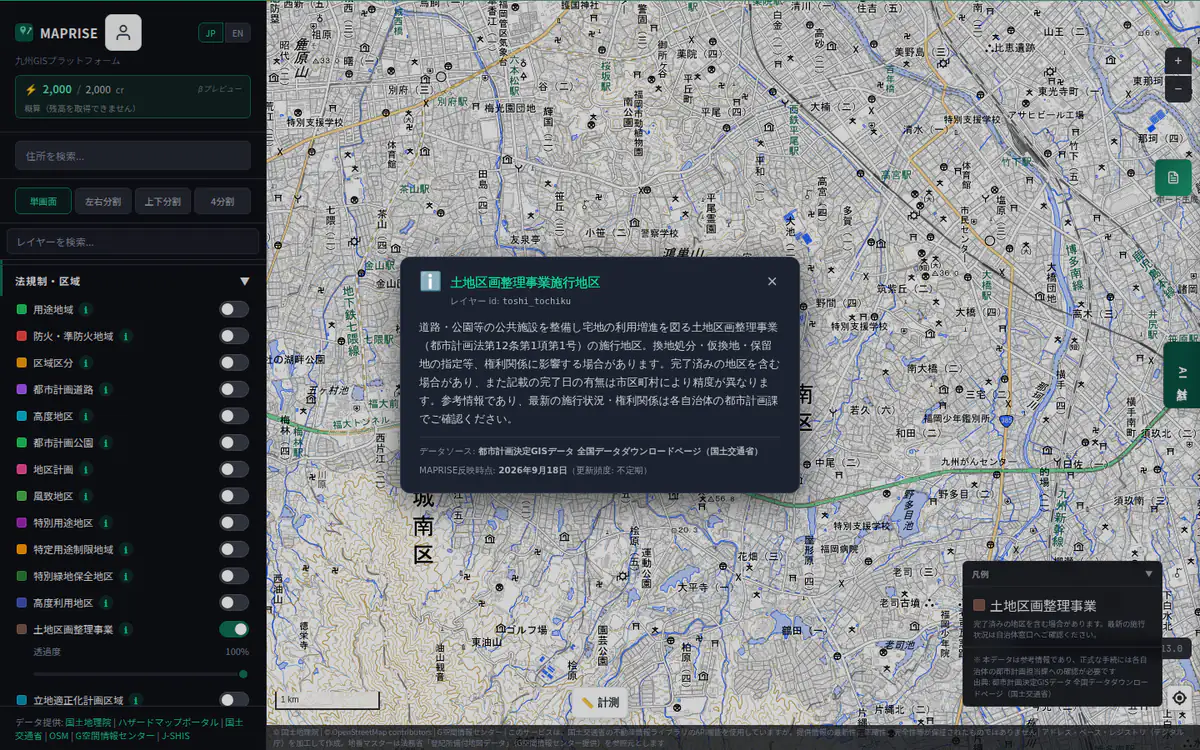
Land Readjustment Project District

Related to 重説Free (partly paid plans)
Show details

Free: the area within about 10 km of each prefectural capital only. Full coverage needs Starter or above.

Overview

Districts undergoing land readjustment projects (City Planning Act Art. 12(1)(i)) that develop roads, parks, and other public facilities while improving land utility. May affect property rights through replotting, temporary replotting, or reserved land designation. May include already-completed districts; completion-date reporting accuracy varies by municipality. Reference only; confirm current status and rights with the municipal planning division.

Data source

City Planning Decision GIS Data - National Data Download Page (MLIT)

Land Readjustment Project District — Screen example (with legend and click popup)
Screen example (with legend and click popup) ・Click the image to open it full size

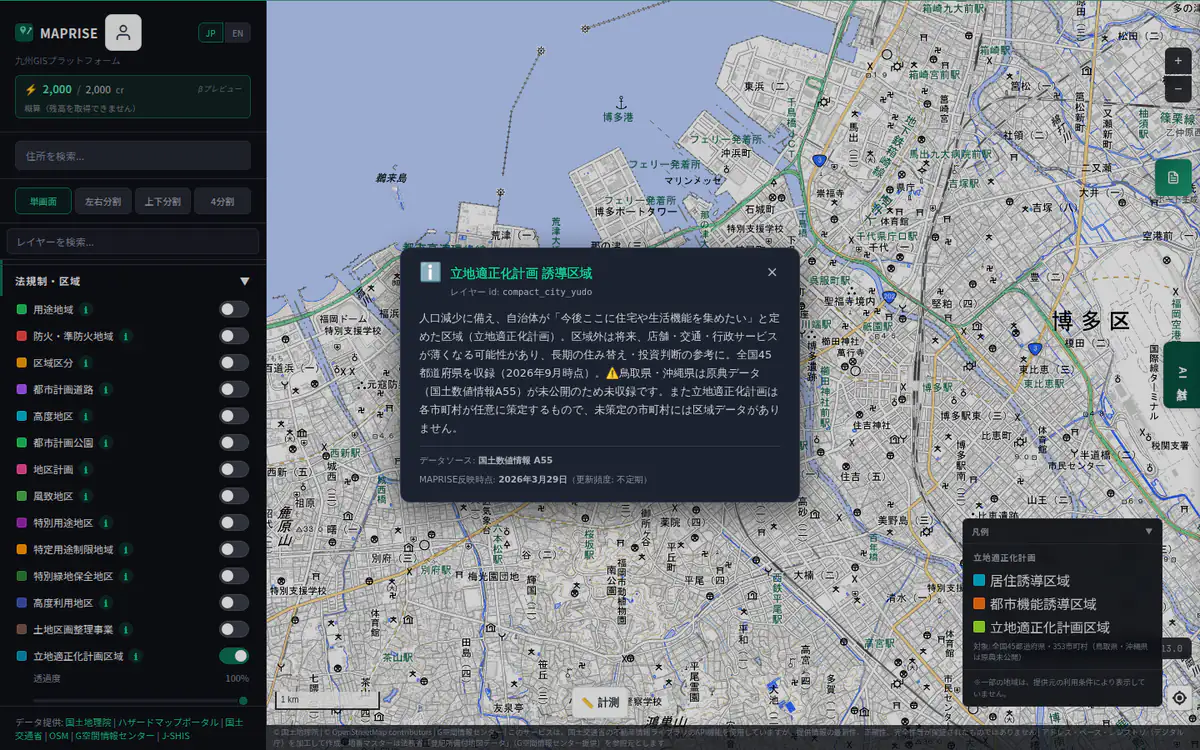
Compact City Guidance Areas

Partial coverageRelated to 重説Free
Show details
  • Tottori and Okinawa are not included because the source data is unpublished. Municipalities without a plan have no zones.

Overview

Areas the city wants to guide residential / urban functions to. Development-recommended zones. Covers 45 prefectures as of Nov 2026. Note: Tottori and Okinawa are not included (source data not yet published); municipalities that have not adopted a plan have no zone data.

Data source

KSJ A55

Compact City Guidance Areas — Screen example (with legend and click popup)
Screen example (with legend and click popup) ・Click the image to open it full size

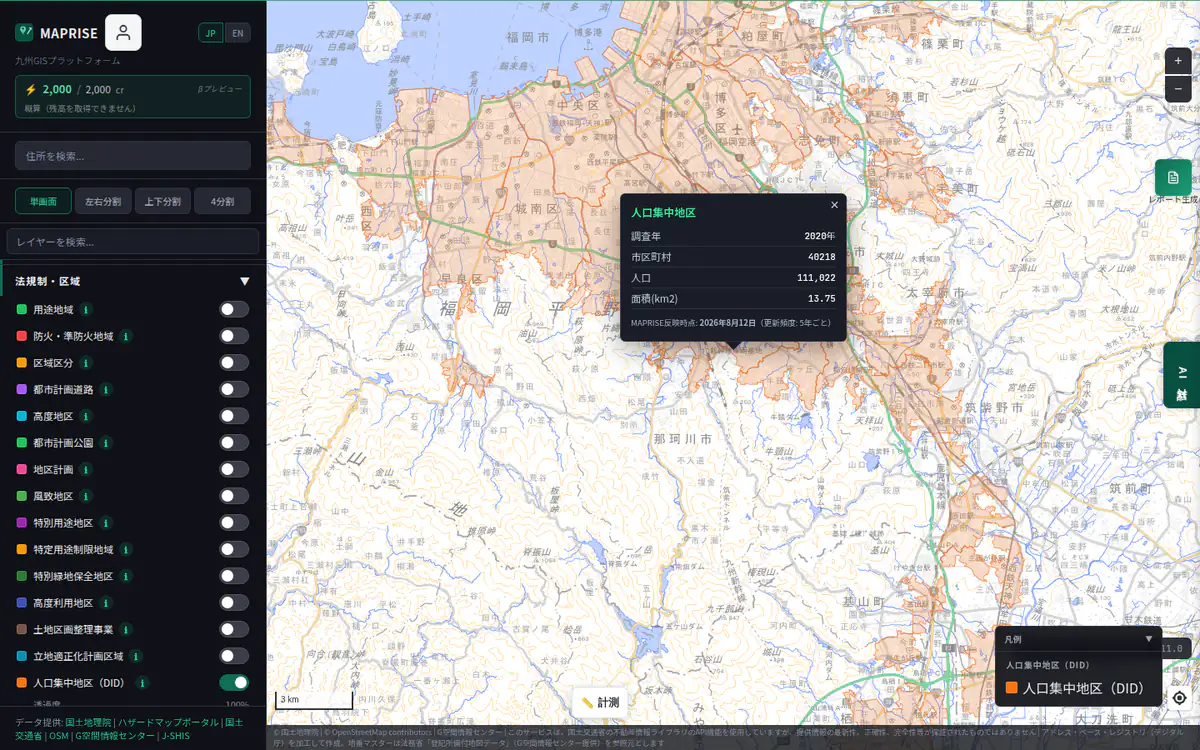
Densely Inhabited District (DID)

Time-series dataFree
Show details

Compare how DID areas expanded or shrank from 1995 to 2020 on the timeline.You can also ask the AI chat about a specific past year or compare with the past (questions without a year use the latest data).

Overview

Urban areas with population density ≥4000/km². Affects coverage ratio relaxation and drone flight rules.

Data source

KSJ A16

Densely Inhabited District (DID) — Screen example (with legend and click popup)
Screen example (with legend and click popup) ・Click the image to open it full size

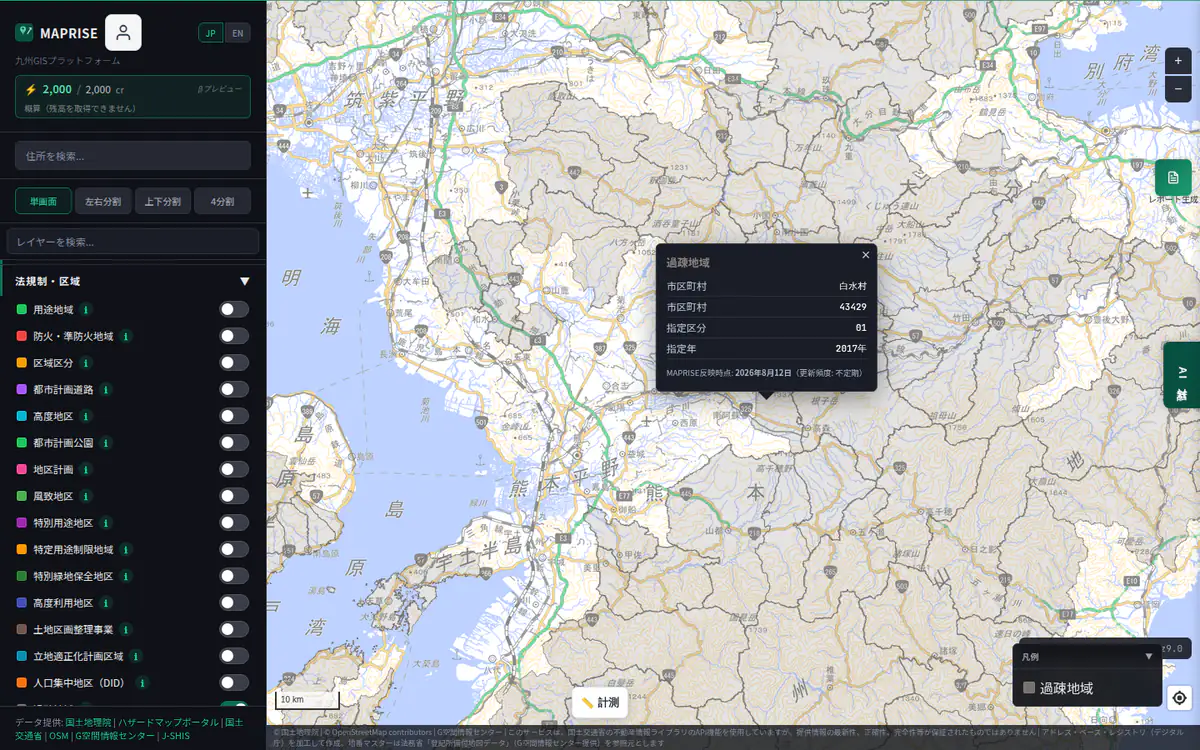
Depopulated Areas

Time-series dataFree (partly paid plans)
Show details

Compare the 2000 and 2017 designations.You can also ask the AI chat about a specific past year or compare with the past (questions without a year use the latest data).

Free: the year 2017 only. Other years need Starter or above.

Overview

Municipalities (or former municipal areas) designated as depopulated areas. Designated areas may be eligible for subsidies and tax incentives (e.g. depopulation countermeasure bonds). Designations are revised with each amendment of the law; switch the year (2000 edition / 2017 edition) with the timeline at the bottom to compare. Confirm actual eligibility with the local government.

Data source

KSJ A17

Depopulated Areas — Screen example (with legend and click popup)
Screen example (with legend and click popup) ・Click the image to open it full size

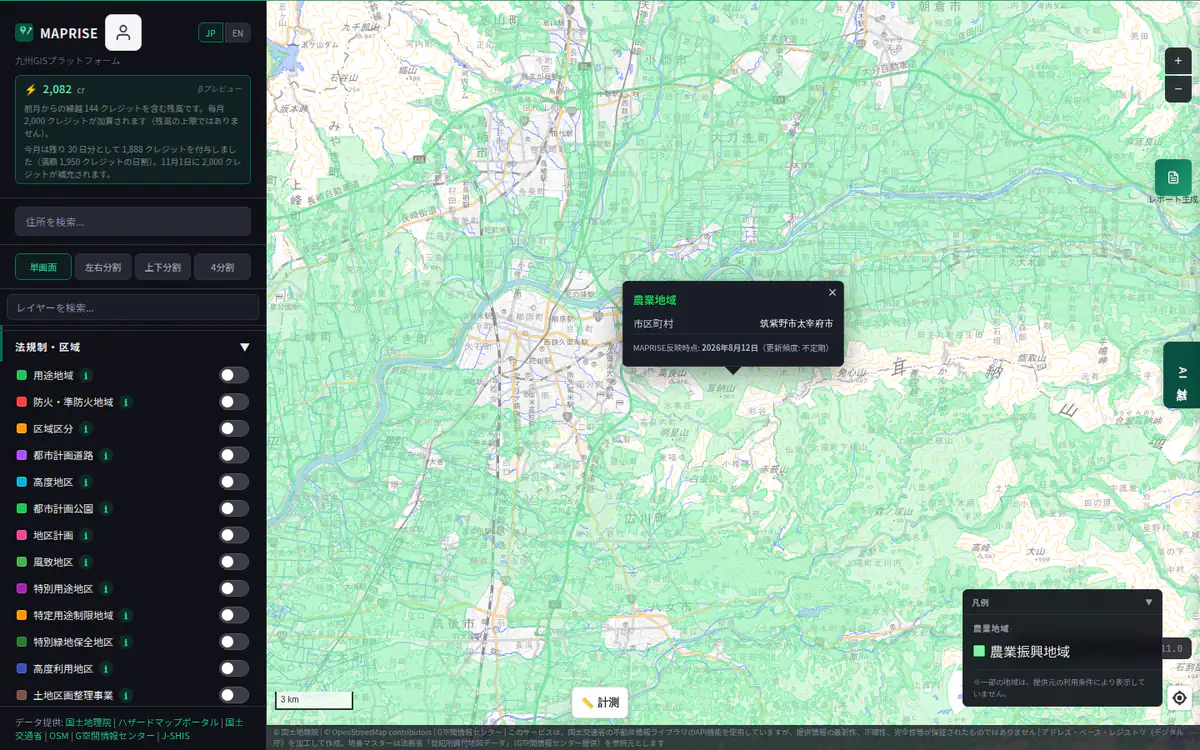
Agricultural Areas

Related to 重説Free
Show details

Overview

Subject to Agricultural Promotion Plan. Conversion requires Agricultural Committee approval. Critical for land acquisition.

Data source

KSJ A12

Agricultural Areas — Screen example (with legend and click popup)
Screen example (with legend and click popup) ・Click the image to open it full size

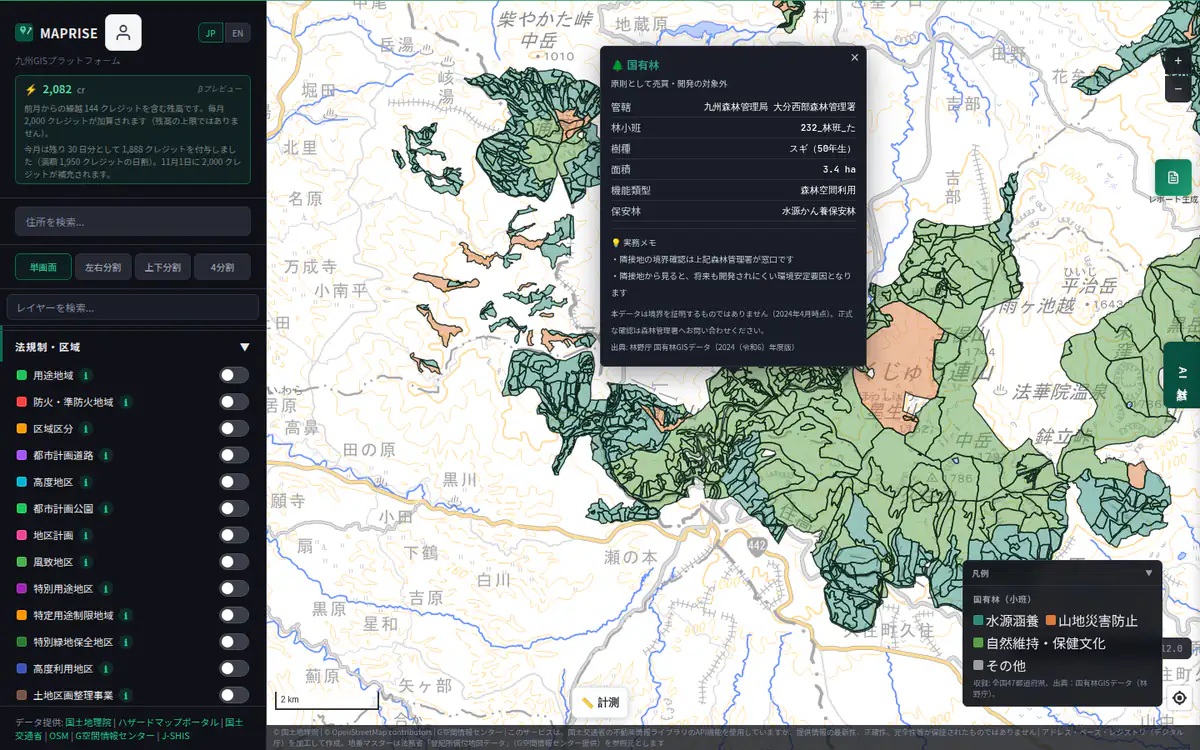
National Forest (Sub-compartments)

Related to 重説Free (partly paid plans)
Show details

Free: the area within about 10 km of each prefectural capital only. Full coverage needs Starter or above.

Overview

Sub-compartment parcels of National Forests managed by the Forestry Agency (~972,000 records, all 47 prefectures as of Nov 2026). Generally not available for purchase or development; boundary confirmation for adjacent land is handled by the District Forest Office. For neighboring properties, it can also be a stabilizing factor since future development is unlikely. Useful for excluding land from acquisition targets, checking adjacent-parcel risk in collateral appraisal, and confirming surroundings before purchasing forest or vacation land. Unlike the reference-grade subdivision in the Forest Zone layer, this is the Forestry Agency's authoritative source (as of April 2024). Source: Forestry Agency, National Forest GIS Data (FY2024)

Data source

Forestry Agency, National Forest GIS Data (FY2024)

National Forest (Sub-compartments) — Screen example (with legend and click popup)
Screen example (with legend and click popup) ・Click the image to open it full size

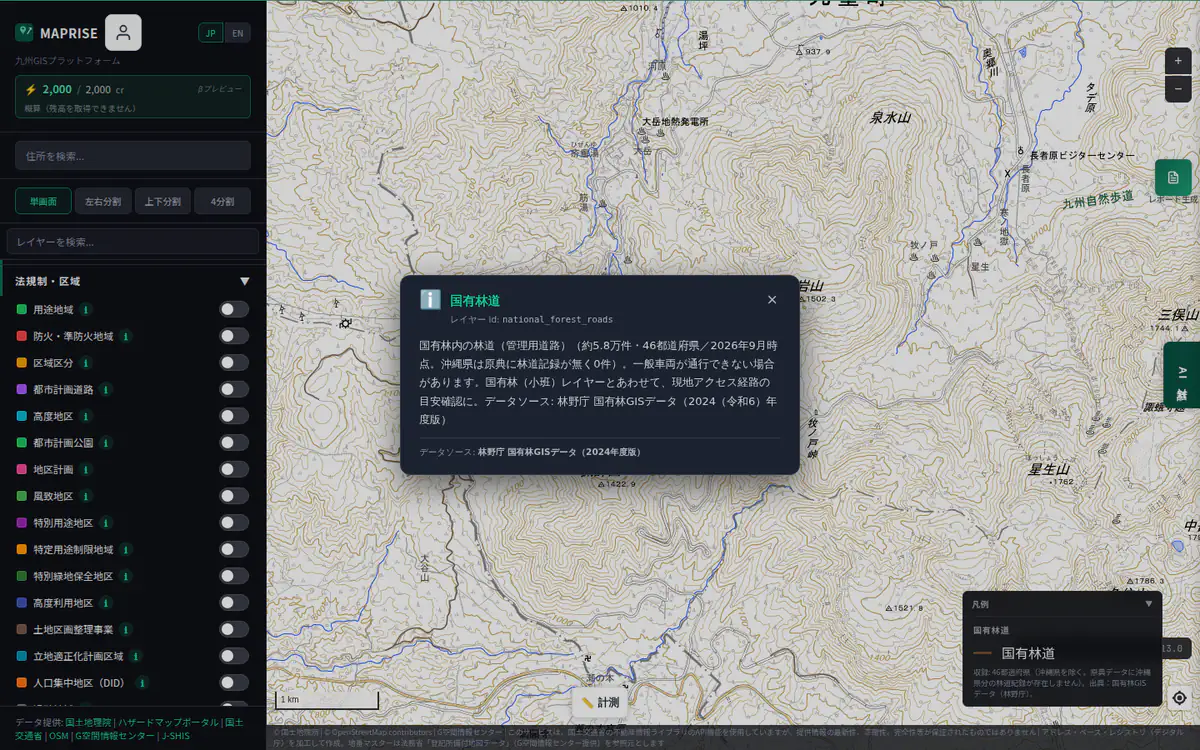
National Forest Roads

Free (partly paid plans)
Show details

Free: the area within about 10 km of each prefectural capital only. Full coverage needs Starter or above.

Overview

Forest roads within National Forests (management access roads; ~58,000 records, 46 prefectures as of Nov 2026 — Okinawa has no forest-road records in the source). General vehicle access may be restricted. Use alongside the National Forest (Sub-compartments) layer to gauge site-access routes. Source: Forestry Agency, National Forest GIS Data (FY2024)

Data source

Forestry Agency, National Forest GIS Data (FY2024)

National Forest Roads — Screen example (with legend and click popup)
Screen example (with legend and click popup) ・Click the image to open it full size

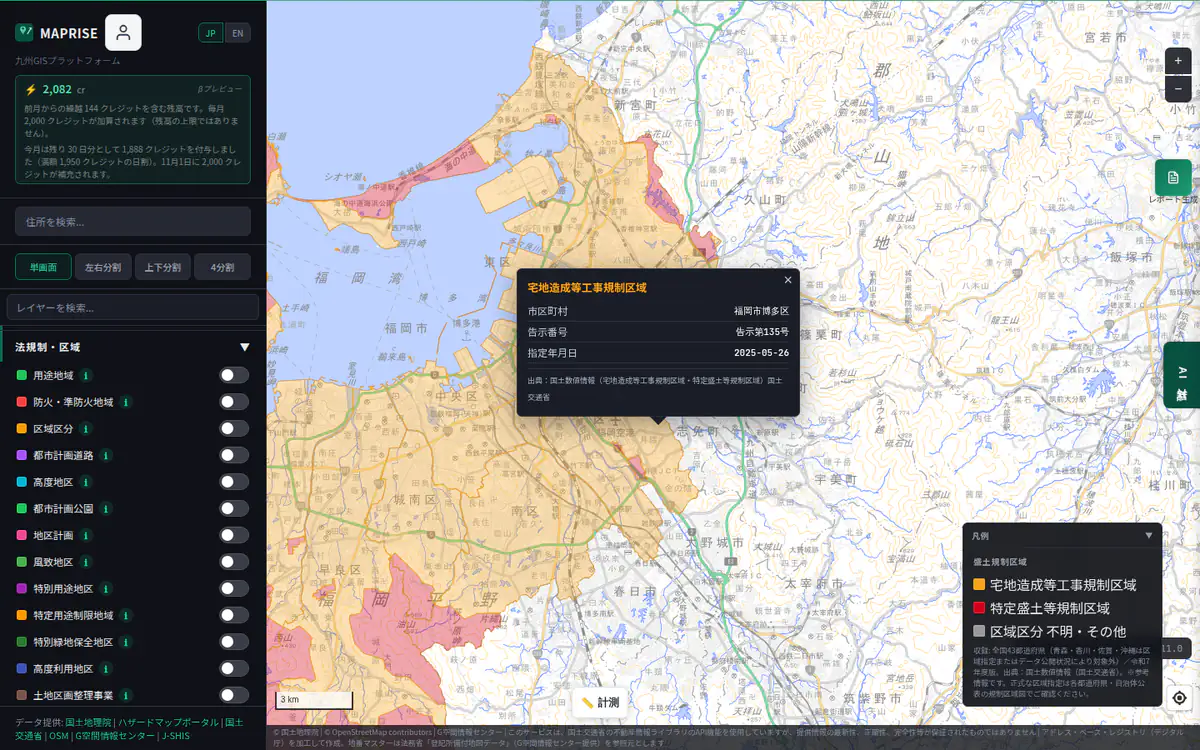
Fill Regulation Zones

Related to 重説Free (partly paid plans)
Show details

Free: the area within about 10 km of each prefectural capital only. Full coverage needs Starter or above.

Overview

Regulation zones designated under the Fill Regulation Act (in force May 2023). Within these zones, fills, cuts or soil stockpiling above a certain scale require prior permit/notification — useful for judging land-development feasibility. Three types: residential-land development regulation area (inhabited areas), specified-fill regulation area (slopes that could endanger homes), and unknown (indeterminable from source). Coverage: 43 prefectures nationwide (Aomori, Kagawa, Saga and Okinawa are not published by National Land Numerical Information). FY2025 edition. Note: in Kyushu's mountainous terrain, specified-fill regulation areas (red) cover more total area than residential-land development areas (amber), especially in Kumamoto, Oita, Miyazaki and Kagoshima — only Fukuoka is dominated by the latter.

Data source

National Land Numerical Information (Fill Regulation Zones), MLIT

Fill Regulation Zones — Screen example (with legend and click popup)
Screen example (with legend and click popup) ・Click the image to open it full size

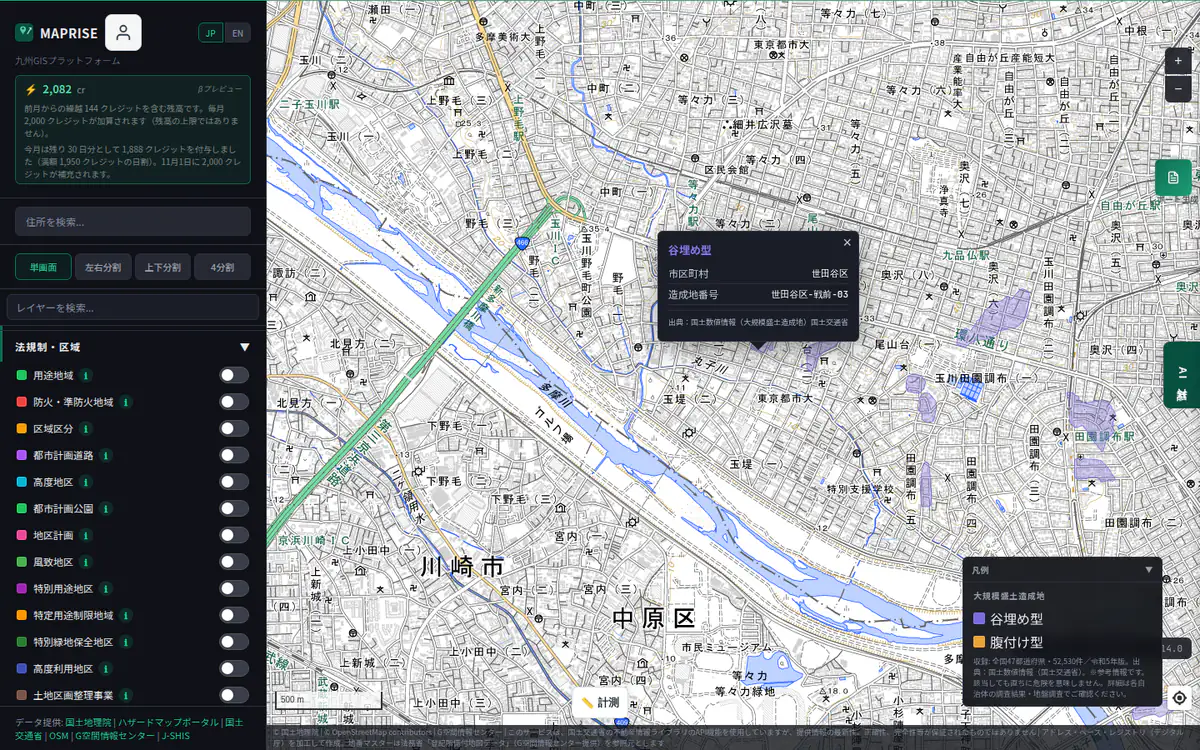
Large-scale Filled Land

Related to 重説Free (partly paid plans)
Show details

Free: the area within about 10 km of each prefectural capital only. Full coverage needs Starter or above.

Overview

Existing residential land previously created by filling valleys or slopes. Distinct from fill-regulation zones — it shows the ground risk of existing filled land (potential for seismic slide-collapse; damage was confirmed in the Kumamoto earthquake). Useful for build-feasibility and ground-improvement cost estimates. Two types: valley-fill (filling valleys/ravines) and slope-fill (fill added onto a slope). Coverage: all 47 prefectures nationwide (52,530 records). 2023 edition.

Data source

National Land Numerical Information (Large-scale Filled Land), MLIT

Large-scale Filled Land — Screen example (with legend and click popup)
Screen example (with legend and click popup) ・Click the image to open it full size

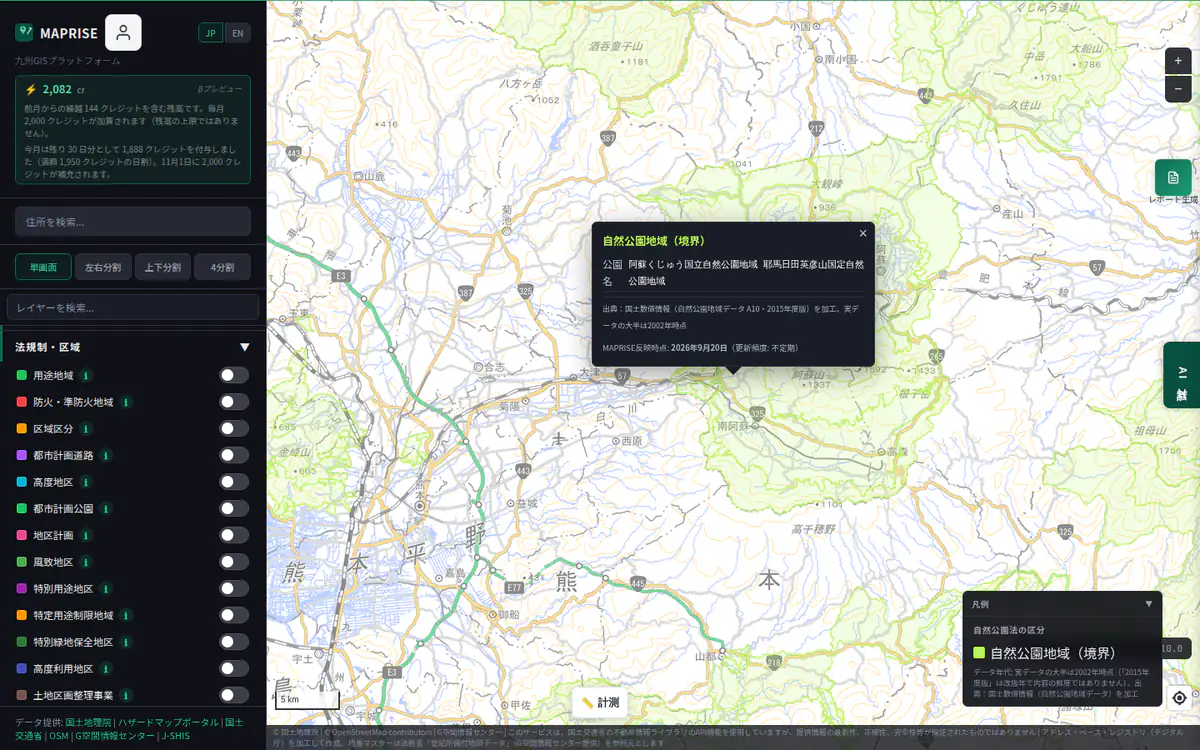
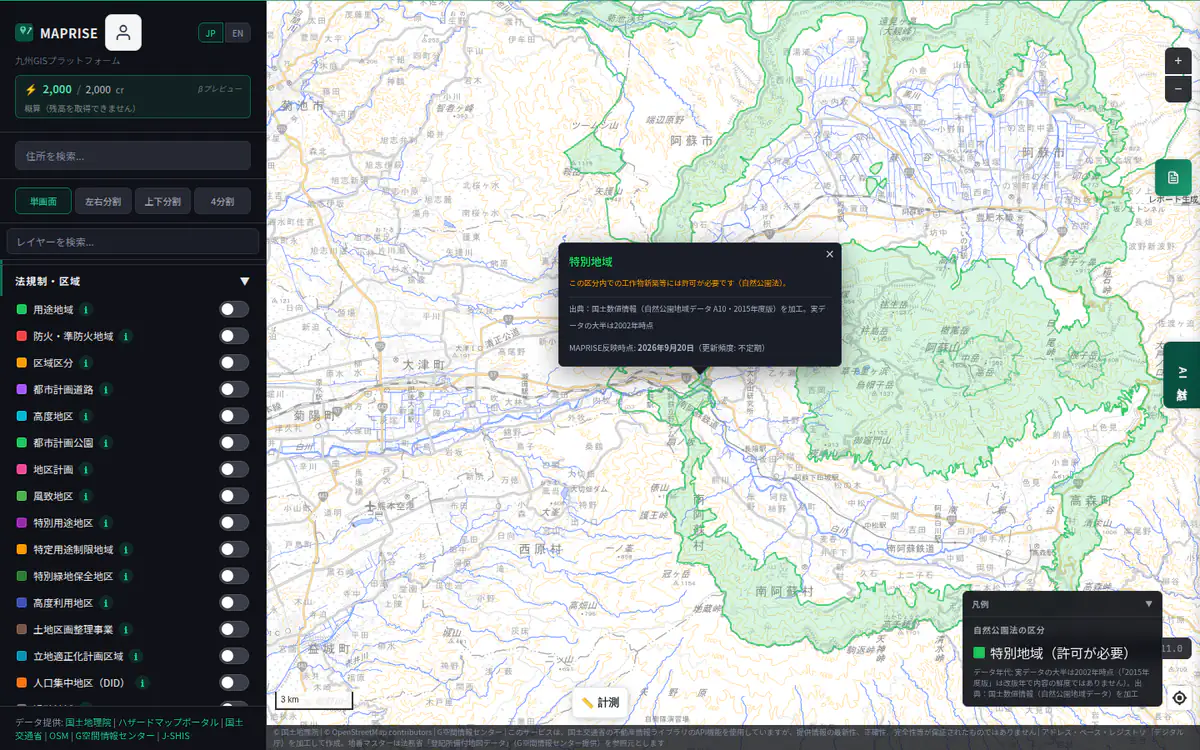
Natural Park Area (Boundary)

Partial coverageRelated to 重説Free
Show details
  • Okayama is excluded because its source data is non-commercial only (46 prefectures).

Overview

The overall boundary of a National Park, Quasi-National Park, or Prefectural Natural Park designated under the Natural Parks Act. Within this boundary, land is further classified as Special Area, Special Protection District, or Ordinary Area (this layer alone does not show that classification — see the separate layers). Warning: based on National Land Numerical Information (Natural Park Areas, FY2015 edition). Covers 46 of the 47 prefectures (Okayama is excluded because its records are licensed non-commercial only); more than half of the source records (61.6%) date to 2002, and "FY2015 edition" refers to the release year, not data freshness. Confirm current designation status with the prefecture or the Ministry of the Environment regional office.

Data source

Processed from National Land Numerical Information "Natural Park Areas" (MLIT, CC BY 4.0)

Natural Park Area (Boundary) — Screen example (with legend and click popup)
Screen example (with legend and click popup) ・Click the image to open it full size

Natural Parks Act: Special Area

Partial coverageRelated to 重説Free (partly paid plans)
Show details
  • Okayama is excluded because its source data is non-commercial only (46 prefectures).

Free: park boundaries only. Zone classes (special, special protection, ordinary) need Starter or above.

Overview

A Special Area under Natural Parks Act Art. 20-3. Activities such as new construction, tree felling, and mineral extraction listed in that article require a permit (from the Minister of the Environment for National Parks, or the prefectural governor for Quasi-National Parks). This is a mandatory disclosure item under Real Estate Brokerage Act Enforcement Order Art. 3-1-31. Covers 46 of the 47 prefectures (Okayama excluded). Warning: same data precision/vintage caveats as the "Natural Park Area (Boundary)" layer. Confirm applicability and permit requirements with the prefecture or the Ministry of the Environment regional office.

Data source

Processed from National Land Numerical Information "Natural Park Areas" (MLIT, CC BY 4.0)

Natural Parks Act: Special Area — Screen example (with legend and click popup)
Screen example (with legend and click popup) ・Click the image to open it full size

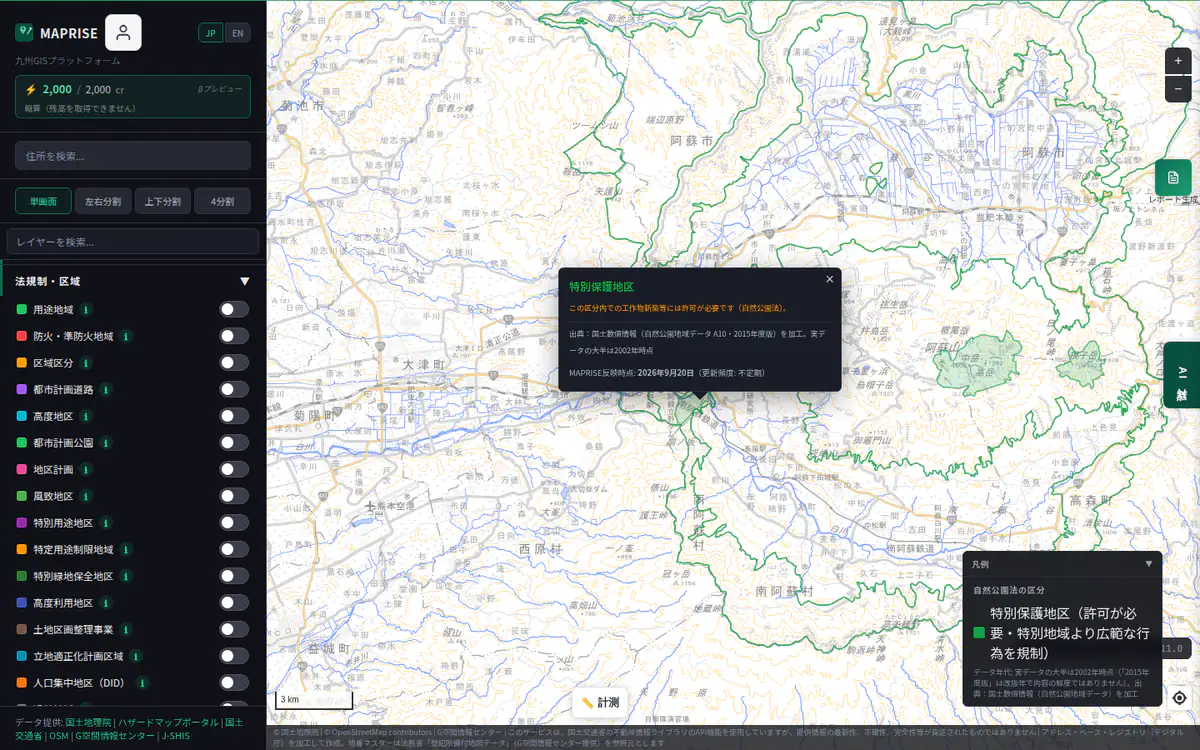
Natural Parks Act: Special Protection District

Partial coverageRelated to 重説Free (partly paid plans)
Show details
  • Okayama is excluded because its source data is non-commercial only (46 prefectures).

Free: park boundaries only. Zone classes (special, special protection, ordinary) need Starter or above.

Overview

A Special Protection District under Natural Parks Act Art. 21-3 — the most strictly regulated classification within a park, where an even broader range of activities (including collecting plants/animals and setting fires) requires a permit than in a Special Area. This is a mandatory disclosure item under Real Estate Brokerage Act Enforcement Order Art. 3-1-31. Covers 46 of the 47 prefectures (Okayama excluded). Warning: same data precision/vintage caveats as the "Natural Park Area (Boundary)" layer. Confirm applicability and permit requirements with the prefecture or the Ministry of the Environment regional office.

Data source

Processed from National Land Numerical Information "Natural Park Areas" (MLIT, CC BY 4.0)

Natural Parks Act: Special Protection District — Screen example (with legend and click popup)
Screen example (with legend and click popup) ・Click the image to open it full size

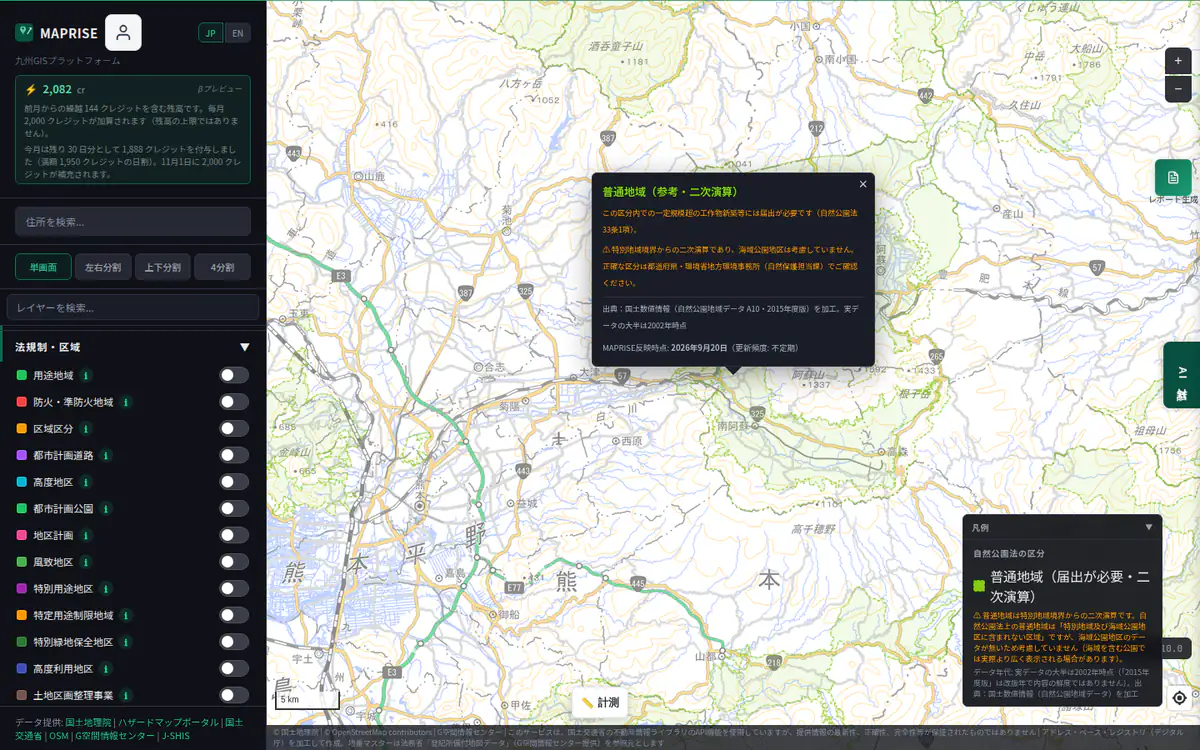
Natural Parks Act: Ordinary Area (Reference, Derived)

Partial coverageEstimateRelated to 重説Free (partly paid plans)
Show details
  • Okayama is excluded because its source data is non-commercial only (46 prefectures).
  • The source has no such class; this is a reference derived by removing special areas from the park area.

Free: park boundaries only. Zone classes (special, special protection, ordinary) need Starter or above.

Overview

The Ordinary Area under Natural Parks Act Art. 33-1 is defined as "the area not included in the Special Area or the Marine Park District." Notification (not a permit) is required for new structures etc. above a certain size. This is a mandatory disclosure item under Real Estate Brokerage Act Enforcement Order Art. 3-1-31. Important: this layer is a MAPRISE-derived reference computed by subtracting the Special Area from the Natural Park Area boundary and clipping to land using administrative boundaries — it is not a polygon from the original source. Marine Park District data (Art. 22-3) is unavailable and therefore not accounted for, so in parks that include marine areas this layer may show a larger area than the actual Ordinary Area. Confirm the exact zoning with the prefecture or the Ministry of the Environment regional office.

Data source

Derived by Vulcanz LLC from National Land Numerical Information "Natural Park Areas" (MLIT, CC BY 4.0)

Natural Parks Act: Ordinary Area (Reference, Derived) — Screen example (with legend and click popup)
Screen example (with legend and click popup) ・Click the image to open it full size

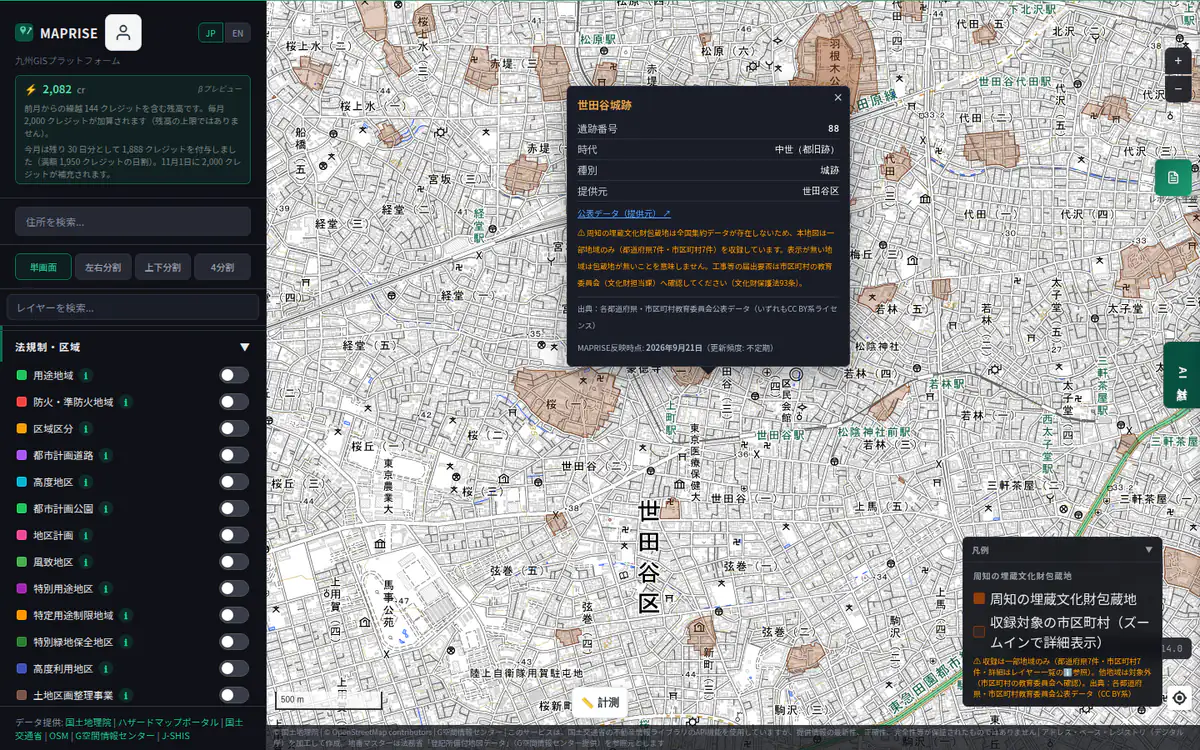
Known Buried Cultural Property Sites (Partial Coverage)

Partial coverageRelated to 重説Free
Show details
  • No nationwide public data exists; only areas with commercially usable open data are included (8 prefectures and 8 municipalities). No display does not mean there are no sites.

Overview

Shows "known buried cultural property sites" (kofun, castle remains, settlement remains, etc.) where earthwork requires notifying the Board of Education at least 60 days before starting (Cultural Properties Protection Act Art. 93). This is a mandatory disclosure item under Real Estate Brokerage Act Enforcement Order Art. 3-1-52. Warning: no nationwide dataset covers this theme. This layer covers only the areas where commercially usable open data was found (8 prefectures + 8 municipalities, 74,000+ records total). See the data sources page for exactly which municipalities are covered. Warning: when zoomed out, covered municipalities are shown as a light shaded overview instead of the actual sites (zooming in switches to the individual site boundaries). The absence of a polygon elsewhere does NOT mean no site exists there — check with the municipal Board of Education (Cultural Properties Division) for areas outside this coverage.

Data source

Published data from each prefecture/municipal Board of Education (CC BY family licenses; see the data sources page for exact sources)

Known Buried Cultural Property Sites (Partial Coverage) — Screen example (with legend and click popup)
Screen example (with legend and click popup) ・Click the image to open it full size

Important Land Survey Zones (Watch / Special Watch)

Related to 重説Free (partly paid plans)
Show details

Free: the area within about 10 km of each prefectural capital only. Full coverage needs Starter or above.

Overview

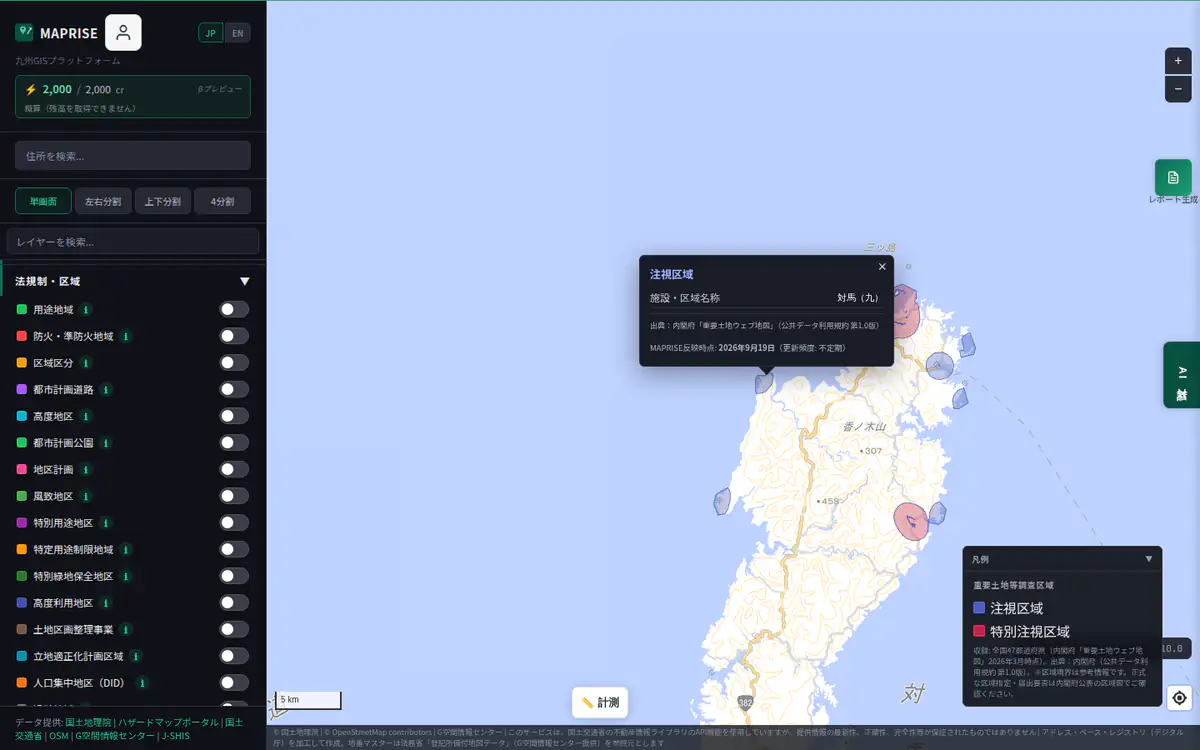
Zones where the national government reviews and regulates the use of land and buildings around security-critical facilities (SDF and Japan Coast Guard installations) and border islands, under the Act on the Review and Regulation of the Use of Real Estate around Important Facilities and Border Islands (in force Sept 2022). Two tiers: the less-restricted Watch Zone (blue) and the more strictly regulated Special Watch Zone (red). In a Special Watch Zone, selling, buying or leasing land/buildings of 200 sq m or more requires advance notification of the parties' names, nationality and intended use to the Cabinet Office before the contract (Art. 14). Essential for confirming transaction feasibility and procedures near bases, SDF/Coast Guard facilities, or border islands. Covers all 47 prefectures nationwide (586 records as of Nov 2026; 152 of them in the 7 Kyushu prefectures).

Data source

Cabinet Office "Important Land Web Map" (Public Data Utilization License v1.0)

Important Land Survey Zones (Watch / Special Watch) — Screen example (with legend and click popup)
Screen example (with legend and click popup) ・Click the image to open it full size

Soil Contamination Act Designated Zones

EstimateRelated to 重説Free (partly paid plans)
Show details
  • Points are representative positions estimated from published addresses; they do not show the exact shape or boundary of a zone.

Free: the area within about 10 km of each prefectural capital only. Full coverage needs Starter or above.

Overview

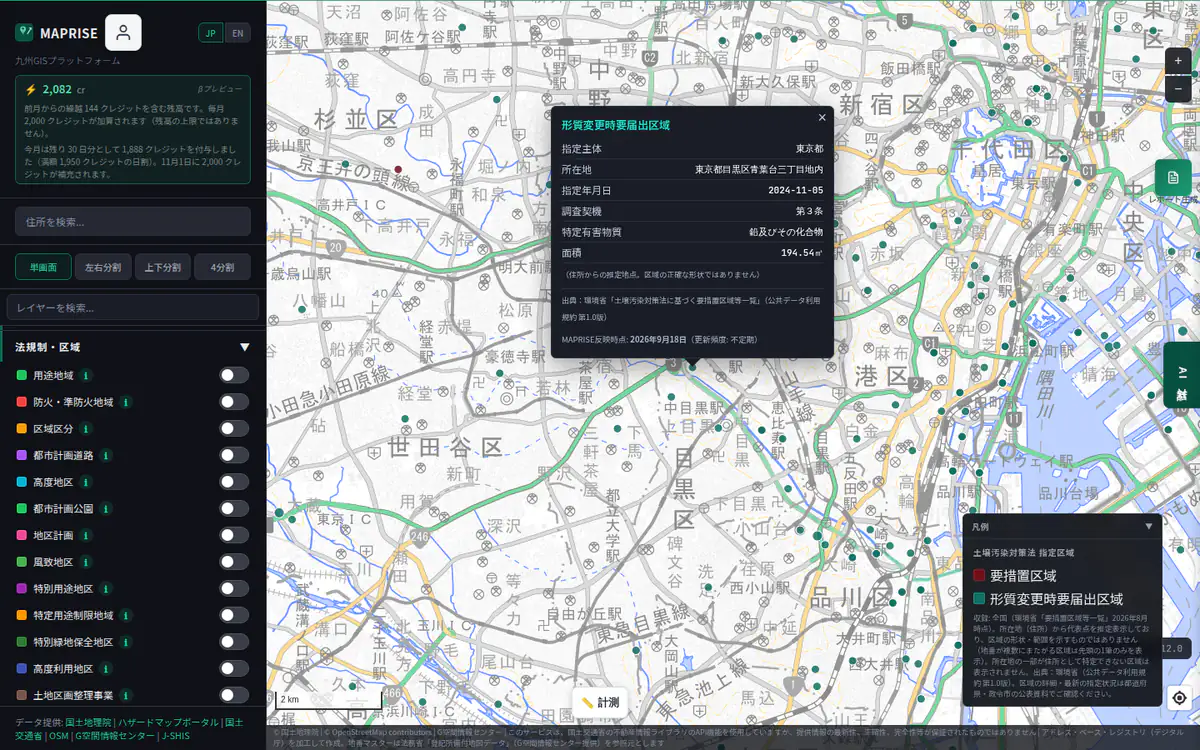
Areas with confirmed soil contamination, designated by prefectural governors or ordinance-designated city mayors under the Soil Contamination Countermeasures Act. Two categories: Remediation-Required Zone (red — a health risk exists and cleanup measures are mandatory) and Notification-Required Zone for Land Form Change (orange — no immediate health risk, but prior notification is required before excavation or other land-form changes). Directly affects whether land can be transacted or developed, and remediation/ground-improvement cost estimates. Covers all 47 prefectures: of the 4,907 nationwide records in the Ministry of the Environment consolidated dataset (as of Aug 31, 2026), the 3,208 whose address could be located to the lot or block level are shown on the map. Zones located only to the town level, or not located at all, are not shown. The absence of a point does not mean there is no designated zone. Warning: points are representative locations geocoded from the published address (lot number / cho-chome level), not the exact zone shape or boundary.

Data source

Ministry of the Environment, "List of Designated Zones under the Soil Contamination Countermeasures Act" (Public Data Utilization License v1.0)

Soil Contamination Act Designated Zones — Screen example (with legend and click popup)
Screen example (with legend and click popup) ・Click the image to open it full size

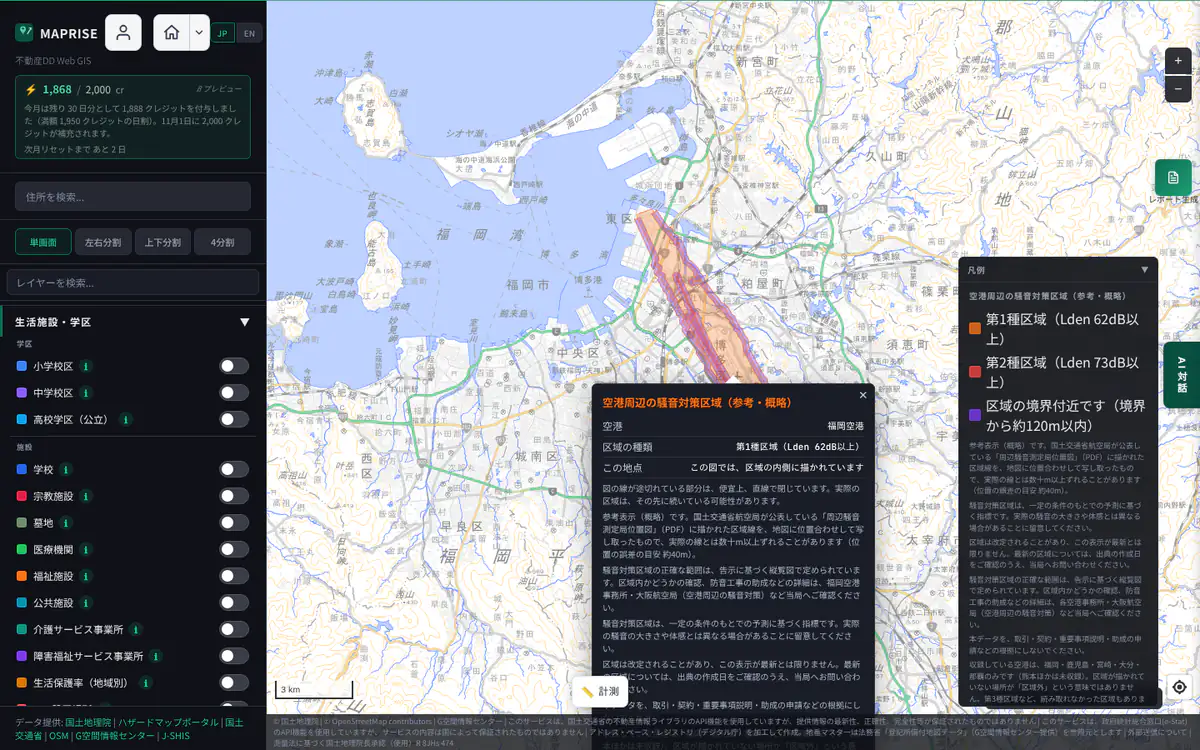
Aviation Act Restriction Surfaces (Airport Vicinity Airspace)

Related to 重説Free (partly paid plans)
Show details

Free: the area within about 10 km of each prefectural capital only. Full coverage needs Starter or above.

Overview

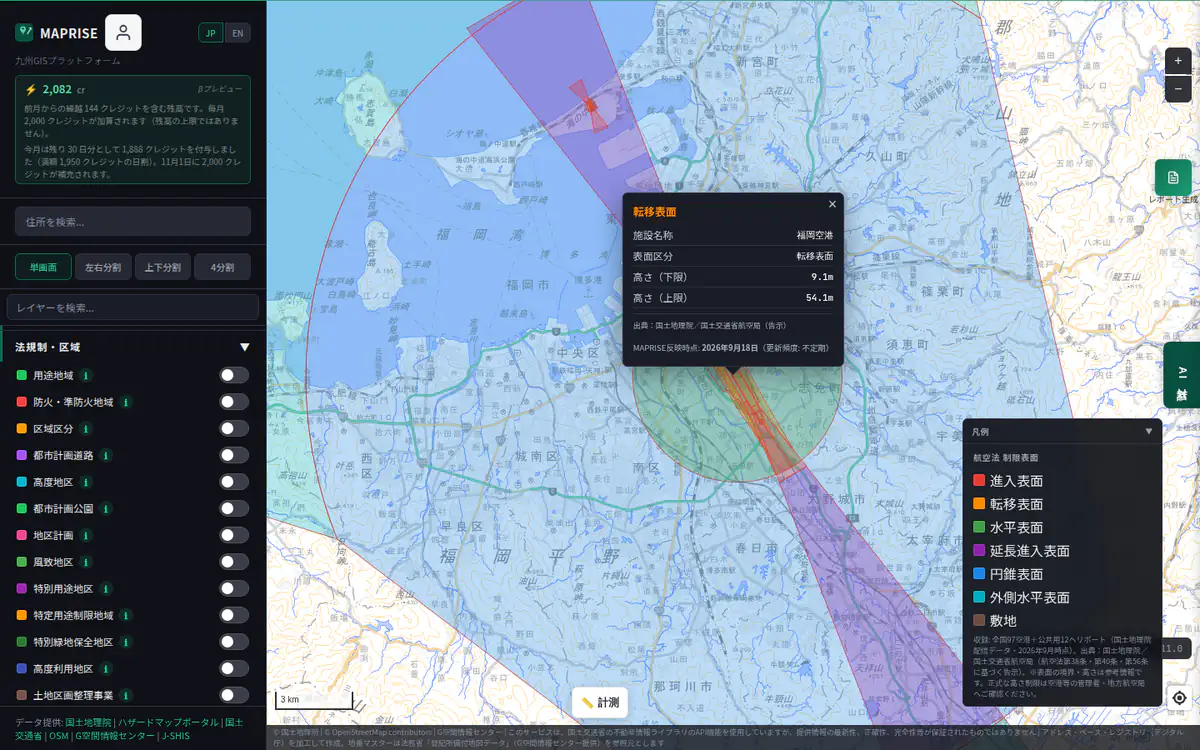
Airspace around airports and heliports where building height is restricted to keep aircraft approach and departure safe, designated under Aviation Act Art. 38, 40 and 56. Color-coded by surface type (approach, transitional, horizontal, extended approach, conical, outer horizontal, site). The allowed height varies by surface type and location. Heights shown are all above sea level; for sloped surfaces (approach, transitional, extended approach, conical) the values are the range for the whole zone, not the limit at the point you clicked. Any building, tower or antenna planned near an airport must be checked in advance with the regional Civil Aviation Bureau or airport operator. It is also a rough guide to the airport-vicinity-airspace drone restriction, but does not exactly match the regulated airspace; check the MLIT DIPS site before any drone flight. Covers all 97 official airports plus 12 public-use heliports nationwide (109 facilities, 586 polygons) as of Nov 2026.

Data source

Geospatial Information Authority of Japan, "kokuarea" layer (public notice under the Aviation Act)

Aviation Act Restriction Surfaces (Airport Vicinity Airspace) — Screen example (with legend and click popup)
Screen example (with legend and click popup) ・Click the image to open it full size

Land Use Mesh

Time-series dataFree
Show details

Switch between 9 points in time (1976–2021) to see how land use changed.You can also ask the AI chat about a specific past year or compare with the past (questions without a year use the latest data).

Overview

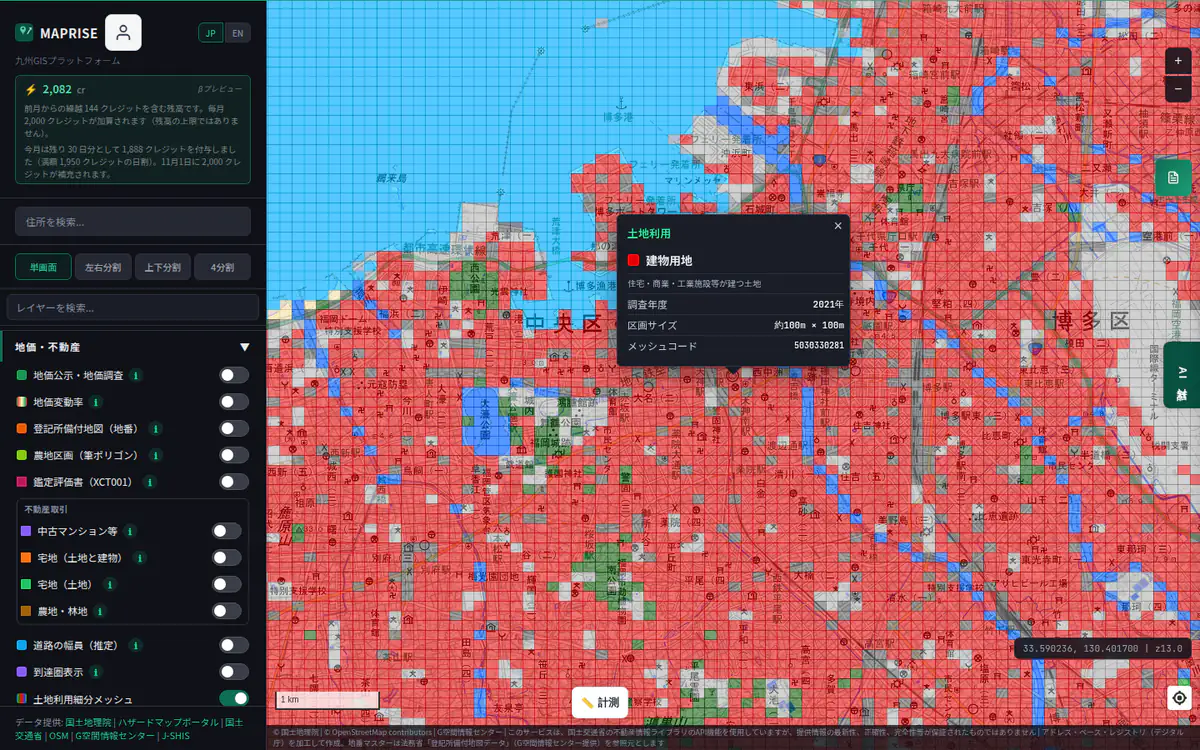
Land use classification by 100m mesh (1976-2021, 9 timepoints). View changes via timeline.

Data source

KSJ L03-b

Land Use Mesh — Screen example (with legend and click popup)
Screen example (with legend and click popup) ・Click the image to open it full size

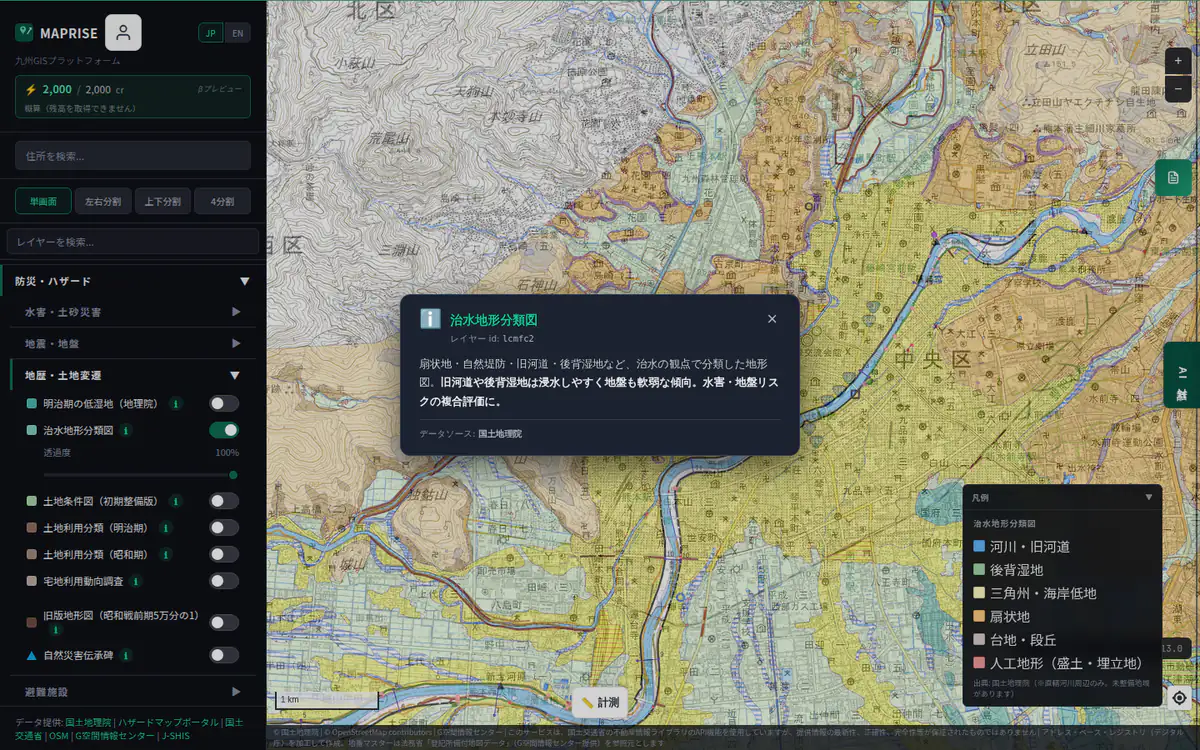
Flood Control Geomorphology

Starter and above
Show details

Overview

Landform classification for flood control: alluvial fans, natural levees, former river channels, back marshes. Former channels and marshes are flood-prone with soft ground.

Data source

GSI Japan

Flood Control Geomorphology — Screen example (with legend and click popup)
Screen example (with legend and click popup) ・Click the image to open it full size

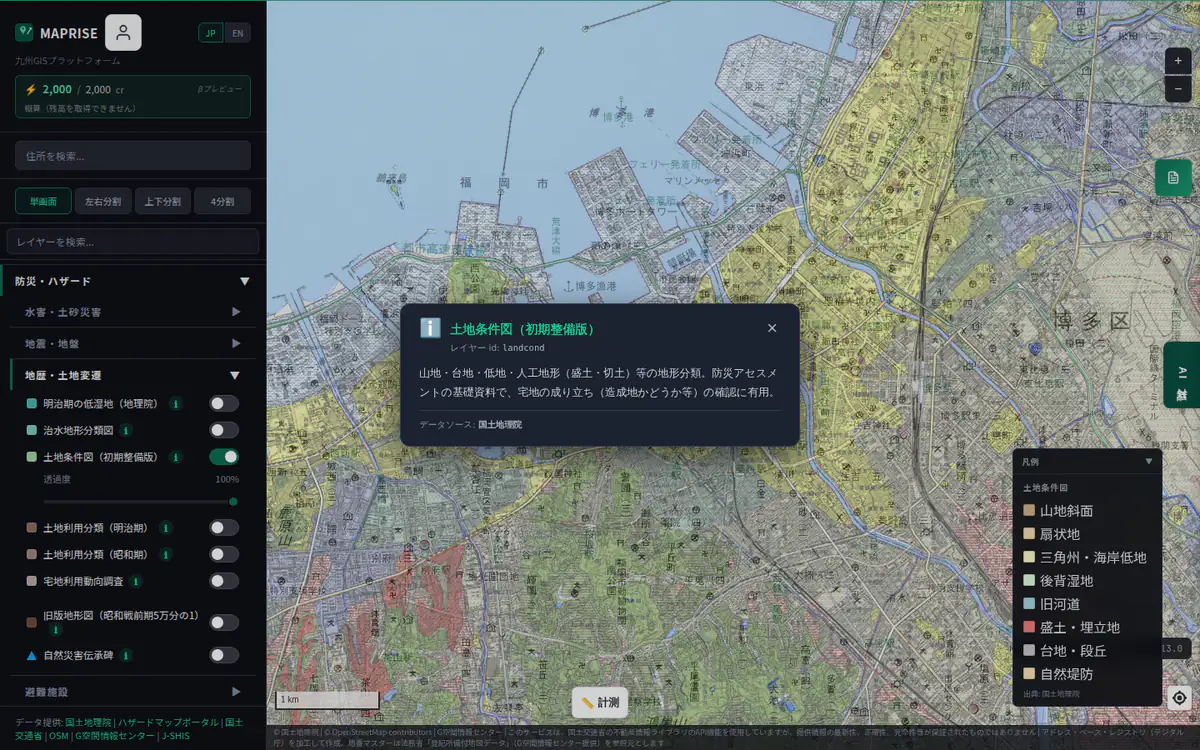
Land Condition Map

Starter and above
Show details

Overview

Landform classification: mountains, plateaus, lowlands, artificial landforms (fill/cut). Foundation for disaster assessment and identifying developed land.

Data source

GSI Japan

Land Condition Map — Screen example (with legend and click popup)
Screen example (with legend and click popup) ・Click the image to open it full size

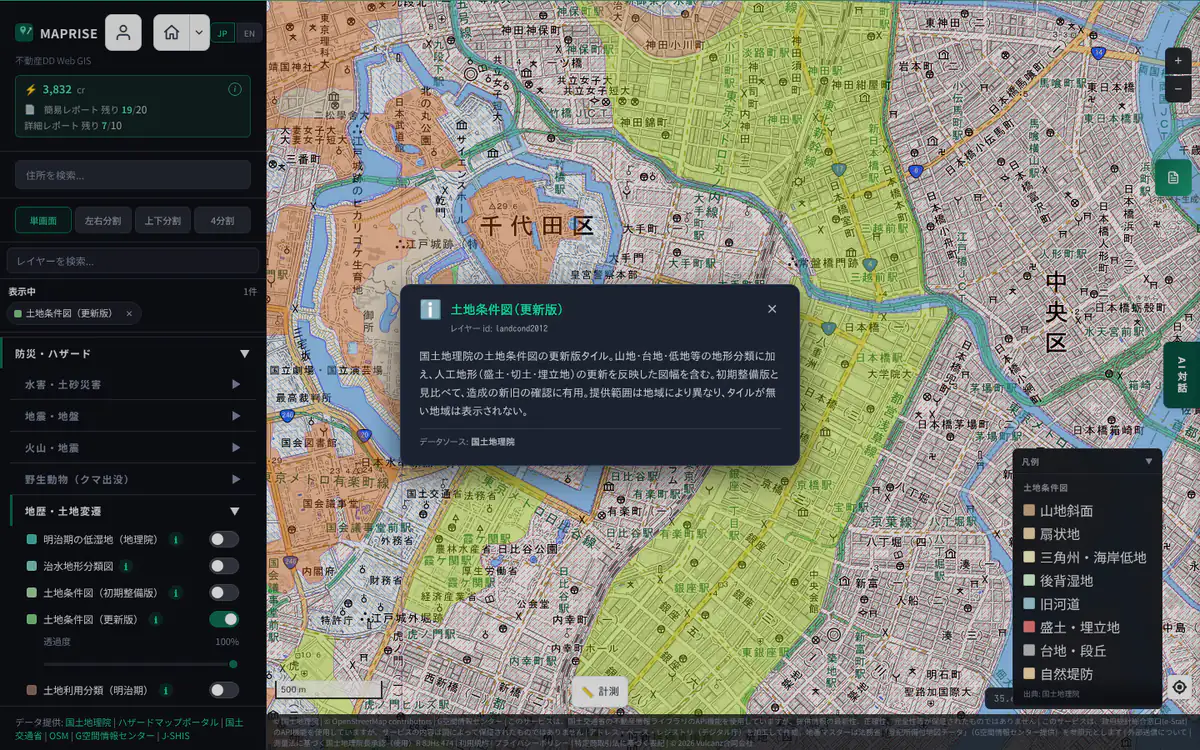
Land Condition Map (Updated)

Starter and above
Show details

Overview

Updated-edition tiles of the GSI Land Condition Map. Landform classification (mountains, plateaus, lowlands) plus sheets reflecting updated artificial landforms (fill/cut/reclaimed land). Compare with the initial edition to see newer and older development. Coverage varies by area; no tiles are shown where unavailable.

Data source

GSI Japan

Land Condition Map (Updated) — Screen example (with legend and click popup)
Screen example (with legend and click popup) ・Click the image to open it full size
Show details
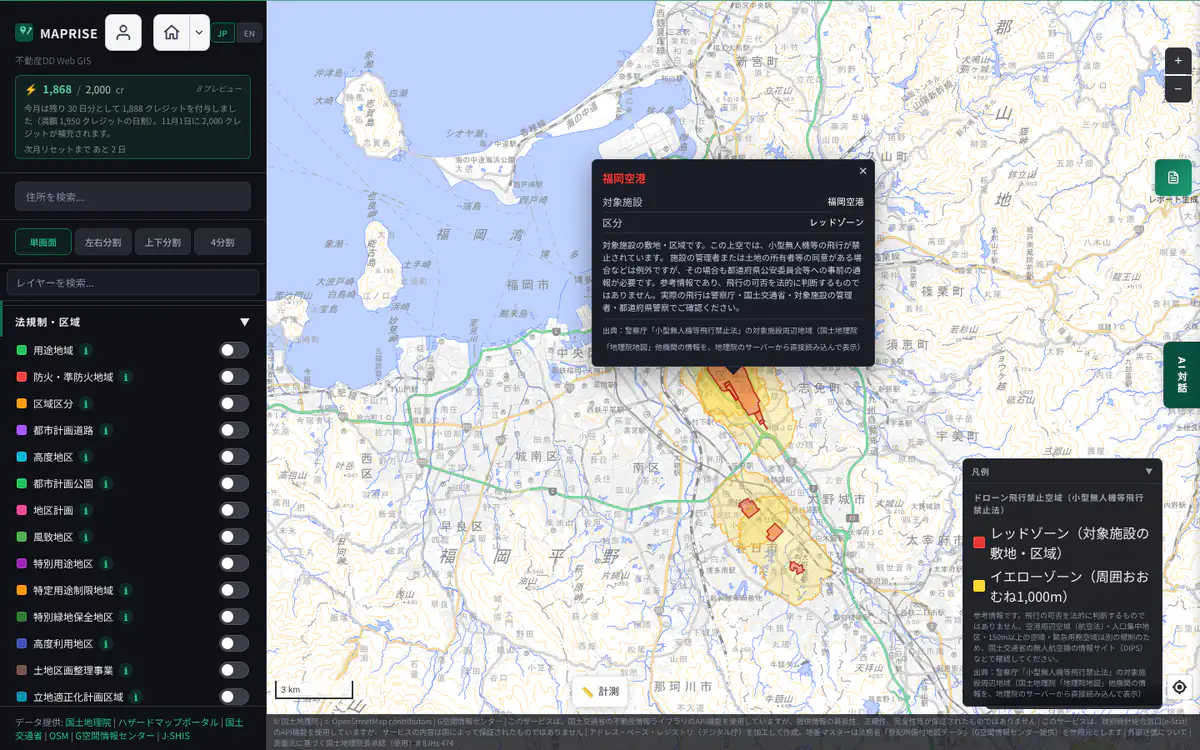
  • For reference only; not a legal determination of whether you may fly. Airport-vicinity airspace, Densely Inhabited Districts and airspace above 150 m under the Civil Aeronautics Act are separate regulations; check MLIT’s DIPS and other official sources.

Overview

Areas around facilities designated under the Small Unmanned Aircraft Prohibition Act. The red zone is the site / premises of facilities such as the Diet, the Prime Minister's Office, the Imperial Palace, the Supreme Court, nuclear power plants, airports, defense facilities and embassies; the yellow zone is the area about 1,000 m around it. Flying small unmanned aircraft such as drones over either zone is prohibited (exceptions exist, e.g. with the consent of the facility manager or landowner, but advance notification is still required). For reference only; this is not a legal determination of whether you may fly. Airport-vicinity airspace (Civil Aeronautics Act), Densely Inhabited Districts, airspace above 150 m and emergency-use airspace are separate regulations; check MLIT's drone information site (DIPS) and other official sources. This layer is loaded directly from GSI servers (GSI Maps, other agencies) each time it is displayed. Shown at zoom level 8 and above.

Data source

National Police Agency (areas around facilities designated under the Small Unmanned Aircraft Prohibition Act) / GSI Maps (other agencies)

Drone No-Fly Areas (Around Key Facilities) — Screen example (with legend and click popup)
Screen example (with legend and click popup) ・Click the image to open it full size

Minpaku Ordinances (by Municipality)

EstimateRelated to 重説Free (partly paid plans)
Show details
  • The shaded areas combine census small-area boundaries by municipality and may differ in detail from the actual administrative boundaries. The colour reflects the strictest area in the municipality and can differ by location inside it. It does not tell you whether minpaku is allowed, and ordinances may have been amended after the check date.

Free: municipality colouring only. Ordinance names, accommodation tax, sources and restriction details need Starter or above.

Overview

A reference map of ordinances and other public information on minpaku (private lodging under the Minpaku Act), color-coded by municipality (including the status of special-zone minpaku). Scope: public sources such as ordinances, official local-government pages, and national documents, researched, classified, and summarized by us. Building Standards Act, city planning, Fire Service Act, Hotel Business Act permit requirements, and condominium bylaws are generally not included. Updates: Tokyo's 23 wards and similar areas are checked monthly, others roughly quarterly; the check date is shown in each popup. Limits: ordinances may be amended after the check date. The color reflects the strictest area within the municipality, and rules can differ by location inside it. The shaded areas combine census small-area boundaries by municipality and may differ in detail from the actual administrative boundaries. This does not tell you whether minpaku is allowed; always confirm with the local authority where you would file. Ordinance names, accommodation tax, sources, and restriction details are shown on the Starter plan and above.

Data source

Ordinances and official pages of each local government (researched and processed by us) / Boundaries: derived from the 2020 Census small-area boundaries (Statistics Bureau of Japan)

Minpaku Ordinances (by Municipality) — Screen example (with legend and click popup)
Screen example (with legend and click popup) ・Click the image to open it full size

Wildlife Protection and Hunting Areas (Reference)

Limited regionsEstimateFree
Show details
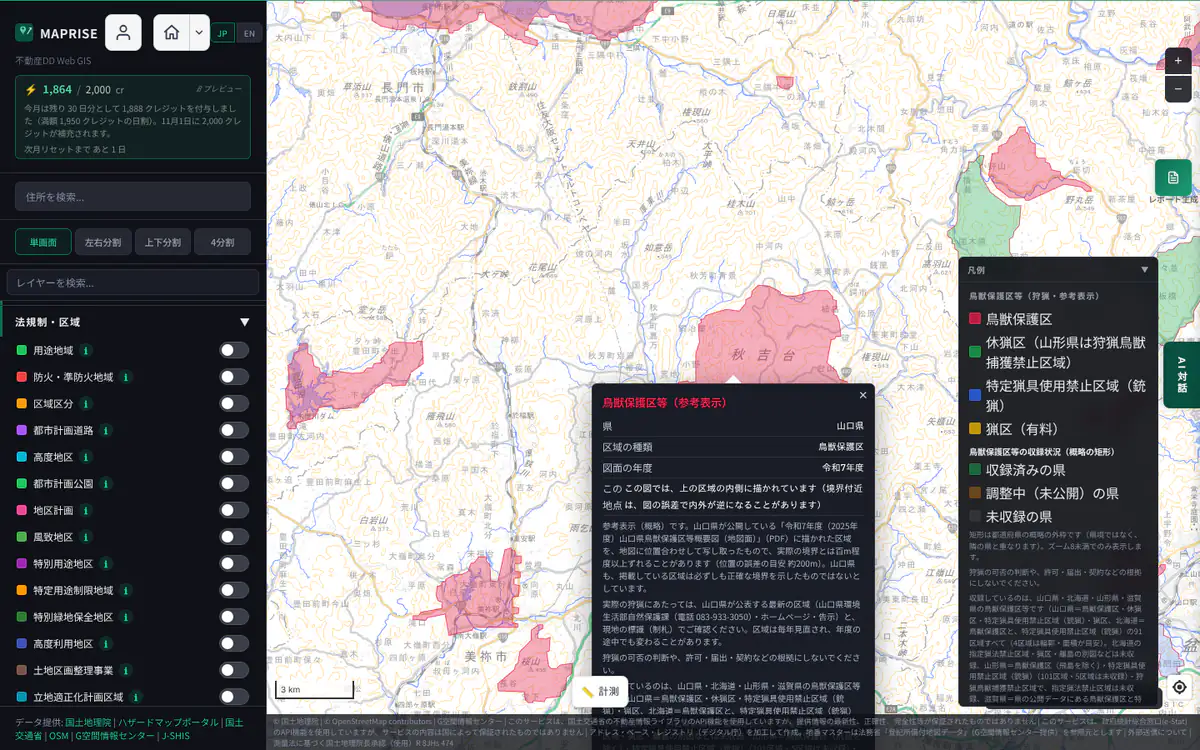
  • Yamaguchi, Hokkaido, Yamagata, Shiga, Osaka and Niigata prefectures only (Niigata: wildlife protection areas, temporary game preserves and gun-prohibited areas from the prefecture's FY2026 location map, without hunting-method prohibited areas; Osaka: wildlife protection areas, special protection zones and gun-prohibited areas from the prefecture's FY2026 location map, without hunting-rest areas, hunting grounds or lead-shot restriction areas; Shiga: wildlife protection areas and special protection districts from the prefecture's published GIS data, without gun-prohibited areas, hunting-rest areas or hunting grounds; Hokkaido: wildlife protection areas and the 91 gun-prohibited areas designated by the prefecture; Yamagata: wildlife protection areas excluding Tobishima, and others; some lead-shot restriction areas and hunting grounds are not included). Other prefectures are not included yet.
  • Approximate areas traced from the PDF maps published by each prefecture (estimated positional error about 200 m for Yamaguchi, about 300 m for Hokkaido and about 100 m for Yamagata and for the two Osaka areas read from the location map, about 200 m for Niigata and about 300 m for its Itoigawa inset map). They can differ from the actual boundaries and cannot be used to decide whether hunting is allowed or as grounds for permits or notifications.

Overview

Shown as a reference for hunters for Yamaguchi Prefecture, Hokkaido, Yamagata Prefecture, Shiga Prefecture, Osaka Prefecture and Niigata Prefecture. Yamaguchi: wildlife protection areas (red), temporary game preserves (green), designated hunting-equipment prohibited areas (guns) (blue) and paid game areas (yellow). Hokkaido: wildlife protection areas (red), plus all 91 designated hunting-equipment prohibited areas (guns) (blue) (for 4 of them, band-shaped or small areas whose lines or symbols are drawn larger than the actual area, the outline and area are approximate); designated hunting-method prohibited areas and paid game areas are not included (the absence of blue does not mean guns are allowed). Yamagata: wildlife protection areas (red; 50 areas, Tobishima excluded), designated hunting-equipment prohibited areas (guns) (blue; 101 of the 106 areas in the official table) and game-species capture prohibited areas (green; 8 areas); designated hunting-method prohibited areas are not included (five gun-prohibited areas are not included, four are approximate, and the boundaries between three capture-prohibited areas are approximate; green is the prefectural capture prohibition, excluding wild boar, sika deer and Asian black bear, not a temporary game preserve). Shiga: the GIS data published by the prefecture (wildlife protection areas, red, 45 areas, and the special protection zones inside them, red, 14 areas); gun-prohibited areas, temporary game preserves, paid game areas and hunting-method prohibited areas are not included (only areas designated by the prefecture; national wildlife protection areas may not be included). Osaka: the wildlife protection areas (red, 18 areas) and the special protection zone (red, 1 area), and the designated hunting-equipment prohibited areas (guns) (blue, 75 areas) in the prefecture FY2026 location map; temporary game preserves, paid game areas and hunting-method prohibited areas are not included (only areas designated by the prefecture; national wildlife protection areas may not be included). Niigata: the wildlife protection areas (red; 123 areas = 114 on the main map, 3 on the Sado inset map and 6 on the Itoigawa inset map), the temporary game preserves (green; 3 areas on the Sado inset map) and the designated hunting-equipment prohibited areas (guns) (blue; 46 of the 48 areas in the prefecture list) in the prefecture FY2026 location map; hunting-method prohibited areas are not included (special protection zones are included in the protection areas, gun-prohibited areas 131 and 144 are not included, and small areas on the Sado and Itoigawa inset maps may be missing). For Yamaguchi, Hokkaido and Yamagata, the areas drawn in the "FY2025 wildlife protection area overview map (map sheet)" published by Yamaguchi Prefecture and the "FY2026 Hokkaido wildlife protection area location maps (map volume)" published by Hokkaido, and the "FY2025 Yamagata Prefecture wildlife protection area location maps" published by Yamagata Prefecture (all PDF) were traced onto this map; they may be off from the actual boundaries by a hundred meters or more (estimated positional error about 200 m for Yamaguchi, about 300 m for Hokkaido and about 100 m for Yamagata). For Shiga, the GIS data “Shiga Prefecture Wildlife Protection Area GIS Data” and “Shiga Prefecture Wildlife Protection Area (Special Protection Zone) GIS Data” published by the prefecture on the Shiga Open Data Catalog (BODIK) (published July 25, 2024, updated irregularly) are shown after a coordinate conversion only, so there is no tracing error, but the prefecture states that the data contains errors due to map accuracy and its accuracy is not guaranteed. Designation changes after July 2024 may not be reflected. For Osaka, the areas that did not change in the FY2026 location map (updated November 1, 2026) are shown from the data “Wildlife Protection Areas and Designated Hunting-Equipment Prohibited Areas in Osaka Prefecture” published by the prefecture on the Osaka Open Data Catalog (BODIK) (published in 2024, not the latest version) after a coordinate conversion only, so there is no tracing error. Two areas that changed in the map, the Kisen Kogen wildlife protection area and the newly designated gun-prohibited area (around Osaka City, Moriguchi, Matsubara and Fujiidera), were read from the map image and are approximate (estimated positional error about 100 m). Nose and Yamabe are combined into one area (Nose-Yamabe) to match the prefecture map. The prefecture states: This map shows the areas of wildlife protection areas and similar areas for reference only. Please refrain from hunting near the boundaries of each area. For Niigata, only the area boundary lines in the “Niigata Prefecture Wildlife Protection Area Location Map (FY2026)” (PDF, updated November 1, 2026) published by the prefecture are traced onto the map; the background map and colors are not reproduced (estimated positional error about 200 m, about 300 m for the Itoigawa inset map). The prefecture states: The areas are shown roughly. For details, please see the reverse side of the location map published on the Niigata Prefecture website. (https://www.pref.niigata.lg.jp/sec/kankyotaisaku/tyoujyuuhogoku.html) The Hokkaido maps are hard to read: small areas may be missed, and places that only look similar may be included as areas. The gun-prohibited areas (blue) were traced by hand, with outlines moved to the center of the drawn line so that the area matches the official table; for 4 band-shaped or small areas whose lines or symbols are drawn larger than the actual area, the outline and area are approximate. Yamaguchi Prefecture also states that the areas shown are not necessarily exact boundaries. Click for the area type, the map fiscal year and the source. When zoomed out (below zoom level 8), boxes show which prefectures are included (the boxes are approximate outlines of prefectures, not borders). Note: before hunting, please check the latest areas published by the prefecture (its website and the official notices) and the signboards on site. The areas may change during the year. This cannot be used to decide whether hunting is allowed, or as grounds for permits, notifications or contracts. A place with no area drawn does not mean it is outside an area or a place where hunting is allowed. Snare-prohibited areas, lead-shot restricted areas and special protection zones of natural parks are not included. Yamaguchi Prefecture, Hokkaido, Yamagata Prefecture, Shiga Prefecture, Osaka Prefecture and Niigata Prefecture only; other prefectures are not included yet.

Data source

Produced from the "FY2025 Yamaguchi Prefecture wildlife protection area overview map (map sheet)" by Yamaguchi Prefecture (Nature Conservation Division, published November 1, 2025) and the "FY2026 Hokkaido wildlife protection area location maps (map volume)" by Hokkaido (Wildlife Management Division, Environment and Lifestyle Department), and the "FY2025 Yamagata Prefecture wildlife protection area location maps" by Yamagata Prefecture (Wildlife Damage Control Office, Midori Shizen Division, published October 28, 2025). Credit: Yamaguchi Prefecture, Hokkaido, Yamagata Prefecture (Midori Shizen Division). The Shiga data is used with modification from: “Shiga Prefecture Wildlife Protection Area GIS Data” and “Shiga Prefecture Wildlife Protection Area (Special Protection Zone) GIS Data”, Shiga Prefecture, Creative Commons Attribution 4.0 International (https://creativecommons.org/licenses/by/4.0/deed.en). The processing was done by us; it was not made or guaranteed by Shiga Prefecture. The source for Osaka is the Osaka Prefecture FY2026 Wildlife Protection Area Location Map. The areas based on published data are used with modification from: “Wildlife Protection Areas and Designated Hunting-Equipment Prohibited Areas in Osaka Prefecture”, Osaka Prefecture, Creative Commons Attribution 4.0 International (https://creativecommons.org/licenses/by/4.0/deed.en). The processing was done by us; it was not made or guaranteed by Osaka Prefecture. The source for Niigata is Niigata Prefecture (quoted from the Niigata Prefecture Wildlife Protection Area Location Map).
Wildlife Protection and Hunting Areas (Reference) — Screen example (with legend and click popup)
Screen example (with legend and click popup) ・Click the image to open it full size
↑ Back to top

Disaster & hazard282224211328 layers

Flood, storm surge, tsunami, landslide, earthquake and ground conditions, plus evacuation sites, together on one map.

What this group tells you

  • Expected flood depth and duration, and the scenario behind it (design-scale vs. maximum-scale)
  • Warning zones by hazard type beyond floods: landslide, tsunami, storm surge
  • Ground, liquefaction tendency, active faults and boring logs that bear on shaking, and the nearest evacuation sites

Everyday problems it helps with

  • Real Estate BrokersWant to answer "what is the flood risk here?" on the spot, with data.
  • Banks (Lending)Hazard checks for collateral are scattered across different documents for each case, slowing down reviews.
  • Local GovernmentWant flood zones, landslide zones and shelters on a single view when drafting disaster plans.

Layers in this group

Show layer list

Flood (Maximum Scale)

Related to 重説Free
Show details

Overview

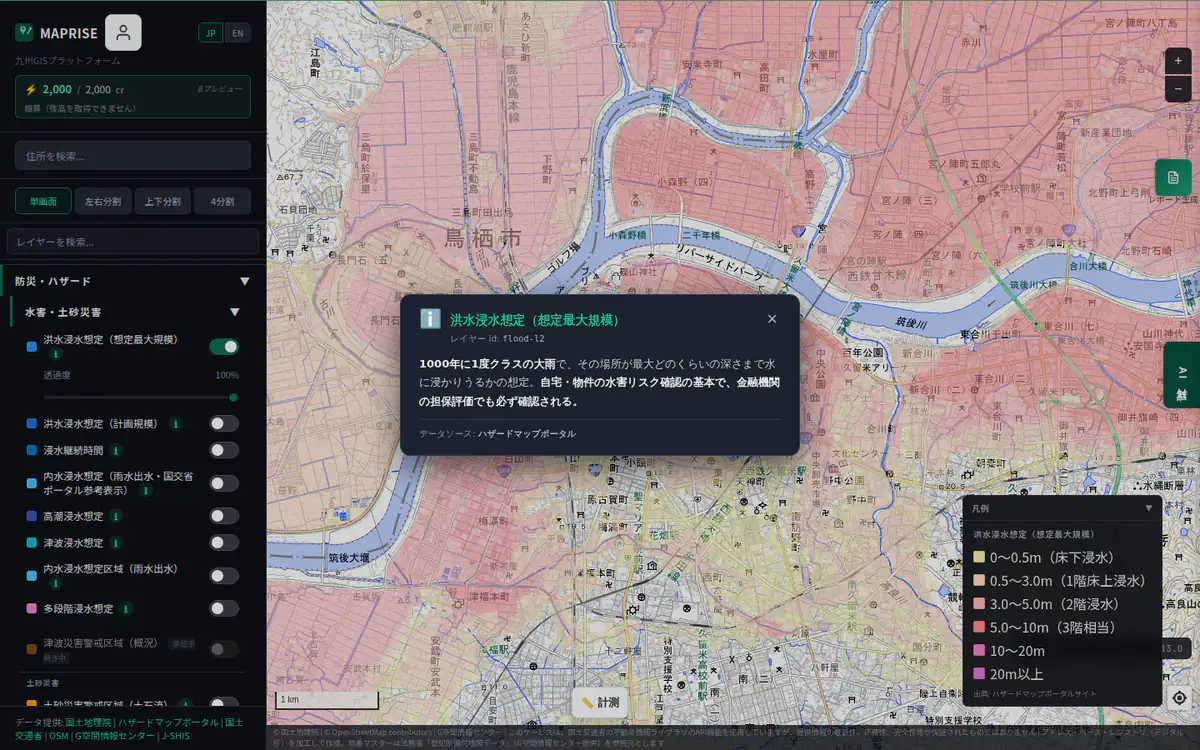
Maximum flood depth assuming 1-in-1000-year rainfall. Critical hazard for collateral valuation.

Data source

Hazard Map Portal

Flood (Maximum Scale) — Screen example (with legend and click popup)
Screen example (with legend and click popup) ・Click the image to open it full size

Flood (Planned Scale)

Related to 重説Starter and above
Show details

Overview

Flood depth in river plan scenarios (1-in-100~200-year). More realistic than max scale.

Data source

Hazard Map Portal

Flood (Planned Scale) — Screen example (with legend and click popup)
Screen example (with legend and click popup) ・Click the image to open it full size

Flood Duration

Starter and above
Show details

Overview

Duration of flooding (evacuation indicator). Long-flooded areas have high recovery cost.

Data source

Hazard Map Portal

Flood Duration — Screen example (with legend and click popup)
Screen example (with legend and click popup) ・Click the image to open it full size

Inland Flood (Rainwater Overflow)

Related to 重説Starter and above
Show details

Overview

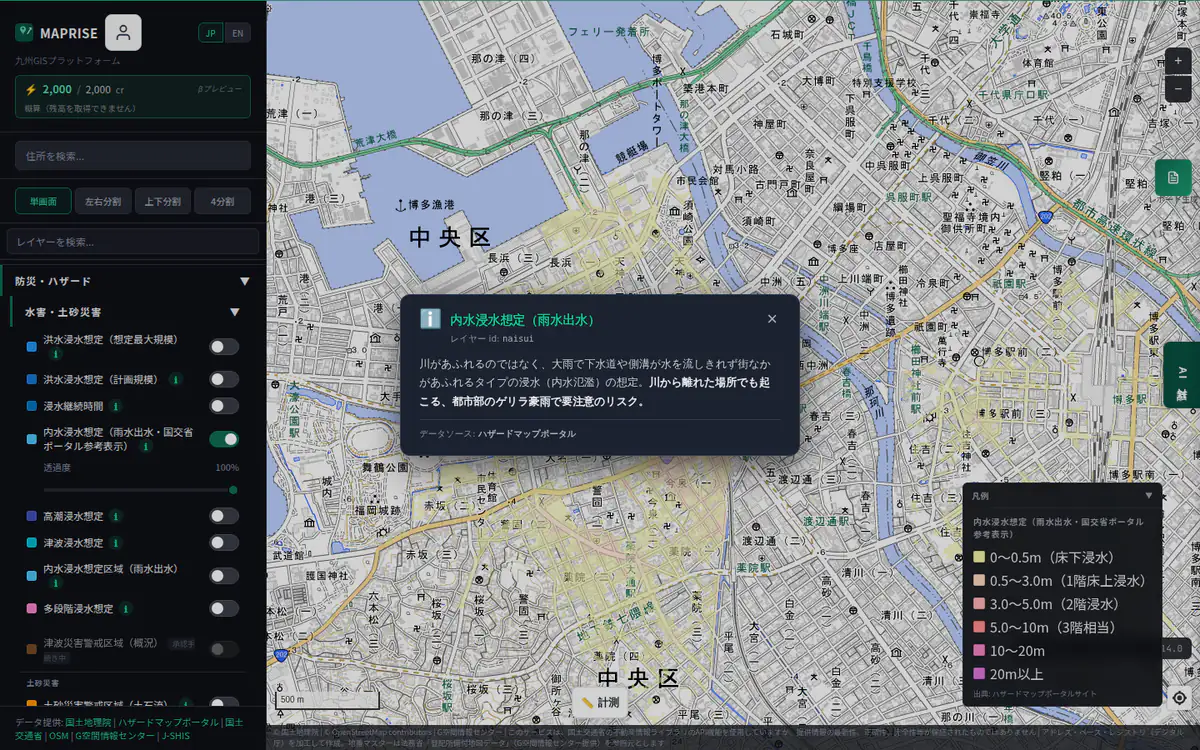
Inundation from sewer overflow ("inland flood"). Essential for urban guerrilla rainfall planning.

Data source

Hazard Map Portal

Inland Flood (Rainwater Overflow) — Screen example (with legend and click popup)
Screen example (with legend and click popup) ・Click the image to open it full size

Inland Flooding (Pluvial)

Related to 重説Free
Show details

Overview

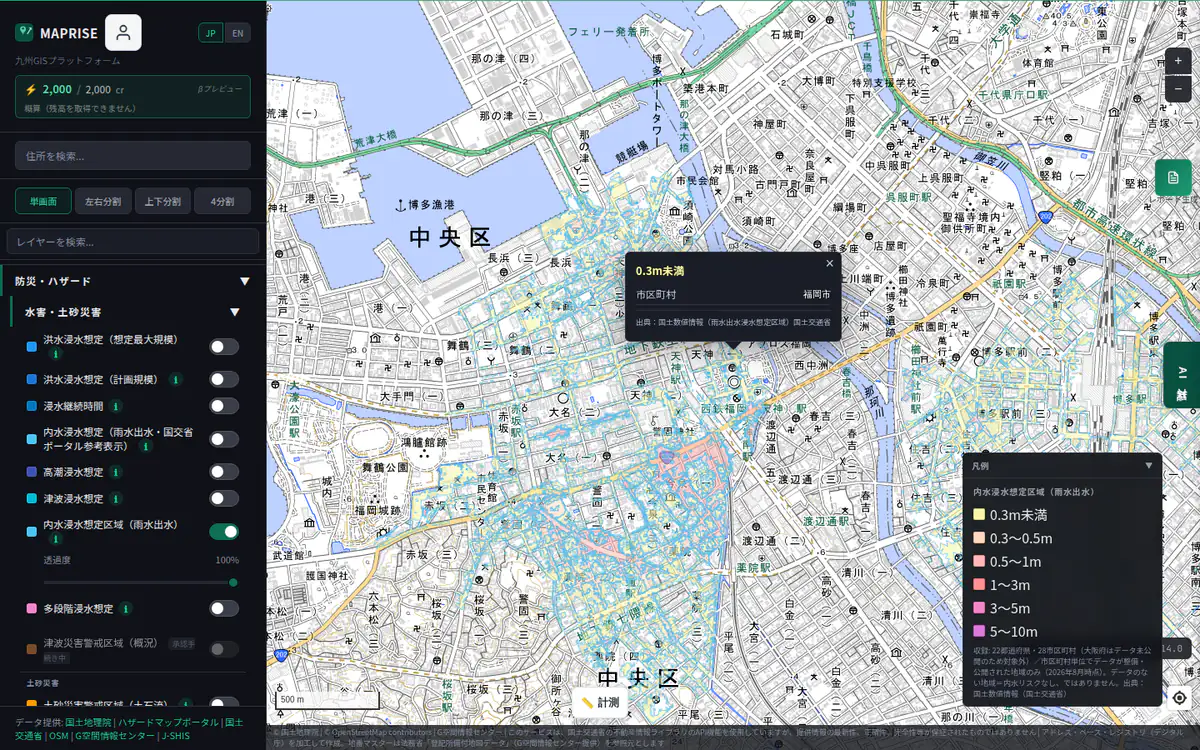
Pluvial (inland) flood inundation areas under the Flood Control Act — flooding caused by rainfall that exceeds the drainage capacity of sewers and channels, distinct from river (fluvial) flooding. Click any area to see the assumed inundation depth (6 levels). Coverage: 28 designated pluvial-inundation municipalities across 22 prefectures nationwide; absence of data does not mean there is no risk.

Data source

National Land Numerical Information (Pluvial Inundation Areas), MLIT

Inland Flooding (Pluvial) — Screen example (with legend and click popup)
Screen example (with legend and click popup) ・Click the image to open it full size

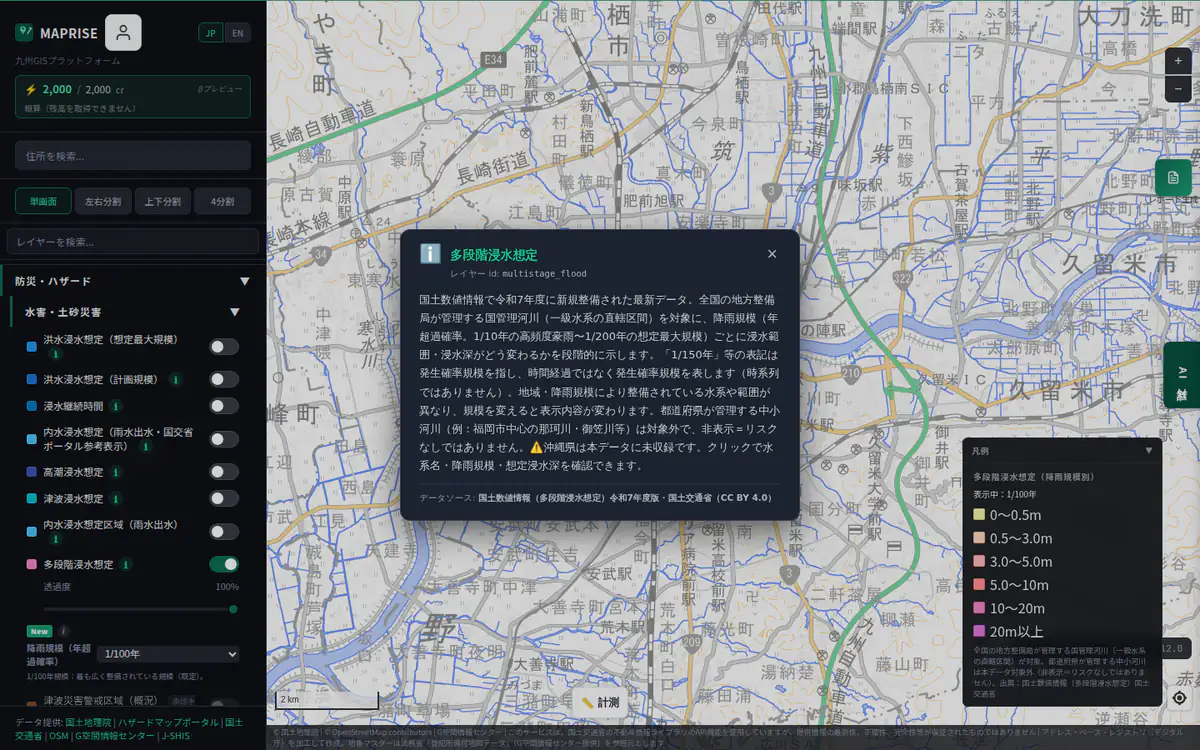
Multi-stage Flood (Rainfall Scale)

Partial coverageRelated to 重説Free (partly paid plans)
Show details
  • Only rivers managed by the national government; prefecture-managed rivers are excluded and Okinawa is not included. No display does not mean no risk.

Free: the 1-in-100-year scale only. Switching to other scales needs Starter or above.

Overview

Newly compiled in FY2025 within National Land Numerical Information. For nationally-managed (Class A) river systems maintained by MLIT's regional development bureaus across Japan, it shows how the inundation extent and depth change by rainfall scale (annual exceedance probability, from the frequent 1/10-yr to the maximum-assumed 1/200-yr). Scale labels such as "1/150-yr" are occurrence-probability scales, not a timeline. Coverage varies by region and rainfall scale, so changing the scale changes which systems and areas are shown. Prefecture-managed rivers (e.g. Naka/Mikasa in central Fukuoka) are not included; absence of display does not mean there is no risk. Note: Okinawa is not covered by this data. Click any area to see the river system, rainfall scale and assumed inundation depth.

Data source

National Land Numerical Information (Multi-stage Flood), FY2025, MLIT (CC BY 4.0)

Multi-stage Flood (Rainfall Scale) — Screen example (with legend and click popup)
Screen example (with legend and click popup) ・Click the image to open it full size

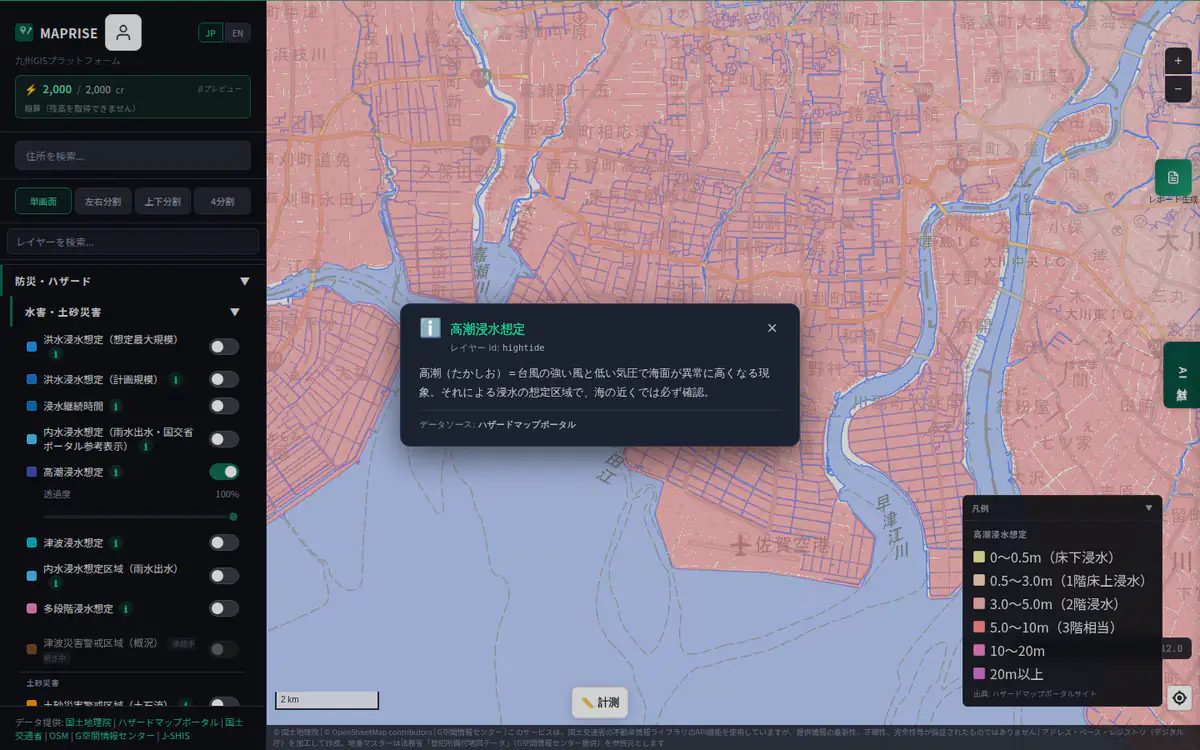
Storm Surge

Related to 重説Starter and above
Show details

Overview

Storm surge inundation by typhoons. Essential near coast.

Data source

Hazard Map Portal

Storm Surge — Screen example (with legend and click popup)
Screen example (with legend and click popup) ・Click the image to open it full size

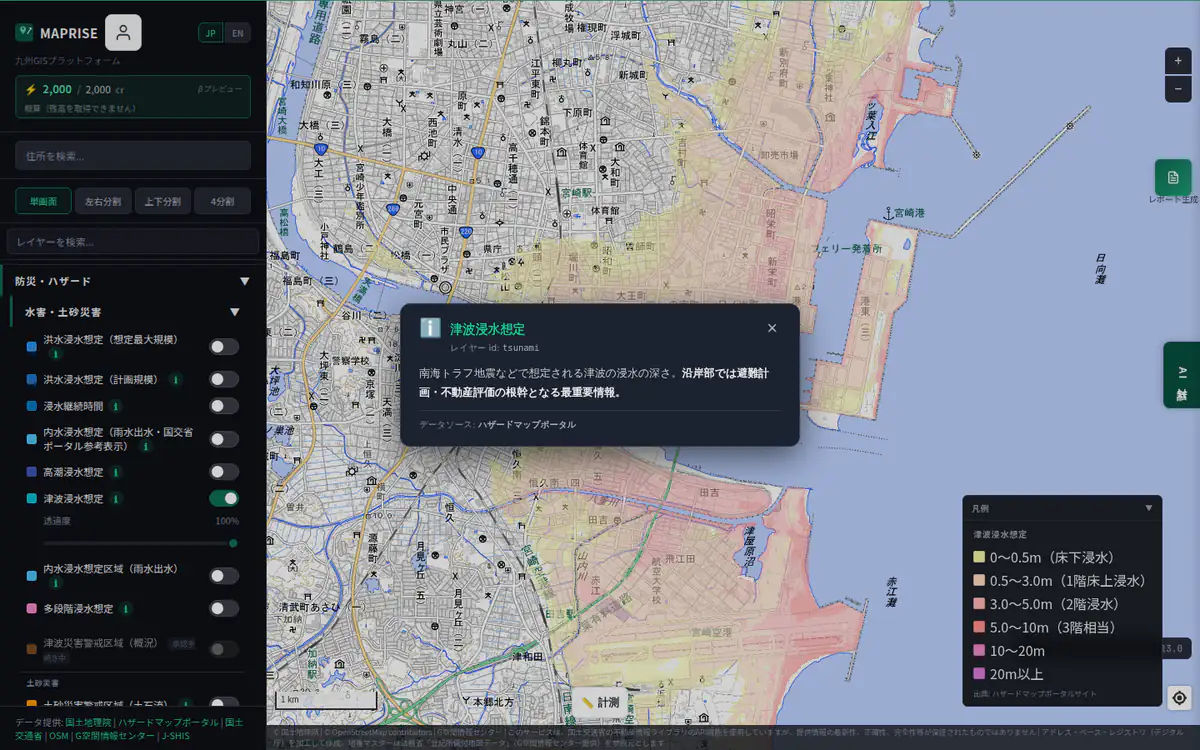
Tsunami Inundation

Related to 重説Free
Show details

Overview

Tsunami depth (Nankai Trough etc). Foundation for coastal real estate and evacuation.

Data source

Hazard Map Portal

Tsunami Inundation — Screen example (with legend and click popup)
Screen example (with legend and click popup) ・Click the image to open it full size

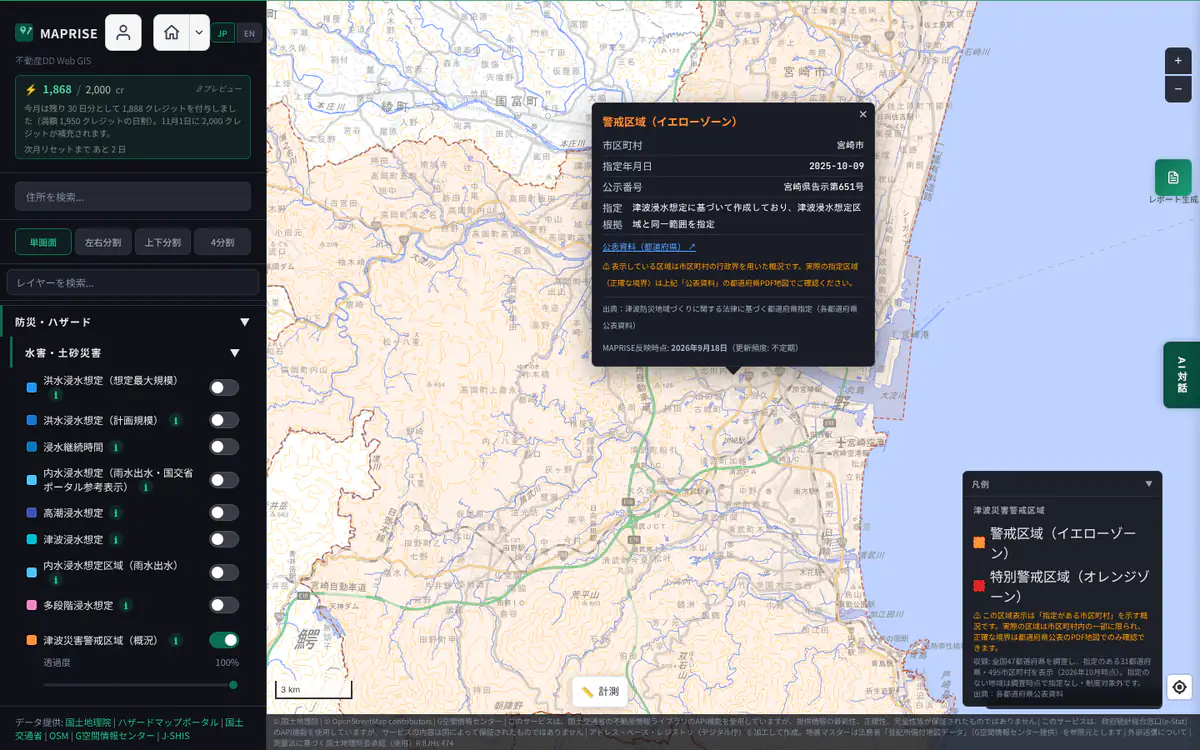
Tsunami Warning Zones (Overview)

Partial coverageRelated to 重説Free
Show details
  • All 47 prefectures were surveyed; the layer covers the 495 municipalities in 31 prefectures with a designation, at municipality level. It is not the exact zone boundary, and municipalities not shown had no designation at the time of survey or are outside the system.

Overview

Shows municipalities where a prefecture governor has designated a Tsunami Disaster Warning Zone (Yellow Zone) or Special Warning Zone (Orange Zone) under the Act on Special Measures for Tsunami Disaster Prevention Community Development. In a Special Warning Zone, construction of buildings without a tsunami-resistant structure may additionally be restricted (Art. 73/78/82/87). Warning: prefectures do not publish vector data with the precise zone boundary (PDF maps only), so this layer shows the municipal administrative boundary, dashed and at low opacity, as an overview meaning "a designation exists somewhere within this municipality." The actual zone covers only part of the municipality; check each prefecture's official PDF map (linked from the popup) for the exact boundary. This is a mandatory disclosure item under Real Estate Brokerage Act Enforcement Regulation Art. 16-4-3; final confirmation for a transaction requires an inquiry to the prefecture. Coverage: all 47 prefectures surveyed; every municipality with a designation is included (as of Nov 2026). Municipalities not shown had no designation at the time of survey, or the system does not apply there. Designations are added over time, so confirm the latest status with the prefecture.

Data source

Processed by Vulcanz LLC from each prefecture's published materials (designation under the Act on Special Measures for Tsunami Disaster Prevention Community Development; shown by municipal boundary)

Tsunami Warning Zones (Overview) — Screen example (with legend and click popup)
Screen example (with legend and click popup) ・Click the image to open it full size

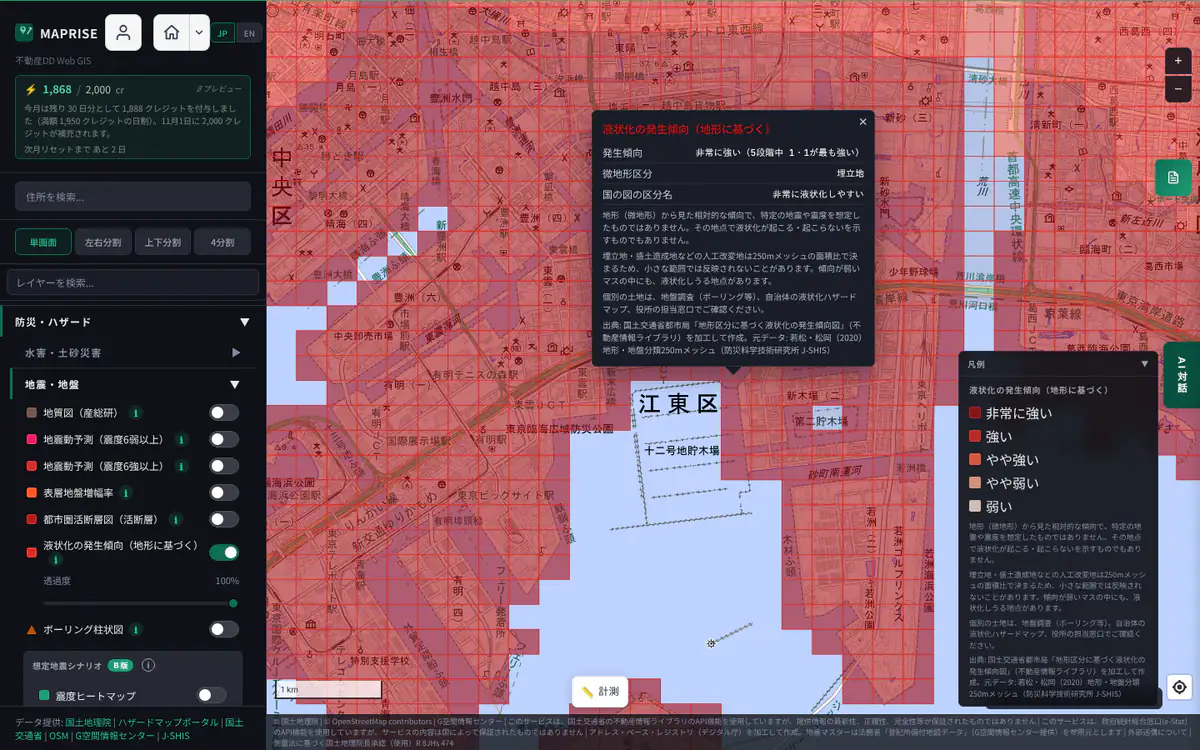
Liquefaction Tendency (Based on Landform)

EstimateRelated to 重説Free
Show details
  • A 5-level tendency toward liquefaction based on landform (micro-topography), shown on a 250 m grid. It assumes no particular earthquake or seismic intensity and does not show whether liquefaction will or will not occur at a given site. Reclaimed land and other man-made fill may not be reflected in small areas.

Overview

Shows, for each 250 m cell, how strongly the landform (micro-topography) tends toward liquefaction, in 5 levels (Ministry of Land, Infrastructure, Transport and Tourism, City Bureau: 'Liquefaction tendency map based on landform classification'). Darker red cells are where the landform tends to liquefy more readily. Click a cell to see its level and the landform class of the cell (delta/coastal lowland, reclaimed land, natural levee, etc.). Note: this assumes no particular earthquake or seismic intensity, and does not show whether liquefaction will or will not occur at a given site. Reclaimed land and man-made fill are decided by their area share within each cell, so small areas may not be reflected, and sites where liquefaction can occur exist even in cells rated as weak. To check a specific site, see a ground investigation (boring survey), the liquefaction hazard map published by the municipality, or the local government office.

Data source

Created by processing the MLIT City Bureau 'Liquefaction tendency map based on landform classification' (Real Estate Information Library API). Original data: Wakamatsu & Matsuoka (2020) Japan Engineering Geomorphologic Classification Map 250 m mesh (NIED J-SHIS), reclassified by the method of Matsuoka, Wakamatsu & Hashimoto (2011)

Liquefaction Tendency (Based on Landform) — Screen example (with legend and click popup)
Screen example (with legend and click popup) ・Click the image to open it full size

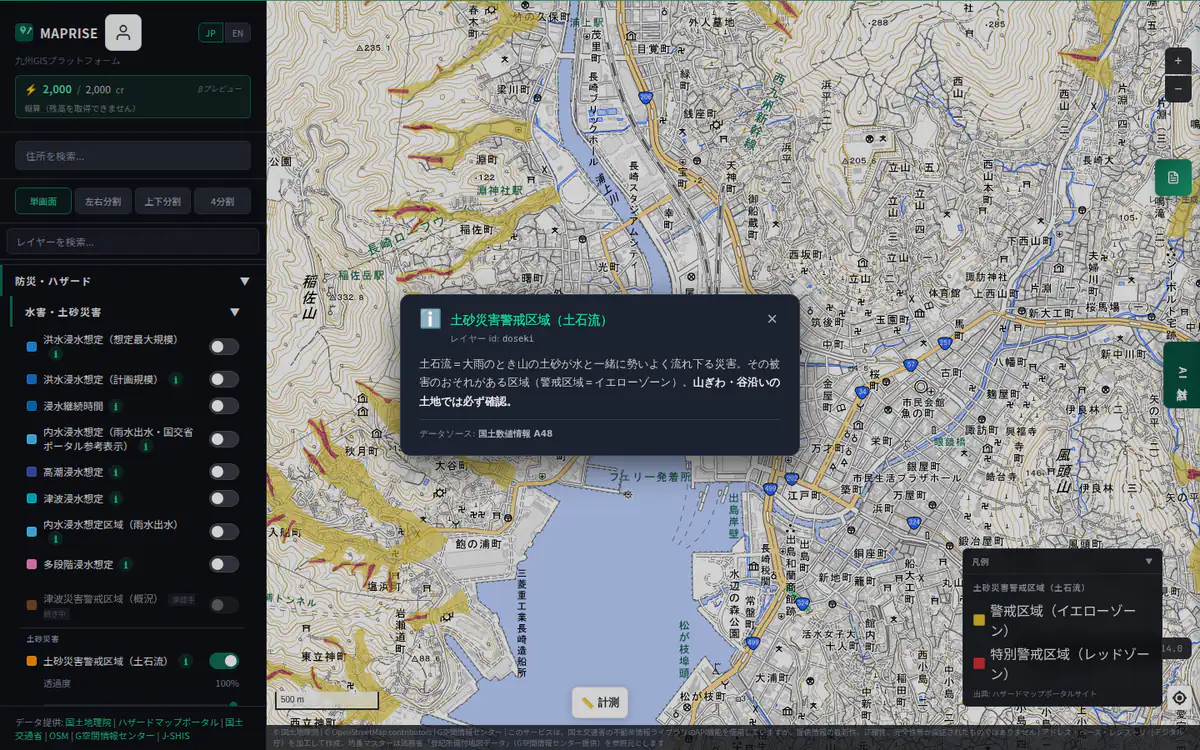
Landslide Warning Zone (Debris Flow)

Related to 重説Free
Show details

Overview

Debris flow warning areas (yellow zone). Essential check for mountainside land.

Data source

Hazard Map Portal Site (MLIT)

Landslide Warning Zone (Debris Flow) — Screen example (with legend and click popup)
Screen example (with legend and click popup) ・Click the image to open it full size

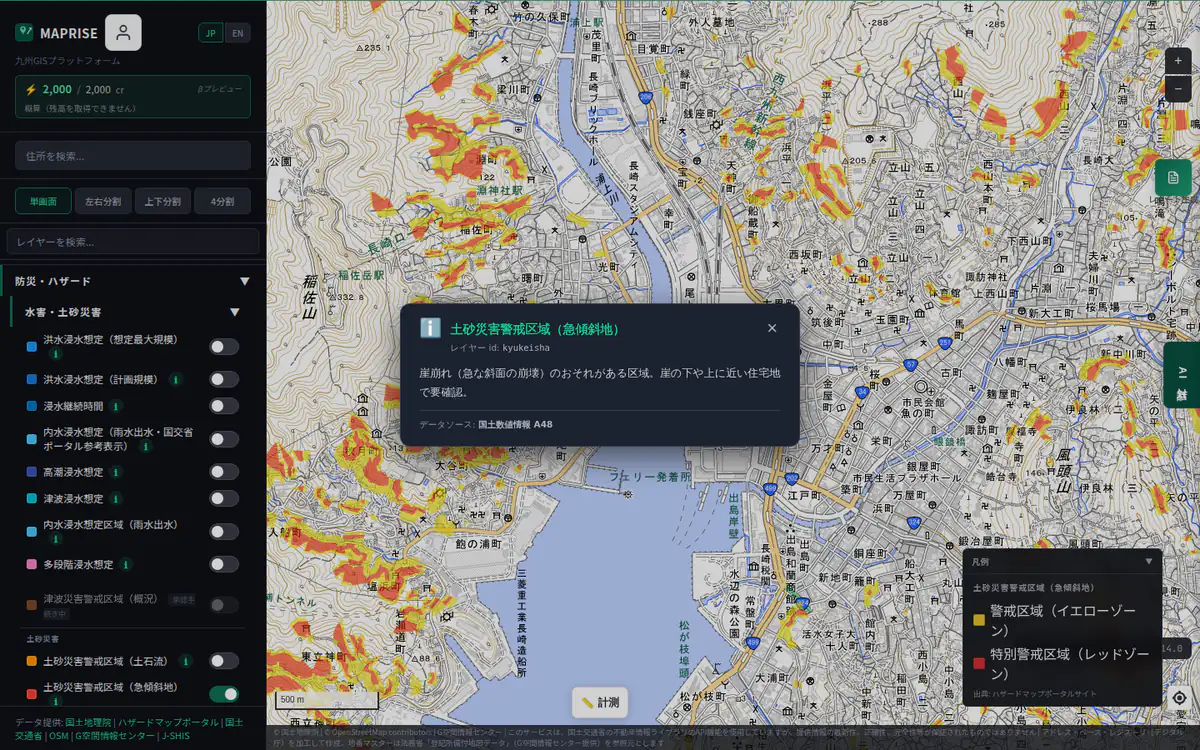
Steep Slope Landslide Zone

Related to 重説Free
Show details

Overview

Steep slope collapse warning. Essential for hillside development.

Data source

Hazard Map Portal Site (MLIT)

Steep Slope Landslide Zone — Screen example (with legend and click popup)
Screen example (with legend and click popup) ・Click the image to open it full size

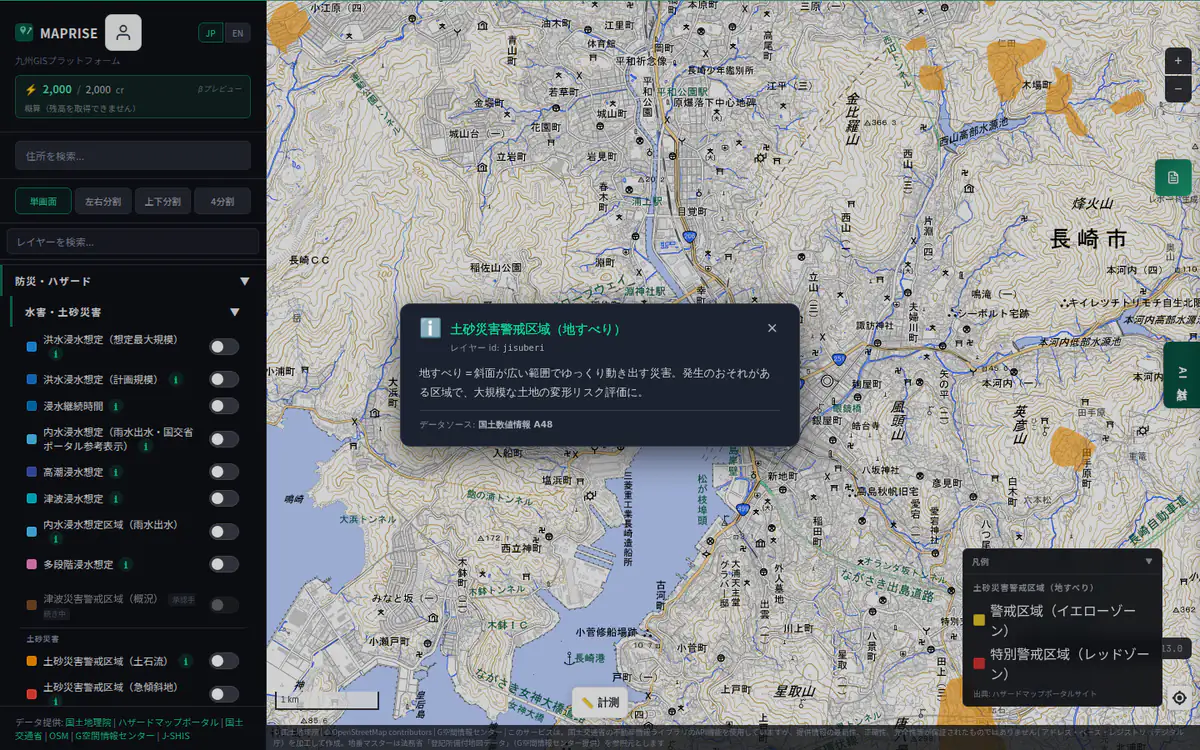
Landslide Slip Zone

Related to 重説Free
Show details

Overview

Landslide slip warning. For large-scale collapse risk assessment.

Data source

Hazard Map Portal Site (MLIT)

Landslide Slip Zone — Screen example (with legend and click popup)
Screen example (with legend and click popup) ・Click the image to open it full size

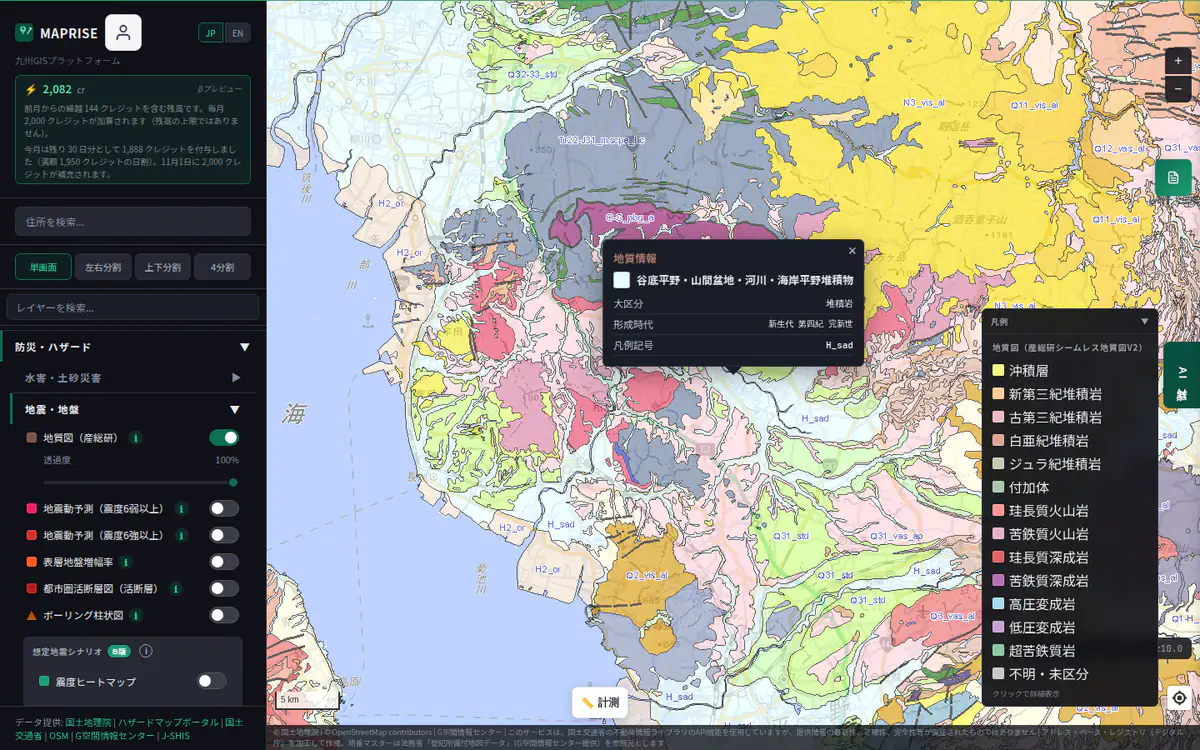
Seamless Geological Map

Starter and above
Show details

Overview

Seamless geological map (1:50k) from AIST. For ground strength and liquefaction risk.

Data source

AIST

Seamless Geological Map — Screen example (with legend and click popup)
Screen example (with legend and click popup) ・Click the image to open it full size
Show details

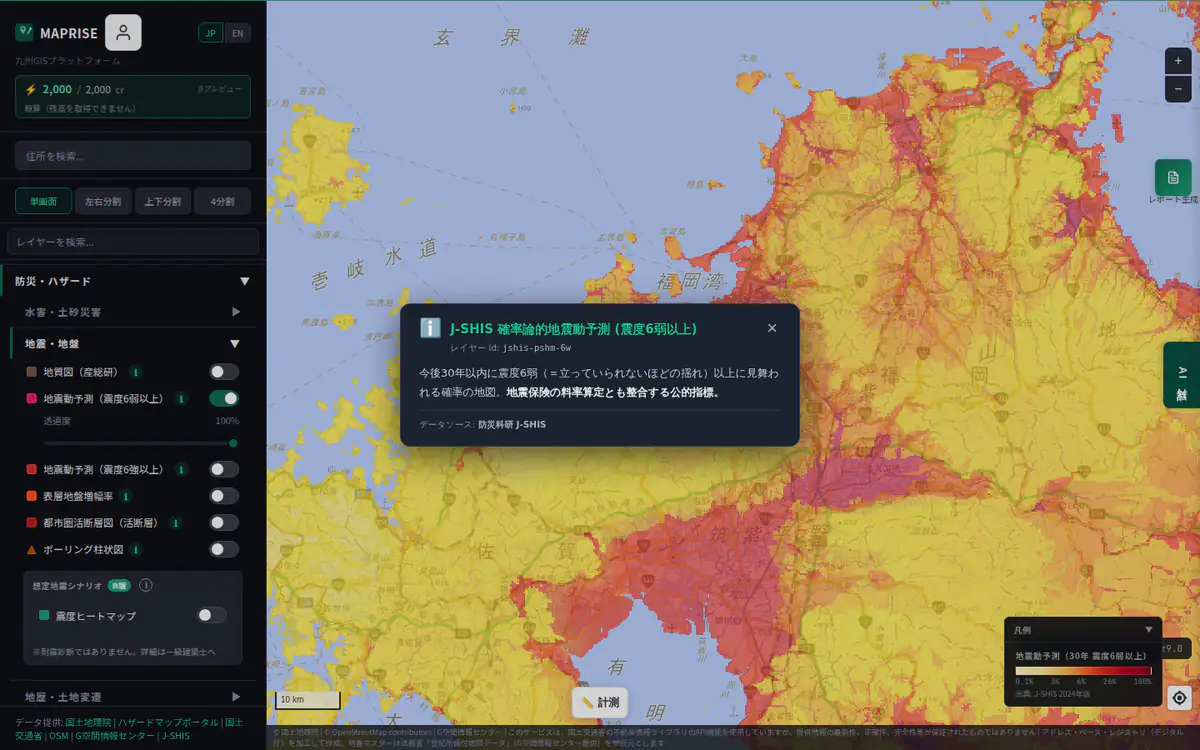
Overview

Probability of >=6 weak shaking within 30 years. Matches earthquake insurance rates.

Data source

NIED J-SHIS

J-SHIS Probabilistic Earthquake (>=6 weak) — Screen example (with legend and click popup)
Screen example (with legend and click popup) ・Click the image to open it full size

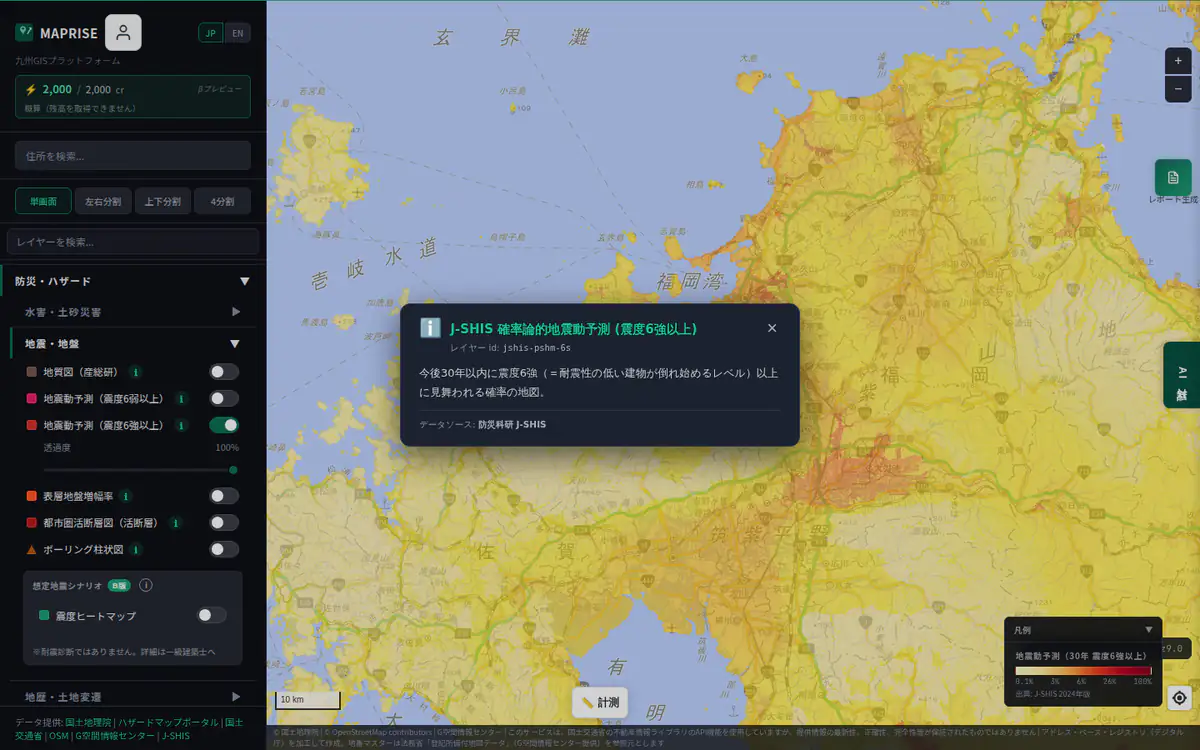
J-SHIS Probabilistic (>=6 strong)

Starter and above
Show details

Overview

Probability of >=6 strong shaking. Building damage becomes severe.

Data source

NIED J-SHIS

J-SHIS Probabilistic (>=6 strong) — Screen example (with legend and click popup)
Screen example (with legend and click popup) ・Click the image to open it full size

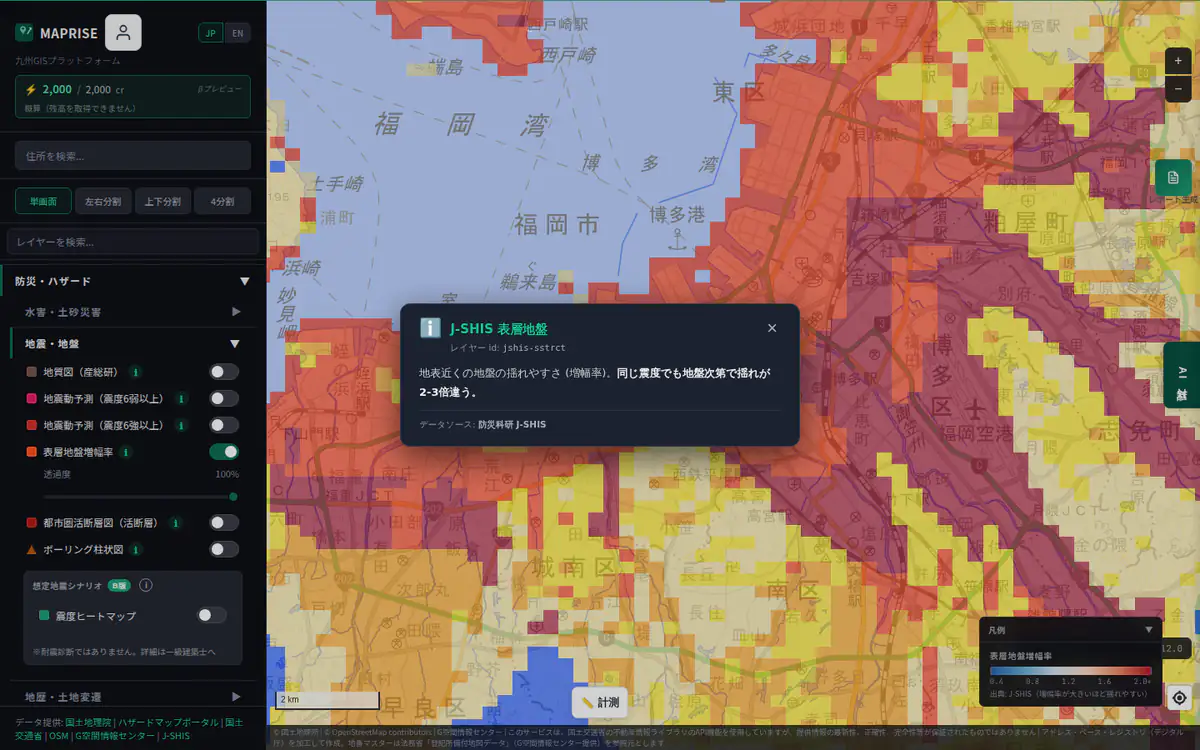
J-SHIS Surface Geology

Starter and above
Show details

Overview

Surface ground amplification factor. Same intensity may shake 2-3x more depending on ground.

Data source

NIED J-SHIS

J-SHIS Surface Geology — Screen example (with legend and click popup)
Screen example (with legend and click popup) ・Click the image to open it full size

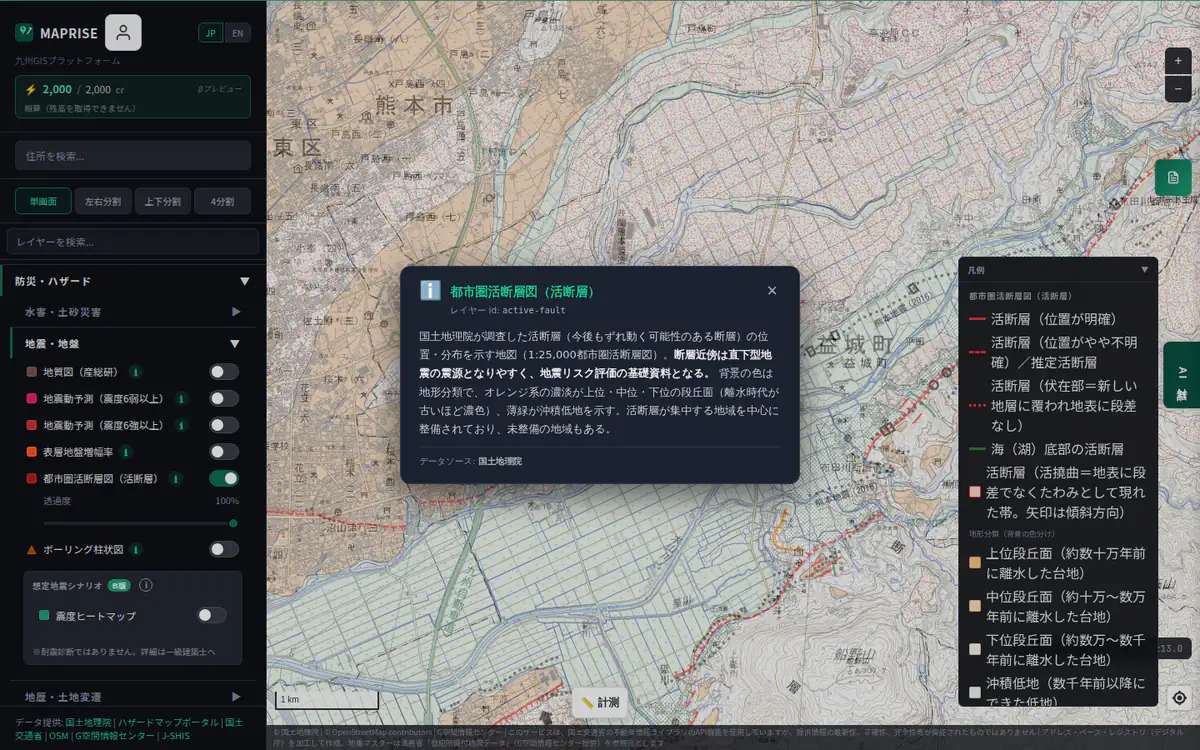
Active Fault Map

Partial coverageStarter and above
Show details
  • Only areas where an Urban Area Active Fault Map has been produced are shown. No display does not mean there is no active fault.

First, how to read an active-fault mapas of 7 October 2026

What is an active fault

GSI defines an active fault as "a fault whose repeated movement, at intervals of roughly a thousand to tens of thousands of years since several hundred thousand years ago, has left traces in the landscape and which is expected to move again". Because such faults can be the source of large earthquakes, they are basic material for assessing inland-earthquake risk.

What this layer shows
  • GSI's Urban Area Active Fault Maps (1:25,000). Production began with urban areas and their surroundings after the 1995 Great Hanshin-Awaji Earthquake and is now extending to the major fault zones nationwide (249 sheets published as of December 2025).
  • In the source legend, a fault whose position is clearly identified is drawn as a solid line and an inferred fault as a dashed line.
  • The background colours are landform classes: shades of orange are river terraces (darker = older) and pale green is alluvial lowland, which helps you see how a fault has offset the landscape.
Please note
  • Only areas where a map sheet has been produced are displayed. A blank can mean "not yet surveyed" and does not mean there is no fault.
  • As a rule, active faults that leave no trace in the landform are not displayed.
  • When the existence or exact position of a fault must be confirmed, a detailed geological survey is needed. Please use this layer as a first-pass guide.
  • Shaking depends on the ground as well as distance from a fault. View it together with the J-SHIS surface-geology and ground-motion layers.

Overview

GSI survey of active faults (surfaces that may shift again) at 1:25,000 scale (Urban Area Active Fault Maps). Areas near active faults are more likely to be the epicenter of inland earthquakes, useful for earthquake risk assessment. Background colors show landform classification: shades of orange are upper/middle/lower river terraces (darker = older), pale green is alluvial lowland. Coverage focuses on fault-dense areas; some areas are not yet surveyed.

Data source

GSI Japan

Active Fault Map — Screen example (with legend and click popup)
Screen example (with legend and click popup) ・Click the image to open it full size

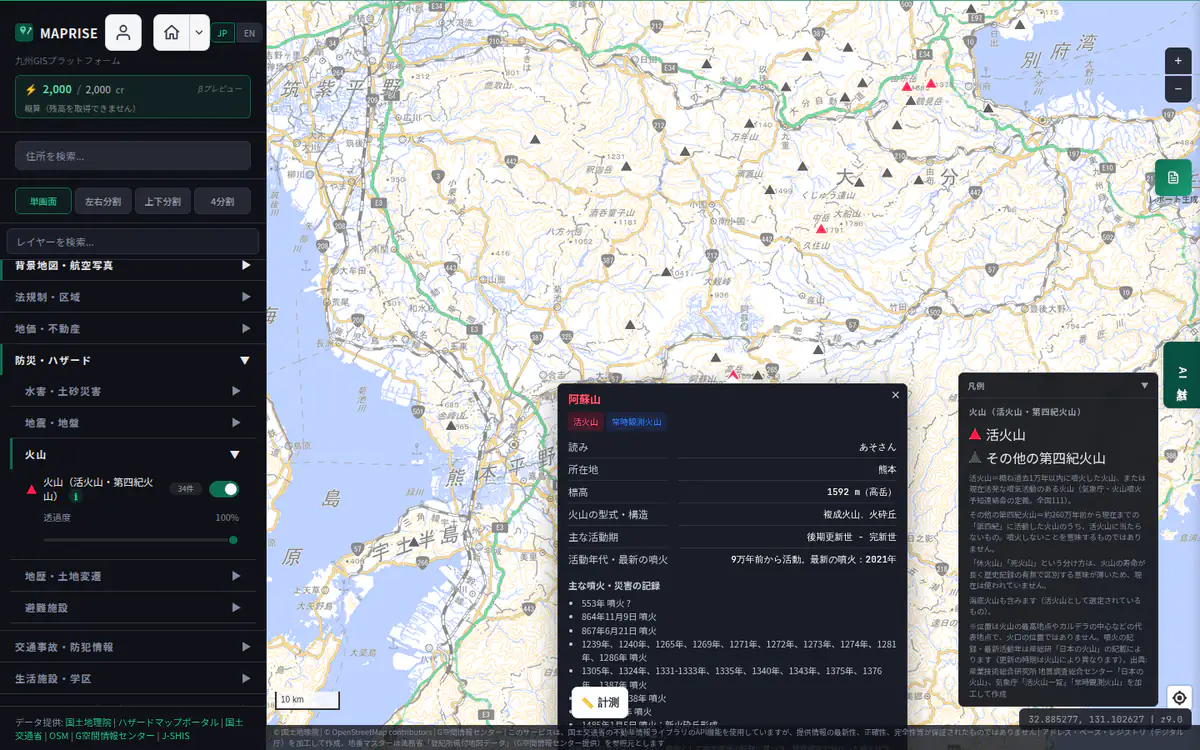
Volcanoes (Active / Quaternary)

EstimateFree
Show details
  • Positions are representative points such as the summit or caldera centre, not crater locations. Current eruption warnings and alert levels are not shown; check JMA for the latest status.

First, a note on terms: what "active volcano" means nowas of 7 October 2026

The "active / dormant / extinct" you may have learned at school is no longer used

Many people learned to sort volcanoes into "active" (eruptions on record), "dormant" (none on record but could erupt) and "extinct" (thought unable to erupt). Volcanoes live for tens to hundreds of thousands of years, so a lack of eruptions in a few hundred or thousand years of records does not prove one will never erupt. JMA therefore no longer uses the "dormant" and "extinct" categories.

How the definition of "active volcano" changed
  • Around 1975: volcanoes with recorded eruptions or vigorous fumarolic activity today (77 volcanoes).
  • 1991: revised to volcanoes that erupted within roughly the past 2,000 years, among others (later 86).
  • 2003 (current definition): "volcanoes that erupted within roughly the past 10,000 years, and volcanoes with vigorous fumarolic activity today" (108 volcanoes).
  • Further surveys added more, and there are now 111 in Japan. Many volcanoes once taught as "dormant" or "extinct" are active volcanoes today (e.g. Mt Fuji; Ontake was also thought extinct until its 1979 eruption).
What this layer shows (on land and at sea)
  • Active volcanoes (bright red): the 111 volcanoes defined by JMA and the Coordinating Committee for Prediction of Volcanic Eruption, including submarine volcanoes and those in the Northern Territories.
  • Other Quaternary volcanoes (dark grey): volcanoes active during the Quaternary (about 2.6 million years ago to now) that are not active volcanoes (from AIST "Volcanoes of Japan"). This does not mean they will never erupt.
  • Shown as ▲ at every zoom level, so volcanoes stay visible even when the whole country is in view.
Click a volcano to see
  • Name, location, elevation, activity period and the latest eruption
  • The past eruption and disaster records compiled by AIST (generally from historical documents)
  • Links to detailed information at AIST, JMA (National Catalogue of the Active Volcanoes) and the Japan Coast Guard (marine volcano database)
  • For the 51 continuously monitored volcanoes that JMA watches around the clock, links to JMA's latest climber information and observation data are also shown.
Please note
  • Positions are representative points such as the summit or caldera centre, not crater locations.
  • Current eruption warnings and volcanic alert levels are not shown in this layer. Always check the latest status on the JMA pages linked from the layer.
  • A property far from a volcano can still be affected by ash and ballistic fragments. Check each volcano's hazard map for ashfall and pyroclastic-flow assumptions.
Examples from around Japan (wide views)
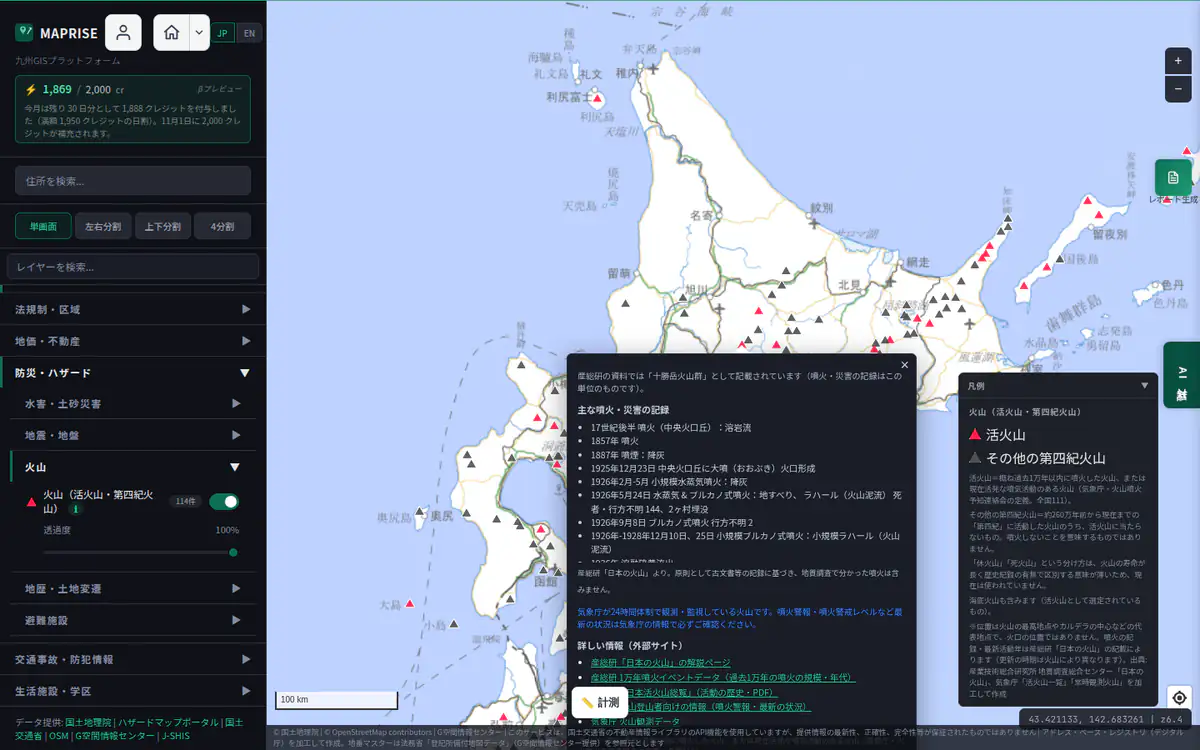
  • Hokkaido and the Northern Territories — Screen example (with legend and click popup)

    Hokkaido and the Northern Territories

    From Rishiri Island through the Shiretoko Peninsula and eastern Hokkaido to the Northern Territories at the right edge, active volcanoes (red) and other Quaternary volcanoes (grey) are scattered across the region. Here the Tokachidake group was clicked: it shows past eruption and disaster records compiled by AIST, such as the 1926 eruption that caused many deaths and missing persons through mudflows, plus links to JMA and other sources for the latest information.

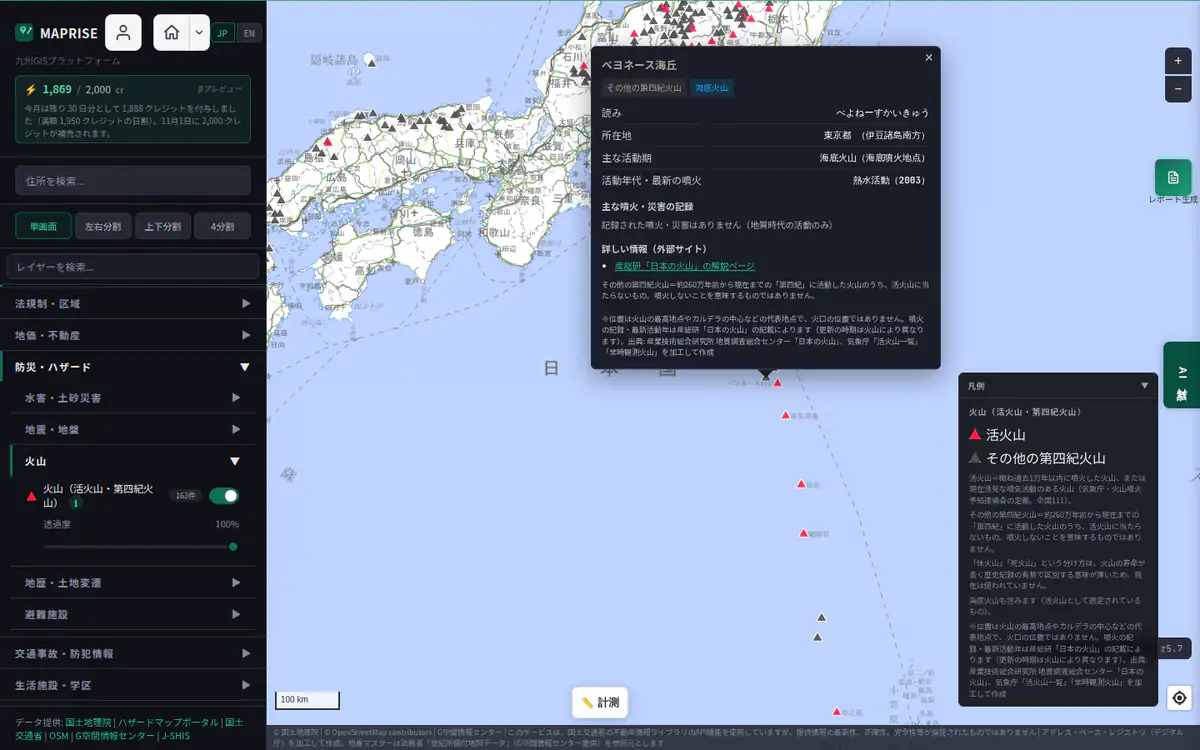
  • Izu and Ogasawara Islands (volcanoes at sea) — Screen example (with legend and click popup)

    Izu and Ogasawara Islands (volcanoes at sea)

    South of Honshu in the Pacific, volcanoes line up north to south as islands and submarine volcanoes. A feature of this layer is that volcanoes at sea can be checked as well as those on land. Here the submarine volcano "Bayonnaise Rocks" (south of the Izu Islands) was clicked, showing a record of hydrothermal activity (2003).

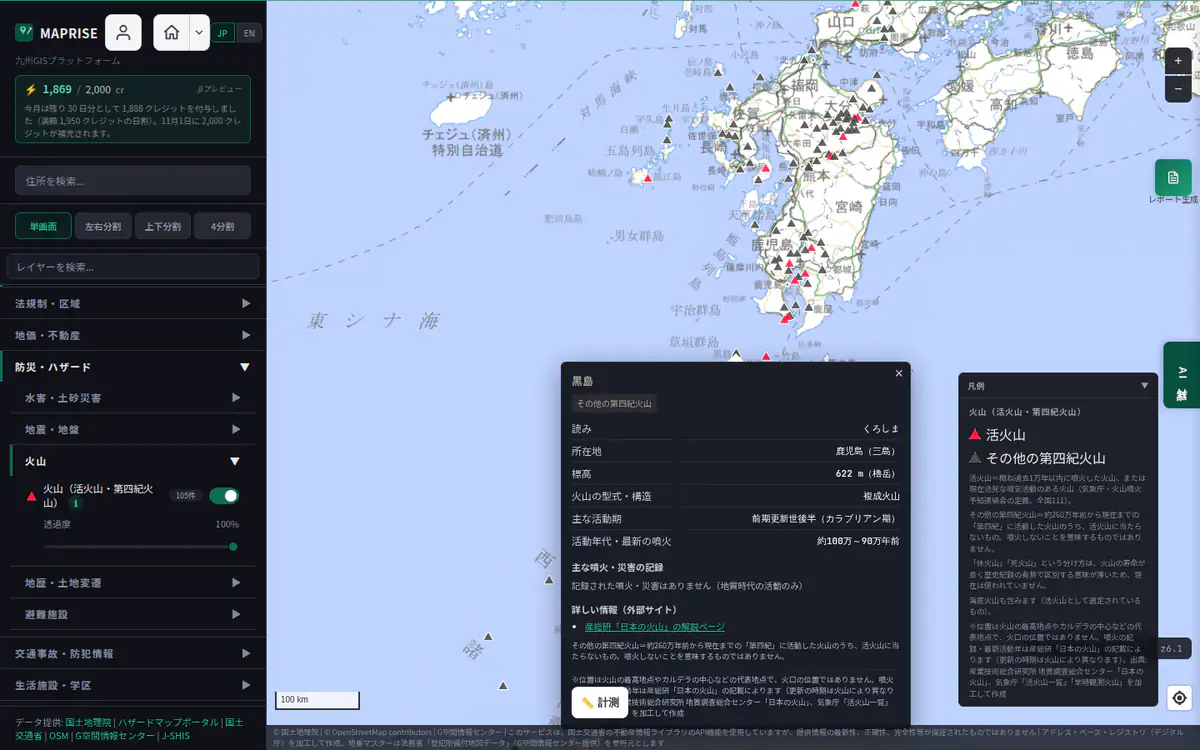
  • Kyushu to the Nansei Islands — Screen example (with legend and click popup)

    Kyushu to the Nansei Islands

    Kyushu is where volcanoes look especially dense, and more continue on the islands to the south. Here "Kuroshima" (Mishima Village, Kagoshima), a Quaternary volcano that is not an active volcano, was clicked. Its activity dates to about 1.0 to 0.9 million years ago and no eruption is recorded. Because active volcanoes are defined by eruptions within roughly the past 10,000 years, volcanoes like this are shown in grey.

Overview

Locations of volcanoes across Japan (including the Northern Territories and submarine volcanoes), coloured as "active volcano" or "other Quaternary volcano". Active volcanoes (bright red) are those defined by JMA and the Coordinating Committee for Prediction of Volcanic Eruption as having erupted within roughly the last 10,000 years or showing vigorous fumarolic activity today; there are 111 in Japan. Other Quaternary volcanoes (dark grey) were active during the Quaternary (about 2.6 million years ago to now) but are not active volcanoes; they come from AIST "Volcanoes of Japan". This does not mean they will never erupt. The old "dormant / extinct" classification is no longer used. Click a point for its name, location, elevation, activity period and latest eruption, the eruption and disaster records compiled by AIST (in Japanese), and links to AIST, JMA (National Catalogue of the Active Volcanoes) and the Japan Coast Guard. The 51 volcanoes JMA monitors around the clock also link to JMA climber information and observation data. Note: positions are representative points such as the summit or caldera centre, not crater locations. Current eruption warnings and volcanic alert levels are not shown; always check JMA for the latest status.

Data source

Created from "Volcanoes of Japan" (Geological Survey of Japan, AIST) and the JMA lists of active and continuously monitored volcanoes

Volcanoes (Active / Quaternary) — Screen example (with legend and click popup)
Screen example (with legend and click popup) ・Click the image to open it full size

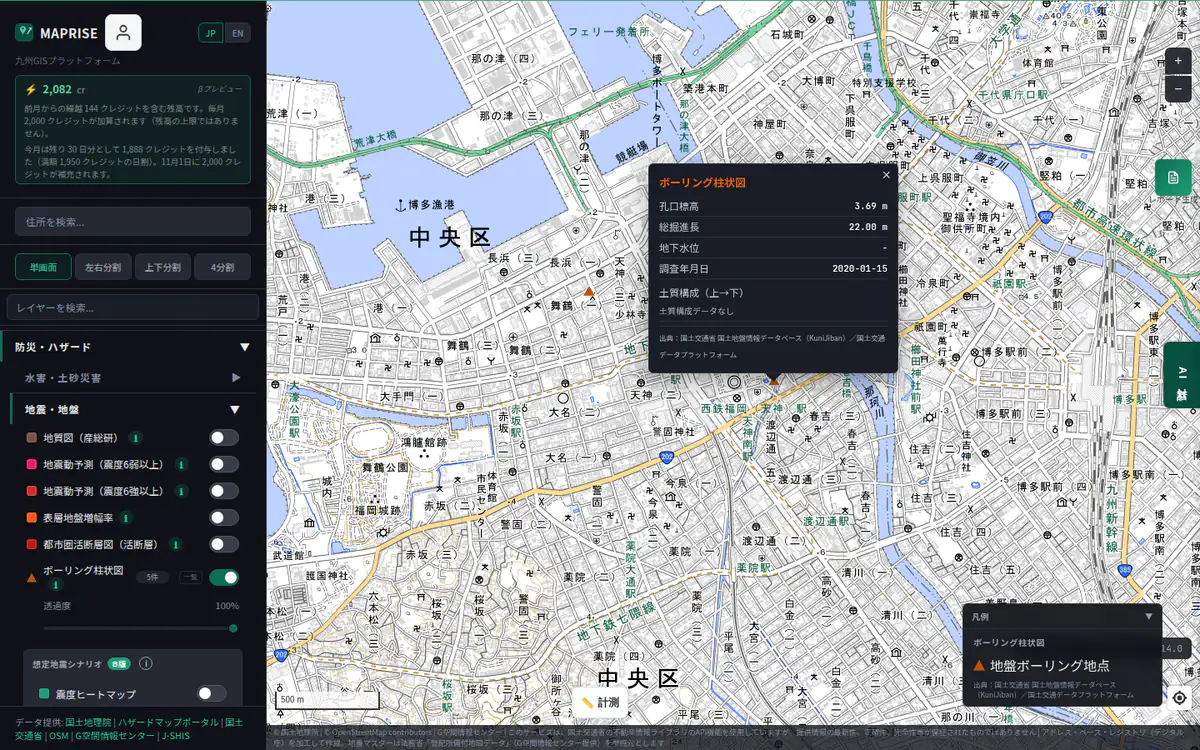
Borehole Logs

Free (partly paid plans)
Show details

Free: locations and sources only. Concrete values (elevation, total depth, groundwater level, survey year, soil profile) and the link to the source data need Pro or above.

Overview

Geotechnical borehole points from the National Ground Information DB (KuniJiban) via MLIT DPF (all 47 prefectures, ~260,000 points as of Nov 2026), plus borehole logs published by local governments (Ibaraki, Nagasaki, Gunma, Fukui, Tottori, Shiga, Tochigi and Hiroshima prefectures; Mito, Chikuma, Chiba, Otsu, Fukuoka, Hofu, Machida and Urayasu cities) and AIST (Kanto) (~43,000 points as of Nov 2026). Locations and sources are visible to everyone; concrete values and details (elevation, total depth, groundwater level, survey year, soil profile, link to the source data) are available on Pro and above (Machida, Urayasu and Hiroshima: location and survey date only; Fukuoka: borehole header only). Boreholes on the old Japanese datum can be off by about 400 m. Local-government points that overlap MLIT points within 30 m are partly omitted. Useful for spotting soft ground and preliminary foundation studies.

Data source

MLIT National Ground Information DB (KuniJiban) / MLIT Data Platform; local-government ground information (Geo-Station: Ibaraki, Nagasaki, Gunma, Fukui, Tottori, Shiga, Mito, Chikuma, Chiba, Otsu); Tochigi Prefecture and Fukuoka City (BODIK, CC BY); Hiroshima Prefecture Infrastructure Management Platform Dobox (CC BY); Hofu City (Yamaguchi Open Data Catalog, CC BY); Machida City Open Data (CC BY); Urayasu City map data (BODIK, CC BY 4.0); AIST Geological Survey of Japan (Government Standard Terms of Use 2.0)

Borehole Logs — Screen example (with legend and click popup)
Screen example (with legend and click popup) ・Click the image to open it full size

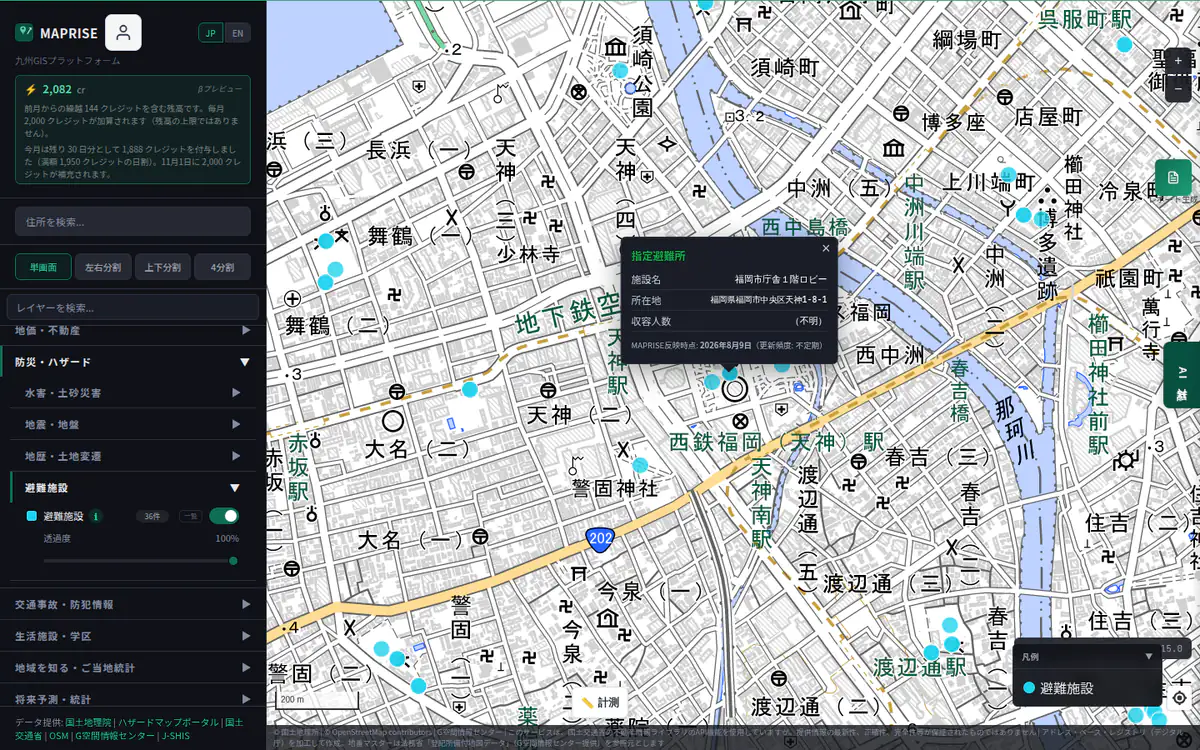
Evacuation Facilities

Related to 重説Free
Show details

Overview

Designated emergency evacuation sites and shelters nationwide (~199,000). Categorized by disaster type. Recommended for property disclosure.

Data source

Designated Emergency Evacuation Sites and Shelters (GSI)

Evacuation Facilities — Screen example (with legend and click popup)
Screen example (with legend and click popup) ・Click the image to open it full size

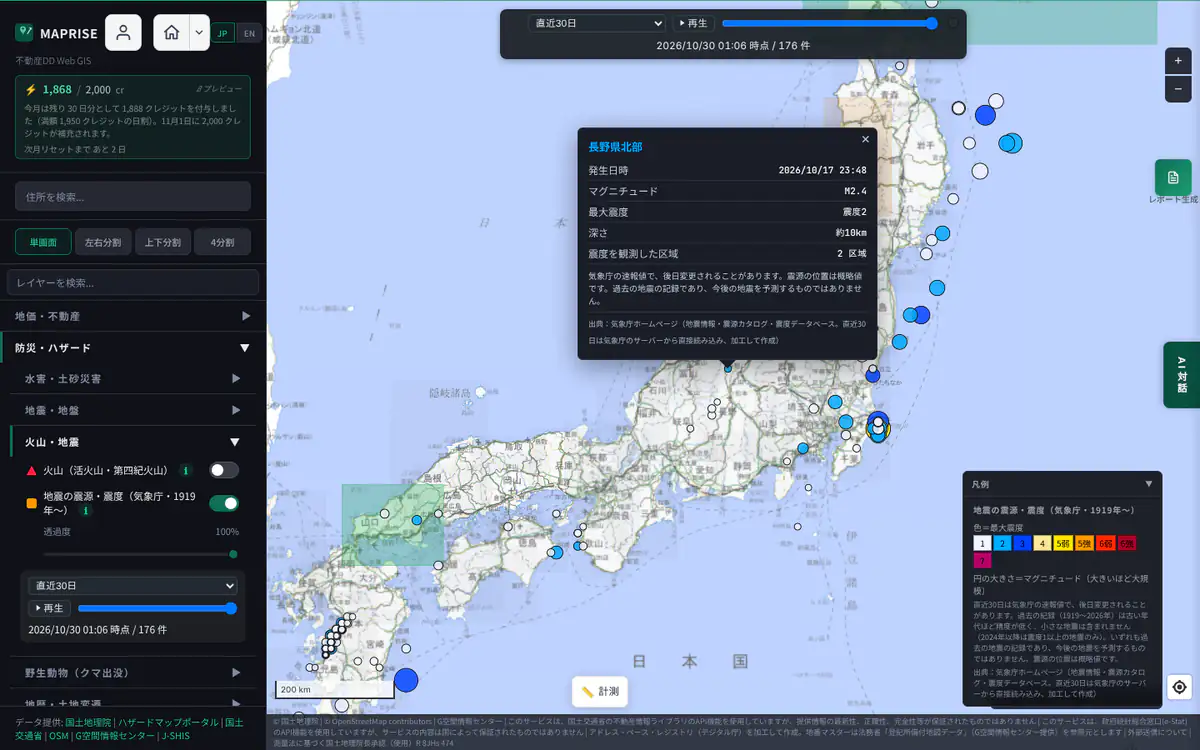
Earthquakes: Epicentres & Intensity (JMA, 1919–)

Partial coverageEstimateTime-series dataFree
Show details

Step through earthquakes year by year from 1919 to 2026.You can also ask the AI chat about a specific past year or compare with the past (questions without a year use the latest data).

  • The last ~30 days and the historical record for 1919–2026 can be shown. From 2024 the historical record includes only earthquakes with intensity 1 or above.
  • Values for the last 30 days are preliminary JMA values that may be revised later. In the historical record, epicentre and magnitude accuracy is lower for older years and small events are not included. Epicentre positions are approximate and place names are JMA English names. This is a record of past earthquakes, not a prediction.

Overview

Shows the epicentre, magnitude and maximum seismic intensity of earthquakes in and around Japan, from Japan Meteorological Agency (JMA) earthquake information. The last ~30 days are loaded directly from JMA servers (refreshed when you move the map, if about a minute or more has passed since the last fetch), and the historical record (1919–2026) is shown year by year from the JMA hypocentre catalogue, processed by MAPRISE. Circle size shows magnitude and colour shows maximum seismic intensity (JMA standard colours). Click a circle for the date and time, magnitude, maximum intensity, depth and more. Use the panel under this layer in the menu (or at the top of the map): for the last 30 days you can go back in time or press play to watch earthquakes appear in order; switch to "Historical record (by year)" to move the slider in units of one year (1919–2026), or to "All history (by magnitude)" to pick magnitude ranges (M1 or less to M7+) and show the whole period together. Values for the last 30 days are preliminary JMA values and may be revised later. Epicentre positions are approximate. This is a record of past earthquakes, not a prediction of future ones. In the historical record, epicentre and magnitude accuracy is lower for older years and small events are not included. Place names are JMA's English names up to 2023 and Japanese from 2024. From 2024 the historical record comes from the JMA Seismic Intensity Database and includes only earthquakes with intensity 1 or above (small events are not included).

Data source

Created by processing earthquake information, the hypocentre catalogue and the Seismic Intensity Database from the Japan Meteorological Agency website

Earthquakes: Epicentres & Intensity (JMA, 1919–) — Screen example (with legend and click popup)
Screen example (with legend and click popup) ・Click the image to open it full size

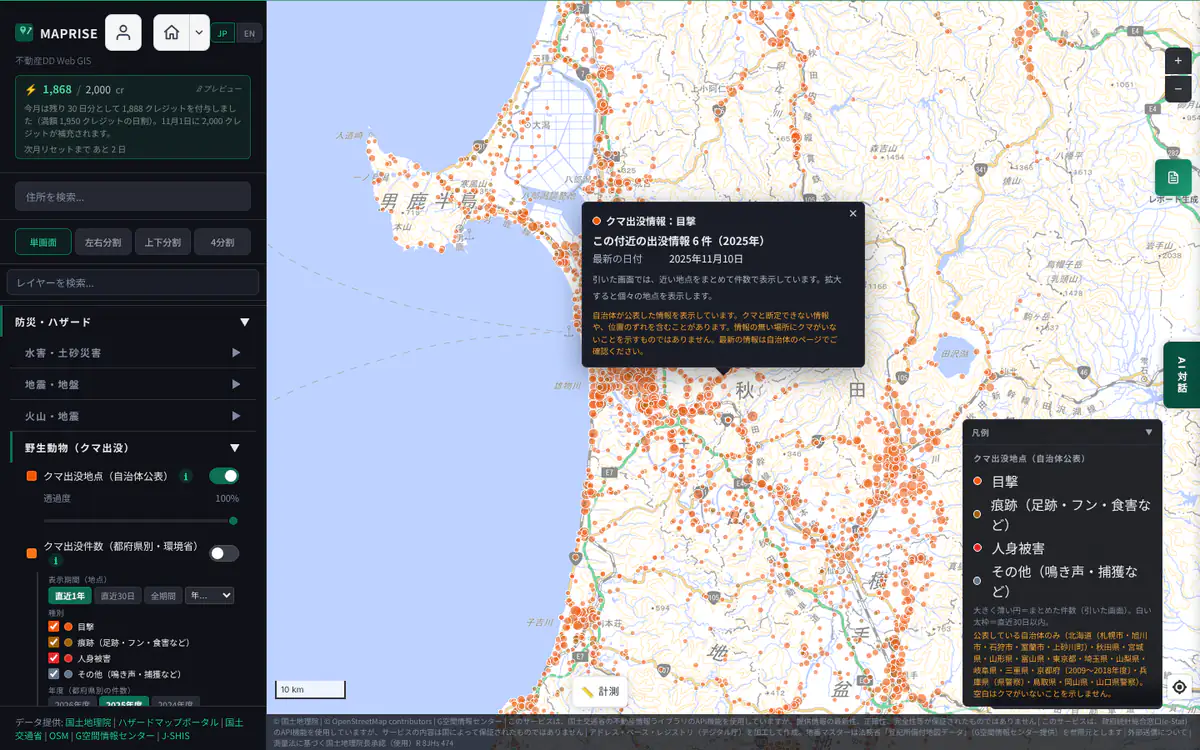
Bear sightings (published by local governments)

Partial coverageEstimateTime-series dataFree
Show details

Filter sightings by year from 2009, or by the last 12 months, last 30 days or all time.

  • Only areas where local governments publish data (five municipalities in Hokkaido, Akita, Miyagi, Yamagata, Niigata, Toyama, Tokyo, Saitama, Yamanashi, Gifu, Mie, Kyoto, Hyogo [prefectural police], Tottori, Okayama and Yamaguchi). Blank areas do not mean there are no bears.
  • Reports may include cases not confirmed as bears or slightly mislocated points. Check each local government page for the latest information.

Overview

Bear reports (sightings, signs and human injuries) published by local governments, shown as points. Coverage: Hokkaido (Sapporo, Asahikawa, Ishikari, Muroran and Kamisunagawa), Akita, Miyagi, Yamagata, Niigata, Toyama, Tokyo, Saitama, Yamanashi, Gifu, Mie, Kyoto (FY2009–2018), Hyogo (police), Tottori, Okayama and Yamaguchi (police) only; areas whose governments do not publish data are not shown. Blank areas do not mean there are no bears. When zoomed out, nearby reports are grouped and counted; zoom in to see each point with its date, type, place and details. Filter by period (last 12 months, last 30 days, all, or a year) and by type. Types follow the local government's classification; where none is given they are classified from the description. Some reports may not be confirmed as bears or may be slightly mislocated. Municipality names are derived from the point location. Where the same report is published by two local governments (Miyagi and Sendai, Tokyo and Yamanashi, Yamagata and Yonezawa), reports on the same day at nearby locations are shown once. Locations in Yamanashi are only a rough indication. Check each local government's page for the latest information.

Data source

Created from data by Akita Prefecture ("Kumadas", CC BY 4.0), Miyagi Prefecture, the City of Sendai (CC BY 4.0), the City of Yonezawa (CC BY 4.0), Yamagata Prefecture, Toyama Prefecture, the Niigata Prefecture Wildlife Damage Control Support Center (Niigata Bear Sighting Map), Hyogo Prefectural Police, the City of Sapporo (CC BY 4.0), the City of Asahikawa (CC BY 2.1), the City of Ishikari (CC BY 4.0), the City of Muroran (Public Data License 1.0), the Town of Kamisunagawa (CC BY 4.0), the Tokyo Metropolitan Government (CC BY 4.0), Saitama Prefecture (Public Data License 1.0), Yamanashi Prefecture, Gifu Prefecture (CC BY 2.1 JP), Kyoto Prefecture (CC BY 4.0), Tottori GeoMap (Tottori Prefecture), Okayama Prefecture, Mie Prefecture and Yamaguchi Prefecture (bear sightings recognized by the prefectural police, CC BY)

Bear sightings (published by local governments) — Screen example (with legend and click popup)
Screen example (with legend and click popup) ・Click the image to open it full size

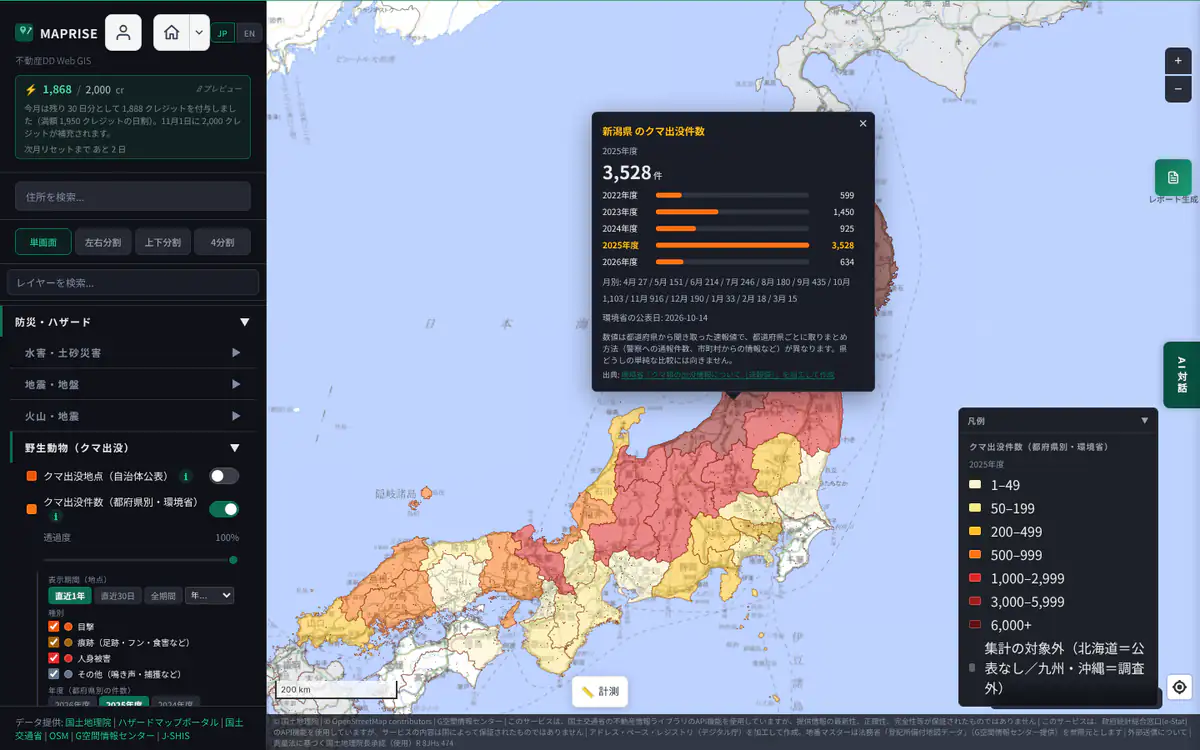
Bear appearances by prefecture (Ministry of the Environment)

EstimatePartial coverageTime-series dataFree
Show details

Switch between the last five fiscal years to compare counts by prefecture or municipality.

  • Preliminary figures collected by the Ministry of the Environment from prefectures; each prefecture compiles them differently, so simple comparisons between prefectures are not appropriate. Hokkaido and the eight Kyushu/Okinawa prefectures are grey (not covered).
  • In the "By municipality" view, only areas covered by published data are coloured. Uncoloured areas only mean nothing is published, not that there are no bears. Fiscal years only partly published are shown in a separate colour and cannot be compared.

Overview

Bear appearance counts by prefecture from the Ministry of the Environment's preliminary figures, coloured by fiscal year (last five fiscal years, 38 prefectures (excluding Hokkaido and the eight prefectures of Kyushu and Okinawa)). Click a prefecture to see the trend by year and the monthly counts. The figures are preliminary values collected from each prefecture, and each prefecture compiles them differently (police reports, municipal information, etc.), so simple comparisons between prefectures are not appropriate. Hokkaido (does not publish counts) and the eight prefectures of Kyushu and Okinawa (outside the survey because bears do not live there) are shown in grey. Boundaries are built from census small-area boundaries. Switching "Aggregation unit" to "By municipality" colours municipalities by fiscal-year counts. Only areas covered by published data are coloured; municipalities with no published data are left uncoloured (distinct from zero reports), and fiscal years only partly published are shown in a separate colour and cannot be compared. For Wakayama the prefecture's published municipal count table is used (FY2017 onward; FY2026 is a progress figure through 30 September); for other prefectures and cities, the imported report points are counted per municipality. Uncoloured areas only mean nothing is published, not that there are no bears.

Data source

Created from the Ministry of the Environment "Bear appearance information [preliminary figures]" (boundaries: processed from e-Stat census boundary data). The municipal view is created from bear information published by local governments (same sources as "Bear sighting points") and the Wakayama Prefecture website "Bear sighting counts by municipality" (https://www.pref.wakayama.lg.jp/prefg/032600/yasei/kuma.html)

Bear appearances by prefecture (Ministry of the Environment) — Screen example (with legend and click popup)
Screen example (with legend and click popup) ・Click the image to open it full size

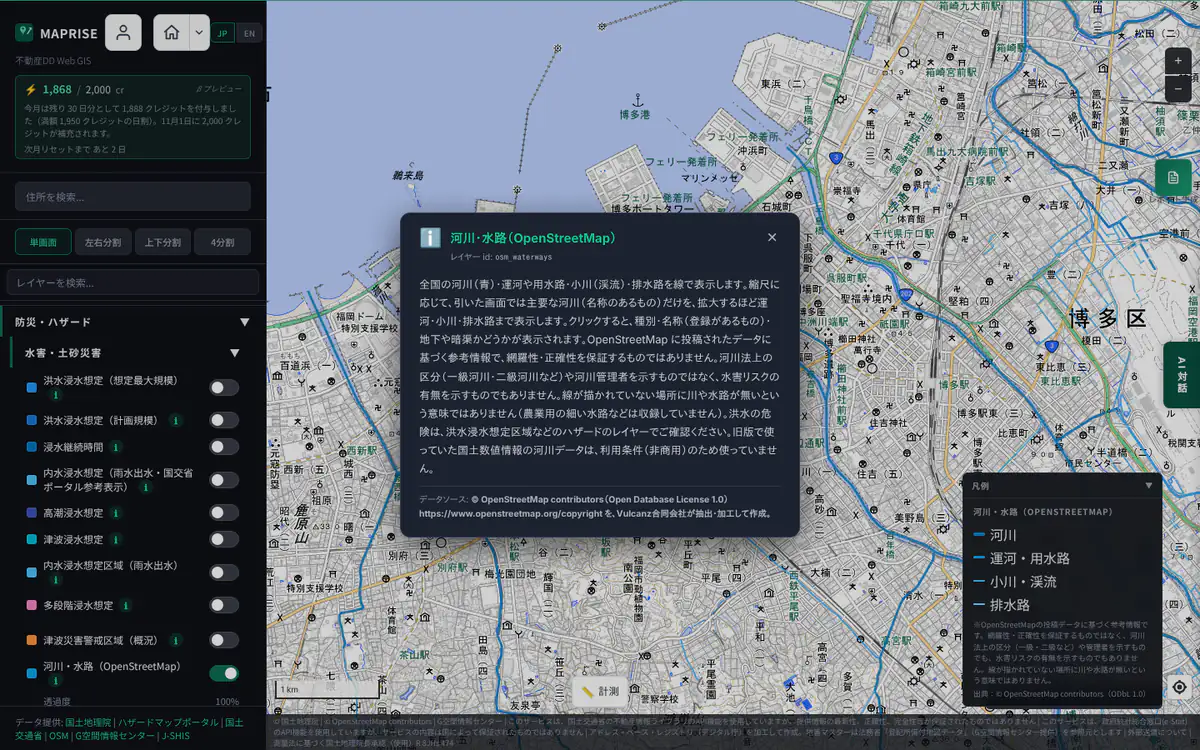
Rivers and Waterways (OpenStreetMap)

Partial coverageFree
Show details
  • Reference information based on data contributed to OpenStreetMap. Completeness and accuracy are not guaranteed, and a place with no line does not mean there is no river or channel (narrow agricultural ditches are not included).

Overview

Shows rivers, canals and irrigation channels, streams and drains nationwide as lines. Zoomed out, only major named rivers are shown; canals, streams and drains appear as you zoom in. Click for the type, the name (where registered) and whether the waterway is underground or in a culvert. Reference information based on data contributed to OpenStreetMap; completeness and accuracy are not guaranteed. It does not show the river classification under the River Act (Class A / Class B, etc.) or the river administrator, and does not indicate flood risk. A place with no line drawn does not mean there is no river or channel (narrow agricultural ditches are not included). For flood danger, please check the hazard layers such as the flood inundation assumption areas. The National Land Numerical Information river data used in an earlier version is not used because its terms are non-commercial.

Data source

© OpenStreetMap contributors (Open Database License 1.0) https://www.openstreetmap.org/copyright, extracted and processed by Vulcanz LLC.

Rivers and Waterways (OpenStreetMap) — Screen example (with legend and click popup)
Screen example (with legend and click popup) ・Click the image to open it full size
Show details
  • Miyagi, Gifu and Yamaguchi only (Miyagi: March 2024 edition; Gifu: as of March 2026; Yamaguchi: as of March 2023, primary and secondary classes only). Emergency transport roads of other prefectures are not shown (turning the layer on shows the covered prefectures, and zooming out to all of Japan shows them as boxes). It does not show actual passability or traffic restrictions in a disaster, or later revisions of the routes.

Overview

Shows the emergency transport roads published by each prefecture as lines, colored by primary / secondary / tertiary class (primary and secondary only for Yamaguchi). It covers Miyagi (March 2024 edition), Gifu (as of March 2026) and Yamaguchi (as of March 2023); other prefectures are not shown (prefectures will be added in turn). Each time you turn it on, a window tells you which prefectures are covered, and zooming out to all of Japan shows them as boxes on the map (covered in red, not covered in gray). Click for the class, administrator, route name, section and length. Reference information based on each prefecture’s open data (CC BY); it does not show actual passability or traffic restrictions in a disaster or later revisions of the routes, and is not a basis for legal procedures. The National Land Numerical Information emergency transport road data is not used because its terms are non-commercial.

Data source

- Miyagi Prefecture "Miyagi Prefecture Emergency Transport Roads" (March 2024 edition, CC BY 4.0) - Road Maintenance Division, Gifu Prefecture, "Emergency Transport Road Network Map" (as of March 2026, Creative Commons Attribution) - Road Construction Division, Yamaguchi Prefecture, "Emergency Transport Road Network Plan (March 2023)" (CC BY, Public Data License 1.0) - All processed by Vulcanz LLC

Emergency Transport Roads (Miyagi, Gifu, Yamaguchi) — Screen example (with legend and click popup)
Screen example (with legend and click popup) ・Click the image to open it full size
Show details
  • Only extents based on materials the Ministry of Land, Infrastructure, Transport and Tourism collected around densely inhabited districts; it does not cover every past disaster. A place with no extent drawn is not necessarily safe.

Overview

Shows the extents (areas) of past disasters such as flooding, levee breaches, storm surge, tsunami, slope failures, landslides, debris flows and liquefaction, coloured by type (MLIT 'Disaster History', Real Estate Information Library). Click a point to see the type, date and source material of the past disasters overlapping it. The legend lets you filter by disaster type (flood / levee breach, storm surge, tsunami, sediment disaster, liquefaction) and by year (e.g. from 1950). 'Natural Disaster Monuments' shows the monument locations (points); this layer shows the extent (area) of the disasters themselves. Overlay them to compare what the monuments commemorate with the areas actually affected. Note: it covers only materials MLIT collected around densely inhabited districts (flood records, municipal documents, etc.) and does not cover every past disaster. A place with no extent shown is not necessarily safe, and the layer does not predict future disasters. It is not a basis for legal procedures or important-matter explanations. For an individual parcel, check the municipal hazard map or the responsible office.

Data source

Created by processing MLIT 'Disaster History' (Real Estate Information Library API). The source material for each disaster is shown in the popup

Disaster History (Extents of Past Disasters) — Screen example (with legend and click popup)
Screen example (with legend and click popup) ・Click the image to open it full size

Building Flood Depth (PLATEAU, Reference)

Limited regionsStarter and above
Show details
  • Limited to municipalities where PLATEAU records building flood depth. In other municipalities, a building with no color does not mean it will not flood. The color is the deepest value among assumptions whose premises (rainfall, tide level, tsunami scale) differ. Available on the Starter plan and above.

Overview

Shows the assumed flood depth of each building, colored in six classes (under 0.5 m, 0.5 to 3 m, 3 to 5 m, 5 to 10 m, 10 to 20 m, 20 m or more), for the municipalities where PLATEAU records building flood depth. The color is the deepest value among the assumptions for rivers (planned scale L1, maximum assumed scale L2), storm surge, tsunami and inland flooding. The assumptions (rainfall, tide level, tsunami scale) differ, so the values are not for one and the same disaster. This is reference information recorded in the Project PLATEAU 3D city models (MLIT), based on flood inundation maps, and is an assumption at the time of publication. It does not predict or guarantee actual flooding. Shown at zoom level 14 and above. Click for the maximum depth and the breakdown by assumption. Available on the Starter plan and above. Limited to municipalities where PLATEAU records building flood depth; other municipalities are not covered. An uncolored building does not mean it will not flood. It cannot be used as a basis for important-matter explanations or contracts. Check the flooding assumptions with the municipal hazard map or the river administrator inundation map.

Data source

Processed by Vulcanz LLC from the Project PLATEAU 3D city models (MLIT, PDL 1.0).

Building Flood Depth (PLATEAU, Reference) — Screen example (with legend and click popup)
Screen example (with legend and click popup) ・Click the image to open it full size
↑ Back to top

Living & facilities2621184525 layers

Medical and welfare facilities, schools and districts, rail, bus, city gas and water — everyday convenience and surroundings, overlaid.

What this group tells you

  • Where nearby clinics, care and welfare facilities and schools are, and which school district applies
  • Transit convenience from rail lines, stations, bus stops and station ridership
  • City gas and water service areas, plus nearby cemeteries, religious facilities and public offices

Everyday problems it helps with

  • Real Estate BrokersBuyers always ask about school districts, stations and hospitals, and re-researching each one per property is time-consuming.
  • Developers / FundsWant to judge everyday convenience and gas/water availability of a planned site early.
  • Local GovernmentWant to see facility placement and gaps on a map that is close to residents' own view.

Layers in this group

Show layer list

Medical Facilities

Free
Show details

Overview

Hospitals and clinics (all 47 prefectures, ~180,000 as of Nov 2026). For medical access in location assessment.

Data source

KSJ P04

Medical Facilities — Screen example (with legend and click popup)
Screen example (with legend and click popup) ・Click the image to open it full size

Welfare Facilities

Partial coverageFree
Show details
  • Prefectures and municipalities whose terms restrict commercial use are not included (some areas are blank).

Overview

Protection facilities, child welfare, mother/child welfare facilities, community support centers (~90,000 nationwide, as of 2026). Elderly-care and disability-welfare service providers have been split into dedicated layers (Elderly Care Service Providers / Disability Welfare Service Providers). Regions where commercial use is restricted per MLIT's terms-of-use table are excluded from coverage.

Data source

KSJ P14 (FY2023 edition)

Welfare Facilities — Screen example (with legend and click popup)
Screen example (with legend and click popup) ・Click the image to open it full size

Elderly Care Service Providers

Free (partly paid plans)
Show details

Free: about 1/10 of the points, thinned across Japan. All points need Starter or above.

Overview

Long-term care insurance service providers nationwide (35 service types incl. home-visit care, day care, nursing homes; 222,614 records). For aging-society location assessment and care-business market research. Updated twice yearly (as of end of June 2026).

Data source

MHLW Long-Term Care Service Information Open Data (commercial use permitted)

Elderly Care Service Providers — Screen example (with legend and click popup)
Screen example (with legend and click popup) ・Click the image to open it full size

Disability Welfare Service Providers

Free (partly paid plans)
Show details

Free: about 1/10 of the points, thinned across Japan. All points need Starter or above.

Overview

Disability welfare service providers nationwide (29 service types incl. daily-life care, employment support, group homes; 209,452 records). For disability-welfare location assessment and provider research. Updated twice yearly (as of end of March 2026). One office number may cover multiple registered facilities (e.g. residential + day-service units) per source design.

Data source

WAM NET Disability Welfare Service Information Open Data (commercial use permitted)

Disability Welfare Service Providers — Screen example (with legend and click popup)
Screen example (with legend and click popup) ・Click the image to open it full size

Schools

Free
Show details

Overview

Elementary/middle/high/university/kindergarten (all 47 prefectures, ~57,000 as of Nov 2026). For family-oriented location.

Data source

KSJ P29

Schools — Screen example (with legend and click popup)
Screen example (with legend and click popup) ・Click the image to open it full size

Elementary School Districts

Partial coverageFree (partly paid plans)
Show details
  • Some municipalities are not covered yet (listed under "Municipalities not yet covered" below). No display does not mean there is no school district.
Municipalities not yet covered (82)as of 15 November 2026

The municipalities below are not covered by this layer yet; all others are covered (designated cities are shown with their number of wards). Municipality names are in Japanese.

北海道
札幌市(全10区)、南富良野町、厚真町、士幌町、鹿追町
青森県
八戸市
岩手県
岩泉町
宮城県
多賀城市
秋田県
湯沢市
山形県
天童市
福島県
郡山市、喜多方市、双葉町
茨城県
常陸大宮市
栃木県
佐野市
群馬県
桐生市、藤岡市
埼玉県
熊谷市、本庄市
千葉県
船橋市、茂原市、横芝光町
神奈川県
小田原市、座間市、湯河原町
新潟県
新潟市(全8区)
富山県
滑川市
福井県
鯖江市、永平寺町
山梨県
南アルプス市、甲斐市
長野県
駒ヶ根市、塩尻市、東御市
岐阜県
高山市
静岡県
富士宮市、富士市、裾野市
愛知県
豊川市、犬山市
三重県
津市、桑名市
滋賀県
彦根市、長浜市
京都府
京都市(全11区)、京田辺市
大阪府
泉佐野市、富田林市、泉南市、熊取町
兵庫県
伊丹市、養父市
奈良県
大和郡山市、桜井市
和歌山県
広川町、串本町
島根県
雲南市
岡山県
岡山市(全4区)、新見市
広島県
庄原市
山口県
宇部市、山口市、防府市、長門市
徳島県
東みよし町
香川県
坂出市、善通寺市
高知県
土佐市
福岡県
飯塚市、筑後市、朝倉市、糸島市、須恵町、広川町
長崎県
大村市、南島原市
熊本県
菊陽町
大分県
日田市、九重町
鹿児島県
曽於市、奄美市、姶良市

Free: the map display. School name, district name, location and population trends shown on click need Starter or above.

Overview

Elementary school catchment areas (~17,200 records across about 1,700 municipalities in all 47 prefectures, as of Nov 2026). Key axis for family-oriented real estate. Click to see population trends from the national Census (2005-2020, every 5 years, actual counts) and projected population (2025-2050, estimates). Fukuoka City also shows yearly resident-register counts. The map display is free; the details shown on click need Starter or above.

Data source

MLIT National Land Numerical Information A27 (FY2023; FY2021 edition for some municipalities missing in FY2023) / Fukuoka City: Fukuoka City Open Data (CC BY 4.0) / Akashi, Higashiosaka, Kaizuka, Sakai, Yaizu, Fukuroi, Tsubame, Himeji: estimated from each city's published address lists (CC BY etc.) joined to Census town blocks / Mito, Toyama, Shimotsuke, Sanyo-Onoda, Tsuruga, Takasago, Kihoku, Joyo, Kishiwada, Kasukabe, Tsuchiura, Tokorozawa, Soka and Kudamatsu: estimated by joining the attendance-area materials (address lists etc.) of each municipality, used after the municipality confirmed that this is acceptable, to Census town blocks (departments and dates of the replies are listed in the Data Sources page at maprise.jp) / Fujinomiya: the text of the city regulation is shown as published, after the city confirmed that this is acceptable / municipalities with a single school: whole municipality / Population: national Census 2005-2020 (actual counts, Statistics Bureau) and projected population 2025-2050 (estimates; 2020 Census counts scaled by the growth rate of the MLIT 500 m / 250 m projected-population mesh)

Elementary School Districts — Screen example (with legend and click popup)
Screen example (with legend and click popup) ・Click the image to open it full size

Junior High School Districts

Partial coverageFree (partly paid plans)
Show details
  • Some municipalities are not covered yet (listed under "Municipalities not yet covered" below). No display does not mean there is no school district.
Municipalities not yet covered (78)as of 15 November 2026

The municipalities below are not covered by this layer yet; all others are covered (designated cities are shown with their number of wards). Municipality names are in Japanese.

北海道
札幌市(全10区)、厚真町、鹿追町
青森県
八戸市
岩手県
岩泉町
宮城県
多賀城市
秋田県
湯沢市
山形県
天童市
福島県
郡山市、喜多方市、双葉町
茨城県
常陸大宮市
栃木県
佐野市、上三川町
群馬県
藤岡市
埼玉県
本庄市
千葉県
船橋市、茂原市、横芝光町
神奈川県
小田原市、座間市
新潟県
新潟市(全8区)
富山県
滑川市
福井県
鯖江市
山梨県
南アルプス市、甲斐市
長野県
駒ヶ根市、塩尻市、南相木村、北相木村、長和町、平谷村
岐阜県
高山市
静岡県
富士宮市、富士市、裾野市
愛知県
豊川市、犬山市
三重県
津市、桑名市
滋賀県
彦根市、長浜市
京都府
京都市(全11区)、京田辺市、笠置町
大阪府
泉佐野市、富田林市、泉南市、熊取町
兵庫県
伊丹市
奈良県
大和高田市、大和郡山市、桜井市、三宅町
和歌山県
広川町、串本町
鳥取県
日吉津村
島根県
雲南市
岡山県
岡山市(全4区)、新見市
広島県
庄原市
山口県
宇部市、山口市、防府市、長門市
徳島県
東みよし町
香川県
坂出市
高知県
土佐市
福岡県
飯塚市、筑後市、朝倉市、糸島市、須恵町
長崎県
大村市、南島原市
熊本県
菊陽町
大分県
日田市
鹿児島県
曽於市

Free: the map display. School name, district name, location and population trends shown on click need Starter or above.

Overview

Junior high school catchment areas (~8,500 records across about 1,700 municipalities in all 47 prefectures, as of Nov 2026). Click to see population trends from the national Census (2005-2020, every 5 years, actual counts) and projected population (2025-2050, estimates). Fukuoka City also shows yearly resident-register counts. The map display is free; the details shown on click need Starter or above.

Data source

MLIT National Land Numerical Information A32 (FY2023; FY2021 edition for some municipalities missing in FY2023) / Fukuoka City: Fukuoka City Open Data (CC BY 4.0) / Akashi, Higashiosaka, Kaizuka, Sakai, Yaizu, Fukuroi, Tsubame, Himeji: estimated from each city's published address lists (CC BY etc.) joined to Census town blocks / Mito, Toyama, Shimotsuke, Sanyo-Onoda, Tsuruga, Takasago, Kihoku, Joyo, Kishiwada, Kasukabe, Tsuchiura, Tokorozawa, Soka and Kudamatsu: estimated by joining the attendance-area materials (address lists etc.) of each municipality, used after the municipality confirmed that this is acceptable, to Census town blocks (departments and dates of the replies are listed in the Data Sources page at maprise.jp) / Fujinomiya: the text of the city regulation is shown as published, after the city confirmed that this is acceptable / municipalities with a single school: whole municipality / Population: national Census 2005-2020 (actual counts, Statistics Bureau) and projected population 2025-2050 (estimates; 2020 Census counts scaled by the growth rate of the MLIT 500 m / 250 m projected-population mesh)

Junior High School Districts — Screen example (with legend and click popup)
Screen example (with legend and click popup) ・Click the image to open it full size

Public High School Districts

Partial coverageFree (partly paid plans)
Show details
  • Only prefectures whose board-of-education regulation appendix could be checked against a primary source (Ehime is withheld). Ibaraki, Nara and Miyazaki are shown in provisional grey. Boundaries are approximate; check the annual admissions guidelines for who may apply and for exceptions.

Free: the map display. District details shown on click need Starter or above.

Overview

Attendance districts for prefectural public high schools (full-time general courses) in the 18 prefectures that still use a district system, shown in colours by district: Hokkaido, Iwate, Yamagata, Fukushima, Chiba, Nagano, Aichi, Mie, Kyoto, Hyogo, Okayama, Tokushima, Kagawa, Fukuoka, Nagasaki, Kumamoto, Kagoshima and Okinawa. Prefectures with no district system, where applicants may apply to any public high school in the prefecture wherever they live (Aomori, Miyagi, Akita, Tochigi, Gunma, Saitama, Niigata, Toyama, Ishikawa, Fukui, Shizuoka, Osaka, Hiroshima, Yamaguchi, Saga, Shimane, Tokyo, Kanagawa, Yamanashi, Shiga, Wakayama, Tottori, Kochi, Gifu and Oita), are shown in grey over the whole prefecture. For Ibaraki, Nara and Miyazaki, we confirmed only that the guidelines set no restriction by area within the prefecture, so the grey is provisional. Ehime is withheld because the appendix of its regulation could not be checked against a primary source. Nagano has four districts, but its regulation lets applicants apply to schools in other districts for the time being. Tokushima plans to open the whole prefecture from the FY2029 entrance exams. Drawn from the appendix of each prefectural board of education regulation (a set of municipalities); where a regulation designates districts by junior high school area (e.g. Fukuoka City, Kurume City), junior high school district boundaries are used. Click to see the district name, area, public high schools and notes (in Japanese). Boundaries are approximate. Always check the annual admissions guidelines for who may apply and for exceptions such as out-of-district quotas.

Data source

Appendix to the "Regulation on Attendance Districts of Prefectural High Schools" and the admissions guidelines of each prefectural board of education (checked Oct 2026) / Shapes: municipal shapes built from Statistics Bureau e-Stat 2020 Census small-area boundaries; junior high school districts (processed from MLIT National Land Numerical Information A32; Fukuoka City Open Data, CC BY 4.0) where districts are designated by school / Processed by Vulcanz LLC

Public High School Districts — Screen example (with legend and click popup)
Screen example (with legend and click popup) ・Click the image to open it full size

Airport Noise Abatement Areas (Reference, Approximate)

Limited regionsEstimateFree
Show details
  • Only the five airports of Fukuoka, Kagoshima, Miyazaki, Oita and Naha (Kumamoto and others are not included).
  • Traced from the figure published by the Civil Aviation Bureau and aligned to the map, so it may be off from the actual lines by tens of meters or more. Check the public-inspection maps based on the official notice for the exact extent.

Overview

For 5 airports in Kyushu and Okinawa (Fukuoka (Fukuoka Airport), Kagoshima (Kagoshima Airport), Miyazaki (Miyazaki Airport), Oita (Oita Airport) and Okinawa (Naha Airport)), shows the noise abatement areas under the Act on Prevention of Aircraft Noise Disturbance around Public Airfields (Class 1: Lden 62 dB or more, Class 2: 73 dB or more, Class 3: 76 dB or more) as a reference. The area lines drawn in the "noise monitoring station location map" (PDF) published by the Civil Aviation Bureau, MLIT, were traced onto this map; they may be off from the actual lines by tens of meters or more (estimated positional error about 40 m). The purple band is near the boundary (within about 120 m), where inside or outside cannot be told. Click for the area class, what this location means, and the source. Note: the exact extent of the areas is defined by the public-inspection maps based on the official notice (at each airport office and the Osaka Regional Civil Aviation Bureau). Please contact the authorities to confirm whether a place is inside an area, or for details such as soundproofing support programs. This cannot be used as grounds for transactions, contracts, explanations of important matters or applications for such programs. A place with no area drawn does not mean it is outside an area. Some areas, such as Class 3 areas, could not be read, and Kumamoto and other airports are not included. For Oita and Naha only part of the area line is drawn on the source map, so only the vicinity of the boundary line is shown.

Data source

Produced from the "noise monitoring station location map" by the Civil Aviation Bureau, MLIT (Public Data License v1.0). The original map was made from GSI Maps (Denshi Kokudo Web).

Airport Noise Abatement Areas (Reference, Approximate) — Screen example (with legend and click popup)
Screen example (with legend and click popup) ・Click the image to open it full size
Show details
  • Only the nine stations at the five airports of Fukuoka, Kagoshima, Miyazaki, Oita and Naha. Positions are approximate, read from the dots on the published figure.

Overview

Shows the positions of 9 noise monitoring stations at 5 airports in Kyushu and Okinawa and their latest annual Lden (calendar-year values, integers): Fukuoka (Fukuoka Airport), Kagoshima (Kagoshima Airport), Miyazaki (Miyazaki Airport), Oita (Oita Airport) and Okinawa (Naha Airport). Station positions are approximate, read from the dots on the published map. Lden is the day-evening-night equivalent sound level (a daily average weighted for evening and night). For the latest values and measurement details, see the publications of each airport office. Kumamoto and other airports are not included.

Data source

Produced from the "noise monitoring station location map" by the Civil Aviation Bureau, MLIT (Public Data License v1.0). The original map was made from GSI Maps (Denshi Kokudo Web).

Airport Noise Monitoring Stations (Annual Lden) — Screen example (with legend and click popup)
Screen example (with legend and click popup) ・Click the image to open it full size

Aircraft Overflight Frequency (Reference)

EstimateLimited regionsFree
Show details
  • Reference values compiled from flight tracks of 24 days collected by a volunteer ADS-B receiver network. Where coverage is weak the layer says "cannot be determined" or "at least" and this does not mean zero flights. Aircraft that do not transmit ADS-B are not included, and this shows neither noise levels nor noise abatement areas.
  • Sea cells within about 12 nautical miles of land (a rough guide to territorial waters) are also shown; areas farther offshore are not shown. A blank area does not mean that no aircraft pass there.

Overview

For each cell of about 500 m, shows how many aircraft per day pass nearby (within 1 km, slant distance). Reference values compiled from flight tracks collected by a volunteer ADS-B receiver network on 24 days (2 per month, Oct 2025 - Sep 2026). Click a cell for flights within 1 km and 2 km, flights directly overhead, low flights (under 1,000 m above ground), the share at night (22:00-07:00), a typical low passing height and the receiver coverage. Note: receiver coverage is weak in some areas and periods; values are averaged over the days the area was received. Areas with weak coverage (e.g. around Naha) are shown as "cannot be determined" or "at least", which does not mean zero flights. Aircraft that do not transmit ADS-B (small aircraft, some helicopters, military aircraft, etc.) are not included; near Self-Defense Force or US military airfields actual overflights may be higher. This does not show noise levels or the statutory aircraft noise zones. Heights are approximate, based on elevation data that includes buildings. Sea cells within about 12 nautical miles of land (a rough guide to territorial waters) are also shown; areas farther offshore are not shown. A blank area does not mean that no aircraft pass there.

Data source

Created from flight tracks by adsb.lol contributors (ODbL 1.0), Copernicus DEM (© DLR e.V. 2010-2014 and © Airbus Defence and Space GmbH 2014-2018 provided under COPERNICUS by the European Union and ESA) and EGM2008

Aircraft Overflight Frequency (Reference) — Screen example (with legend and click popup)
Screen example (with legend and click popup) ・Click the image to open it full size

Town Halls

Free
Show details

Overview

City/town/village halls and branch offices (all 47 prefectures nationwide, 6,180 records). Replaced from non-commercial KSJ P02 with KSJ P05 in 2026, expanded nationwide at the same time.

Data source

KSJ P05 (2022 baseline)

Town Halls — Screen example (with legend and click popup)
Screen example (with legend and click popup) ・Click the image to open it full size
Show details

Overview

Shinto shrines, Buddhist temples, and Christian churches nationwide (all 47 prefectures; about 92,500 as of Nov 2026). A name is recorded for about 86% of the locations (as of Nov 15, 2026). Fukuoka, Kumamoto, Hokkaido and Akita combine OpenStreetMap with each prefecture's religious-corporation roster (CC BY family license); Yamanashi uses a 2019 edition of the same roster (the current edition carries no license notice); the other 43 prefectures are OpenStreetMap only. Mosques (165 locations nationwide) were individually researched from an academic mosque list, the English Wikipedia, Arabic-language sources, and multiple community sources, as no government dataset exists. For understanding local religious and cultural context. This is reference information on area statistics and facility locations. It must not be used to screen people by nationality or religion in tenancy, sales, lending or similar decisions.

Data source

OpenStreetMap (ODbL 1.0) / Fukuoka, Kumamoto, Hokkaido, Akita & Yamanashi religious corporation rosters (CC BY family) / individual research (mosques) / Names supplemented by MAPRISE original research (Wikidata [CC0], Geospatial Information Authority of Japan, and the National Tax Agency Corporate Number Publication Site, processed by Vulcanz LLC)

Religious Facilities — Screen example (with legend and click popup)
Screen example (with legend and click popup) ・Click the image to open it full size

Cemeteries

Partial coverageFree
Show details
  • Shown as location markers; only a part (~14%) has a known name.

Overview

Cemetery locations nationwide (35,268 (35,260 from OpenStreetMap + 8 individually researched); as of Nov 2026). Shown as position markers; names exist for only a subset of locations (~15%). The current data does not distinguish operator type (municipal, private, or temple-affiliated). 11 sites where burial (not cremation) is permitted for Muslims (researched from Wikipedia's "Islamic cemeteries in Japan" and other sources) are shown with a distinct sky-blue marker with a gold outline. This is reference information on area statistics and facility locations. It must not be used to screen people by nationality or religion in tenancy, sales, lending or similar decisions.

Data source

OpenStreetMap (ODbL 1.0) / Muslim burial sites from Wikipedia + individual research / Names supplemented by MAPRISE original research (Geospatial Information Authority of Japan, Wikidata [CC0])

Cemeteries — Screen example (with legend and click popup)
Screen example (with legend and click popup) ・Click the image to open it full size

Railway Lines

Free
Show details

Overview

Nationwide railway lines (JR, private railways, subways, Shinkansen, etc.) shown as blue lines. Use it to evaluate station-proximity properties and commuting convenience. Closed lines are not included (see the "Railway Heritage (Closed Lines)" layer for those).

Data source

KSJ N02

Railway Lines — Screen example (with legend and click popup)
Screen example (with legend and click popup) ・Click the image to open it full size

Railway Stations

Free
Show details

Overview

Railway station locations shown as pink circles. Circle size follows the station passenger counts, so busier stations appear larger. Distance to a station is a basic indicator of commuting convenience and commercial location.

Data source

KSJ N02 / S12

Railway Stations — Screen example (with legend and click popup)
Screen example (with legend and click popup) ・Click the image to open it full size

Bus Stops

Free
Show details

Overview

Bus stop locations (all 47 prefectures, ~280,000 as of Nov 2026). For senior-friendly location and mobility access.

Data source

KSJ P11

Bus Stops — Screen example (with legend and click popup)
Screen example (with legend and click popup) ・Click the image to open it full size

Station Passenger Counts

Time-series dataFree (partly paid plans)
Show details

Switch between years 2011–2024 and see each station’s trend.You can also ask the AI chat about a specific past year or compare with the past (questions without a year use the latest data).

Free: the latest year (2024) only. Other years need Starter or above.

Overview

Daily boarding + alighting passengers per station, shown by circle size and color (blue to red). Larger circles mean more passengers, a guide to foot traffic and commercial potential around the station. Click a station to see its name and passenger counts by year; switch the year with the timeline at the bottom. Figures are published by operators; stations that operators do not disclose, or that a survey year does not cover, may not appear.

Data source

KSJ S12

Station Passenger Counts — Screen example (with legend and click popup)
Screen example (with legend and click popup) ・Click the image to open it full size

City Gas Service Area (Nationwide, by operator)

Limited regionsRelated to 重説Starter and above
Show details
  • Covers 189 operators and 1,898 municipalities nationwide, but the service areas of 6 operators could not be confirmed. A municipality-level overview, not supply availability by district.

Overview

Shows which city-gas (piped natural gas) utility serves each municipality, researched from each operator's published terms of service and service-area maps. Whether piped city gas is available directly affects the choice between city gas and propane for a detached house, and renovation cost estimates. Municipalities are shaded in three categories: service area present (colored by operator), unconfirmed (an operator exists), and no operator. Click for the operator name and contact details. Researched from public materials of 189 general gas pipeline operators nationwide (of 1,898 municipalities: 857 with a service area, 4 unconfirmed, 1,037 with no operator, as of Oct 2026). The service areas of 6 operators could not be confirmed, so "no operator" does not guarantee that city gas is unavailable. Warning: many operators limit supply to specific districts within a municipality — this layer is a municipal-level overview only. Confirm exact serviceability directly with the listed operator.

Data source

Each city-gas operator's published terms of service and service-area maps (Vulcanz LLC research, as of Oct 2026); municipal shapes processed from the National Land Numerical Information (administrative areas), used with the approval of the Director-General of GSI under the Survey Act (approval no. R 8JHs 474)

City Gas Service Area (Nationwide, by operator) — Screen example (with legend and click popup)
Screen example (with legend and click popup) ・Click the image to open it full size

Water Utility Provider (Beta)

Beta / early accessRelated to 重説Free
Show details
  • Trial release (beta). Covers all 47 prefectures, but shown as a municipality-level overview, not the actual water-supply area (where pipes reach).

Overview

Shows the water utility serving each municipality and its contact point (department, phone, fax, address), color-coded. Each water utility gets its own color: municipalities sharing a color are served by the same utility (e.g. a joint authority), and wide-area utilities are drawn slightly darker (grey dashed = municipalities where the utility is not yet identified). For water-service start procedures when moving or building, and for identifying areas without public water supply (wells, simplified water systems, etc.). Click for the operator name, contact, and last-verified date. Warning: this beta trial covers all 47 prefectures, and the displayed area is a municipal-level administrative overview, not the actual water-service area (where pipes reach). Confirm serviceability and connection work directly with the listed operator.

Data source

Each water utility's published materials (Vulcanz LLC research; contact details updated on an ongoing basis); municipal shapes processed from the National Land Numerical Information (administrative areas), used with the approval of the Director-General of GSI under the Survey Act (approval no. R 8JHs 474)

Water Utility Provider (Beta) — Screen example (with legend and click popup)
Screen example (with legend and click popup) ・Click the image to open it full size

AED Locations

Limited regionsFree
Show details
  • Only 141 local governments in 22 prefectures (~17,600 units): open data published by local governments whose terms of use could be confirmed, not a nationwide inventory. No marker does not mean there is no AED.

Overview

AED defibrillator locations (~17,600 records across 141 local governments in 22 prefectures, as of Nov 2026). Covers only open data published by local governments whose terms of use could be confirmed, so it is not a nationwide inventory. For safety assessment of commercial/public facilities.

Data source

BODIK / Local govs

AED Locations — Screen example (with legend and click popup)
Screen example (with legend and click popup) ・Click the image to open it full size

Cultural Properties

Related to 重説Free
Show details

Overview

Nationally designated cultural properties. For tourism potential and landscape value.

Data source

Agency for Cultural Affairs

Cultural Properties — Screen example (with legend and click popup)
Screen example (with legend and click popup) ・Click the image to open it full size

PLATEAU Land Use (Reference)

Limited regionsFree
Show details
  • Limited to municipalities whose land use is recorded in PLATEAU (shown at zoom level 15 and above). The survey year differs by municipality and may differ from current land use. A place with no parcel drawn does not mean there is no land use.

Overview

Shows land-use parcels, colored by type, for the municipalities whose land use is recorded in PLATEAU (residential, commercial, industrial, public and civic facilities, roads, transport facilities, public open space, farmland, forest, water, other natural land, other urban land use, vacant or underused land, etc.). This is the land use model (LOD1) recorded in the Project PLATEAU 3D city models (MLIT), reference information based on the urban planning basic survey. The survey year differs by municipality, and the data may differ from the current land use. Shown at zoom level 15 and above. Click for the land-use type, designated building coverage and floor area ratio (where recorded) and the survey year. Limited to municipalities whose land use is recorded in PLATEAU; other municipalities are not covered. A place with no parcel drawn does not mean there is no land use. It cannot be used as a basis for important-matter explanations or contracts. Confirm the current land use and its urban-planning treatment with the municipal urban planning department.

Data source

Processed by Vulcanz LLC from the Project PLATEAU 3D city models (MLIT, PDL 1.0).

PLATEAU Land Use (Reference) — Screen example (with legend and click popup)
Screen example (with legend and click popup) ・Click the image to open it full size

Expressways (NLNI)

Free
Show details

Overview

Shows expressway routes nationwide as lines, colored by route type (national expressways, parallel motorways, motorways of national routes, designated-city expressways, etc.). Click for the route name, route type, service status (fully / provisionally in service, etc.) and number of lanes. Reference information based on the current status in the MLIT National Land Numerical Information "Expressway time-series data" 2025 edition (as of 31 Dec 2025); it does not show later openings or changes, traffic restrictions or conditions of use, and is not a basis for legal procedures. As official national data it carries the route type and service status, which is the difference from OSM Roads (OpenStreetMap). Information by year, such as the opening year, is not shown. IC/JCT points are shown by the "Expressway IC/JCT (NLNI)" layer.
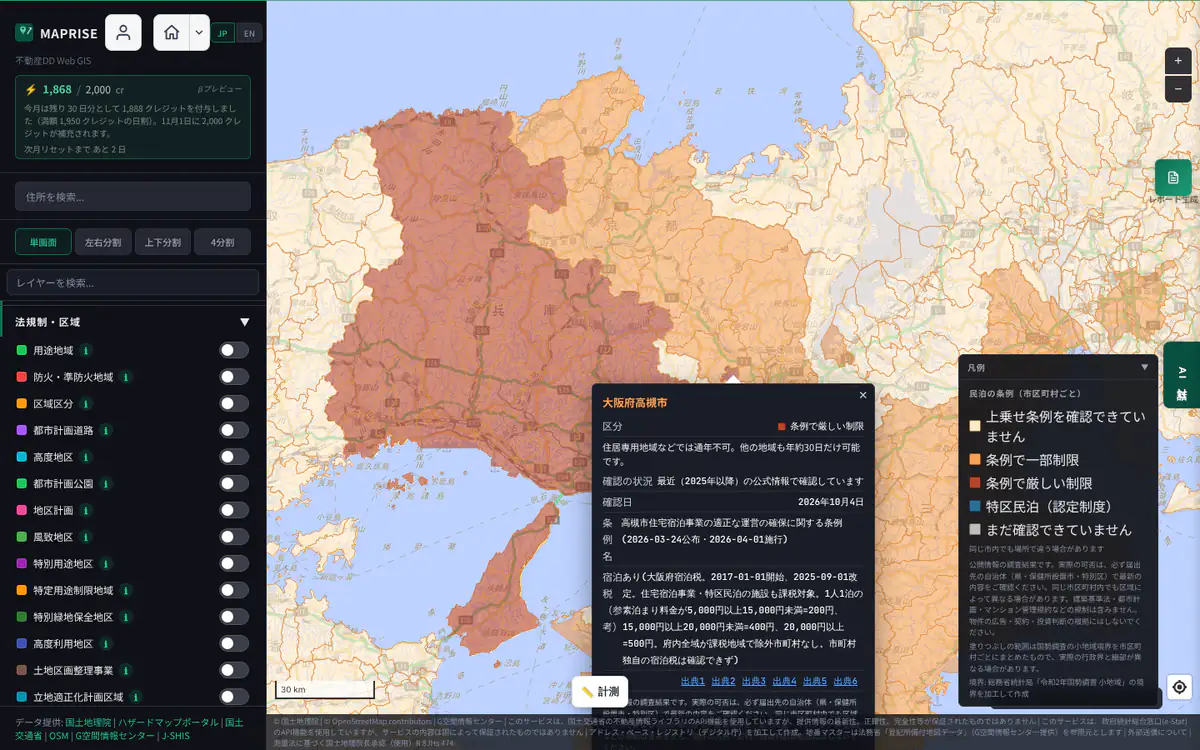
Data source

Processed by Vulcanz LLC from "National Land Numerical Information (Expressway time-series data)" (MLIT) (CC BY 4.0, used as current-status data).
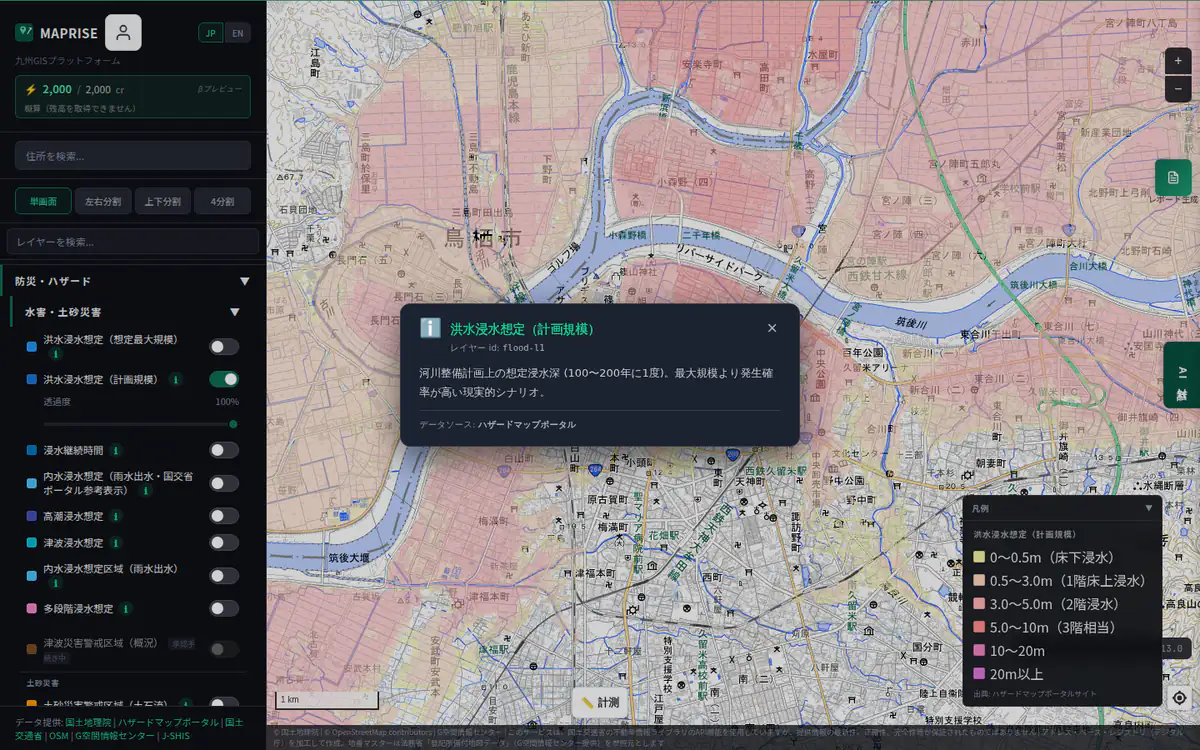
Expressways (NLNI) — Screen example (with legend and click popup)
Screen example (with legend and click popup) ・Click the image to open it full size
Show details

Overview

Shows expressway interchanges (IC), smart ICs and junctions (JCT) nationwide as points. Click for the name and type. Reference information based on the current status in the MLIT National Land Numerical Information "Expressway time-series data" 2025 edition (as of 31 Dec 2025); it does not show later openings or changes or conditions of use, and is not a basis for legal procedures. Information by year, such as the opening year, is not shown. Route lines are shown by the "Expressways (NLNI)" layer.
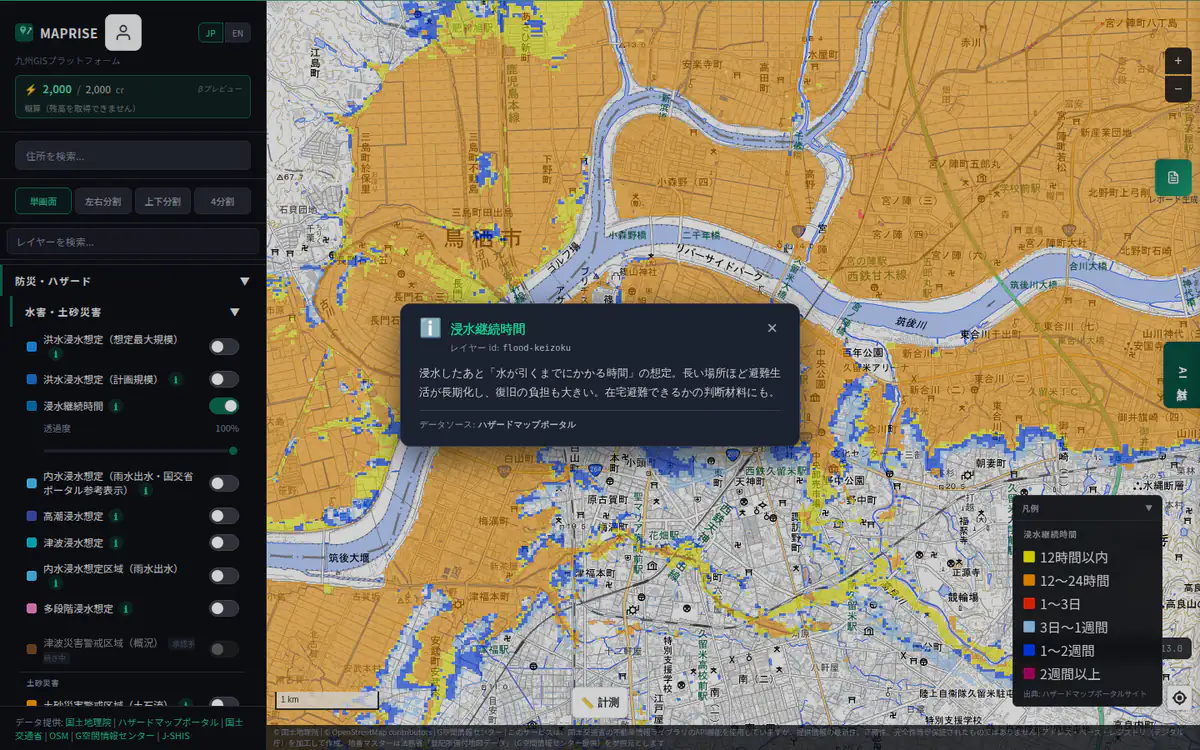
Data source

Processed by Vulcanz LLC from "National Land Numerical Information (Expressway time-series data)" (MLIT) (CC BY 4.0, used as current-status data).
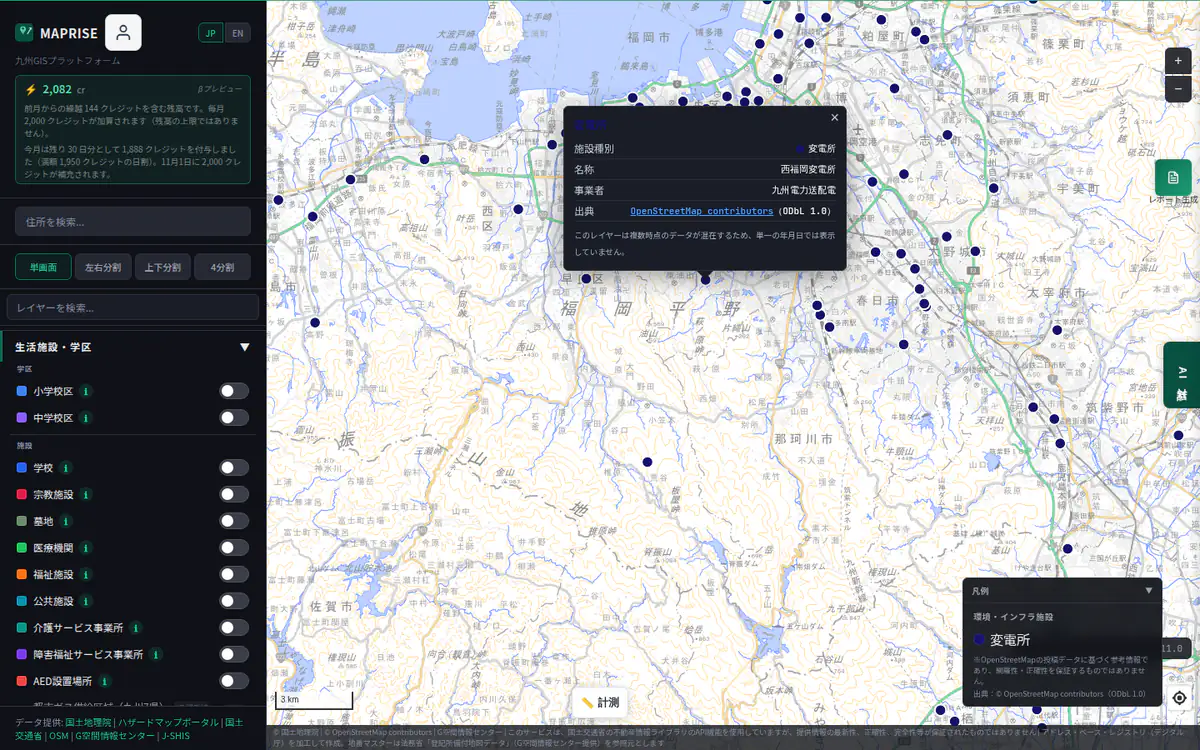
Expressway IC/JCT (NLNI) — Screen example (with legend and click popup)
Screen example (with legend and click popup) ・Click the image to open it full size
Show details

Overview

Shows road centerlines nationwide as lines, colored by road category (national routes, prefectural roads, municipal roads, national expressways, etc.). Shown from city-level zoom (not on wide views): national routes, expressways and prefectural roads first, and municipal roads as you zoom in further. Click for the road category, type (regular section, footpath, steps, etc.), road state (bridge / viaduct, tunnel, etc.), width class (approximate) and toll. Reference information based on the MLIT National Land Numerical Information "Road data" FY2024 edition (as of Sep 2024); horizontal accuracy is about 25 m (standard deviation). It does not show later new construction or changes, traffic restrictions or conditions of use. The width class is a rough classification and cannot be used to judge a road under the Building Standards Act or the frontage requirement (4 m width, etc.), to certify a route under the Road Act, or as a basis for legal procedures. A place with no line drawn does not mean there is no road. As official national data it carries road category, road state and toll attributes, which is the difference from OSM Roads (OpenStreetMap); OSM Roads remains available as a separate layer. The registration date in the data (when the feature was created in the Digital Japan Basic Map) is not the opening date of the road and is not shown. Expressway routes, ICs and JCTs are also available in the "Expressways (NLNI)" layers.
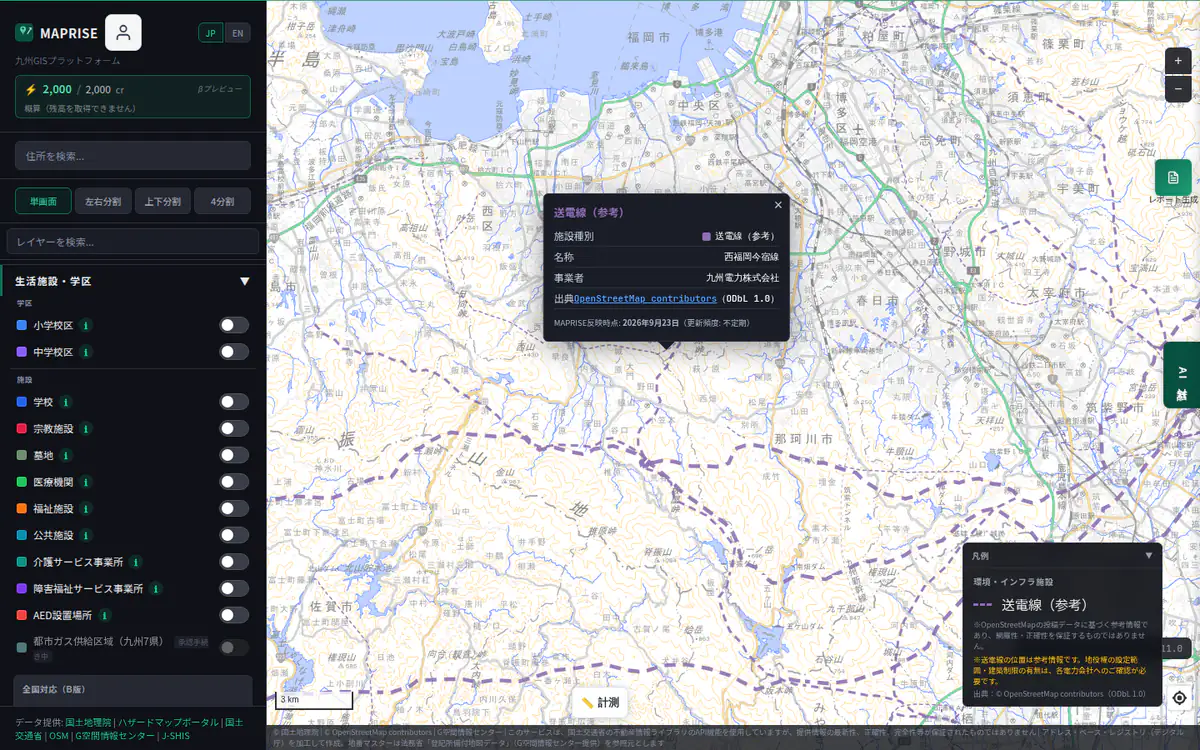
Data source

Processed by Vulcanz LLC from "National Land Numerical Information (Road data)" (MLIT) (CC BY 4.0). Original: Digital Japan Basic Map (Fundamental Geospatial Data), approved by the Director-General of the Geospatial Information Authority of Japan (Reproduction) R 6JHf503 under the Survey Act.

Road Centerlines (NLNI) — Screen example (with legend and click popup)
Screen example (with legend and click popup) ・Click the image to open it full size
↑ Back to top

Energy & environment1331210010 layers

Solar, wind, thermal and nuclear plants, substations and power lines — the energy-related facilities around a piece of land.

What this group tells you

  • Types and locations of nearby power plants (FIT-certified solar, wind, hydro, geothermal, biomass, thermal, nuclear)
  • Substations and power lines, relevant to grid connection and the surrounding environment
  • Solar-panel footprints estimated from satellite imagery (reference only)

Everyday problems it helps with

  • Developers / FundsBefore a power project or land acquisition, want substations, lines and existing plants in one view.
  • Real Estate BrokersWant to confirm, without omission, whether power facilities or substations sit nearby.
  • Banks (Lending)For solar-related deals, want to cross-check where the facilities are and what surrounds them.

Layers in this group

Show layer list

Vegetation index (greenness, summer avg)

Time-series dataFree
Show details

Switch between each year from 2004 to 2012 and the all-period average to compare how greenness changed.

Overview

Greenness (NDVI) from the GSI vegetation index data (250 m mesh, Terra MODIS), averaged over July–August (summer) of 2004–2012 and color-coded. It is an indication of greenness, not a forest classification map: farmland, parks and lawns also appear dense. The source data has not been updated since 2012, so it may differ from current vegetation, clearing or development. Useful for a rough check of the surroundings of forest or vacation land and for comparing greener and less green areas. Source: GSI vegetation index data (obtained through joint research by GSI and Tokai University), averaged and colored by MAPRISE

Data source

GSI vegetation index data (joint research by GSI and Tokai University)

Vegetation index (greenness, summer avg) — Screen example (with legend and click popup)
Screen example (with legend and click popup) ・Click the image to open it full size

Solar PV (FIT-certified)

Time-series dataFree (partly paid plans)
Show details

See the plants that existed at each certification year from 2012 to 2026.You can also ask the AI chat about a specific past year or compare with the past (questions without a year use the latest data).

Free: about 1/10 of the points, thinned across Japan. All points need Starter or above.

Overview

Locations, capacity, size class and certification year of FIT-certified solar facilities (METI; ~371,000 records, all 47 prefectures as of Nov 2026). For checking nearby mega-solar sites and neighborhood risks. Pale/hollow dots = approximate (municipal-level) locations.

Data source

METI FIT Certification Data

Solar PV (FIT-certified) — Screen example (with legend and click popup)
Screen example (with legend and click popup) ・Click the image to open it full size

Coverage Area (AI + Satellite)

EstimateStarter and above
Show details
  • Areas estimated by AI from GSI aerial imagery; they may differ from the actual location and size of facilities.

Overview

Mega-solar panel coverage detected by AI analysis of aerial/satellite imagery around known FIT sites. Reference estimate only — not a formal survey. Use as a guide to actual panel extent. Some shapes are site outlines from Global Renewables Watch etc., confirmed present with Sentinel-2 satellite imagery (2025–26); such sites may look like forest in older aerial photos. Detection results may differ from the latest actual conditions (installations, removals or expansions after the imagery date are not reflected). The outline shown may cover only part of a site, and the actual extent of the installation may be larger.

Data source

Input imagery: processed from GSI Tiles (Digital Japan Basic Map, Orthophoto) — Geospatial Information Authority of Japan / Detection: Vulcanz LLC AI estimate / Some site outlines: Global Renewables Watch (Microsoft, Planet, The Nature Conservancy; MIT License) and Kruitwagen et al. (2021) Nature (CC BY 4.0), confirmed present with Sentinel-2 (Copernicus)

Coverage Area (AI + Satellite) — Screen example (with legend and click popup)
Screen example (with legend and click popup) ・Click the image to open it full size

Panel Footprints (Ground/Roof)

EstimateFree (partly paid plans)
Show details
  • Outlines completed by AI are reference information, less accurate than hand-drawn ones.

Free: footprints from OpenStreetMap. Outlines completed by AI need Starter or above.

Overview

Solar panel footprints from OpenStreetMap merged with AI (SAM) contour completion. Green = ground-mounted, blue = building-related (estimated). Classification has accuracy limits.

Data source

OpenStreetMap + Vulcanz LLC AI

Panel Footprints (Ground/Roof) — Screen example (with legend and click popup)
Screen example (with legend and click popup) ・Click the image to open it full size

Substations

Pro and above
Show details

Overview

Substation locations based on OpenStreetMap contributor data. Coverage: 6,358 sites nationwide. All 47 prefectures are in scope and every prefecture has points. A name is recorded for 3,780 sites (59.5%). Completeness and accuracy are not guaranteed.

Data source

OpenStreetMap contributors (ODbL 1.0)

Substations — Screen example (with legend and click popup)
Screen example (with legend and click popup) ・Click the image to open it full size

Transmission Lines (Reference)

Pro and above
Show details

Overview

Transmission line locations based on OpenStreetMap contributor data. Line thickness represents voltage (kV). Coverage: 32,813 lines nationwide. All 47 prefectures are in scope and every prefecture has lines. Voltage is recorded for 28,429 lines (86.6%). Retrieved: 23 Sept 2026 (some records refreshed on 23 Oct 2026) via the Overpass API. Source: OpenStreetMap (ODbL 1.0). Completeness and accuracy are not guaranteed. Easement scope and building restrictions must be confirmed with the electric utility.

Data source

OpenStreetMap contributors (ODbL 1.0)

Transmission Lines (Reference) — Screen example (with legend and click popup)
Screen example (with legend and click popup) ・Click the image to open it full size

Wind Power Plants

Partial coverageEstimatePro and above
Show details
  • FIT/FIP-certified plants cover all 47 prefectures (a few whose address could not be located are not included). OpenStreetMap additions are also included.
  • Positions are estimated from addresses and may differ from the actual plant.

Overview

Locations of wind power plants. Two sources are combined; the popup shows which one each point came from. (1) Facilities certified under the FIT/FIP scheme (public data as of Aug 31, 2026; all 47 prefectures; a few facilities whose address could not be located are not included), positioned from registered addresses and therefore approximate. (2) OpenStreetMap contributor data (nationwide, about 11 sites, as of Sept 2026). FIT/FIP certifies renewable facilities, so large utility plants that predate the scheme are absent from (1); (2) fills that gap. Completeness and accuracy are not guaranteed. To avoid duplicates, points from (2) within 300 m of a point from (1) are not included.

Data source

Renewable Energy Electronic Application Site (https://www.fit-portal.go.jp/), processed by Vulcanz LLC / OpenStreetMap contributors (ODbL 1.0)

Wind Power Plants — Screen example (with legend and click popup)
Screen example (with legend and click popup) ・Click the image to open it full size

Hydro Power Plants

Partial coverageEstimatePro and above
Show details
  • FIT/FIP-certified plants cover all 47 prefectures (a few whose address could not be located are not included). OpenStreetMap additions are also included.
  • Positions are estimated from addresses and may differ from the actual plant.

Overview

Locations of hydroelectric power plants. Two sources are combined; the popup shows which one each point came from. (1) Facilities certified under the FIT/FIP scheme (public data as of Aug 31, 2026; all 47 prefectures; a few facilities whose address could not be located are not included), positioned from registered addresses and therefore approximate. (2) OpenStreetMap contributor data (nationwide, about 651 sites, as of Sept 2026). FIT/FIP certifies renewable facilities, so large utility plants that predate the scheme are absent from (1); (2) fills that gap. Completeness and accuracy are not guaranteed. To avoid duplicates, points from (2) within 300 m of a point from (1) are not included.

Data source

Renewable Energy Electronic Application Site (https://www.fit-portal.go.jp/), processed by Vulcanz LLC / OpenStreetMap contributors (ODbL 1.0) / MAPRISE original research (names added)

Hydro Power Plants — Screen example (with legend and click popup)
Screen example (with legend and click popup) ・Click the image to open it full size

Geothermal Power Plants

Partial coverageEstimatePro and above
Show details
  • FIT/FIP-certified plants cover all 47 prefectures (a few whose address could not be located are not included). OpenStreetMap additions are also included.
  • Positions are estimated from addresses and may differ from the actual plant.

Overview

Locations of geothermal power plants. Two sources are combined; the popup shows which one each point came from. (1) Facilities certified under the FIT/FIP scheme (public data as of Aug 31, 2026; all 47 prefectures; a few facilities whose address could not be located are not included), positioned from registered addresses and therefore approximate. (2) OpenStreetMap contributor data (nationwide, about 13 sites, as of Sept 2026). FIT/FIP certifies renewable facilities, so large utility plants that predate the scheme are absent from (1); (2) fills that gap. Completeness and accuracy are not guaranteed. To avoid duplicates, points from (2) within 300 m of a point from (1) are not included.

Data source

Renewable Energy Electronic Application Site (https://www.fit-portal.go.jp/), processed by Vulcanz LLC / OpenStreetMap contributors (ODbL 1.0)

Geothermal Power Plants — Screen example (with legend and click popup)
Screen example (with legend and click popup) ・Click the image to open it full size

Biomass Power Plants

Partial coverageEstimatePro and above
Show details
  • FIT/FIP-certified plants cover all 47 prefectures (a few whose address could not be located are not included). OpenStreetMap additions are also included.
  • Positions are estimated from addresses and may differ from the actual plant.

Overview

Locations of biomass power plants. Two sources are combined; the popup shows which one each point came from. (1) Facilities certified under the FIT/FIP scheme (public data as of Aug 31, 2026; all 47 prefectures; a few facilities whose address could not be located are not included), positioned from registered addresses and therefore approximate. (2) OpenStreetMap contributor data (nationwide, about 37 sites, as of Sept 2026). FIT/FIP certifies renewable facilities, so large utility plants that predate the scheme are absent from (1); (2) fills that gap. Completeness and accuracy are not guaranteed. To avoid duplicates, points from (2) within 300 m of a point from (1) are not included.

Data source

Renewable Energy Electronic Application Site (https://www.fit-portal.go.jp/), processed by Vulcanz LLC / OpenStreetMap contributors (ODbL 1.0)

Biomass Power Plants — Screen example (with legend and click popup)
Screen example (with legend and click popup) ・Click the image to open it full size

Thermal Power Plants

Pro and above
Show details

Overview

Locations of thermal power plants based on OpenStreetMap contributor data. Coverage: 198 sites nationwide. All 47 prefectures are in scope; prefectures with no thermal plant simply have no points. Fuels: coal 79, gas 77, oil 44, diesel 3 (co-fired plants are counted more than once); 142 sites state a generation capacity. Retrieved: 23 Sept 2026 via the Overpass API. Source: OpenStreetMap (ODbL 1.0). Completeness and accuracy are not guaranteed. Useful as a starting point for checking nearby air quality, noise and vibration, fuel transport routes and redevelopment plans. Click for the name, operator, fuel and generation capacity. Capacity is shown exactly as tagged (units are not converted); check the announcements published by each operator for the current operating status.

Data source

OpenStreetMap contributors (ODbL 1.0 / https://www.openstreetmap.org/copyright)

Thermal Power Plants — Screen example (with legend and click popup)
Screen example (with legend and click popup) ・Click the image to open it full size

Nuclear Power Plants

Pro and above
Show details

Overview

Locations of nuclear power plants based on OpenStreetMap contributor data. Coverage: 21 sites nationwide, all 47 prefectures in scope, including 3 that have ceased operation (former Fukushima Daiichi, Fugen, Monju); 17 sites state a generation capacity. Retrieved: 23 Sept 2026 via the Overpass API. Source: OpenStreetMap (ODbL 1.0). Completeness and accuracy are not guaranteed. Facilities that have ceased operation are included because they still physically exist, and the popup shows "Status: Decommissioned". Useful as a starting point for the approximate nuclear emergency planning zone (roughly a 30 km radius) and for finding where evacuation plans are published. Note: OpenStreetMap maps the whole Tokai site as a single plant named Tokai Power Station, so Tokai Daini is shown at its location but under that name. Confirm the exact zone boundaries and evacuation plans with the host prefecture and the Nuclear Regulation Authority.

Data source

OpenStreetMap contributors (ODbL 1.0 / https://www.openstreetmap.org/copyright) + MAPRISE original research (names added)

Nuclear Power Plants — Screen example (with legend and click popup)
Screen example (with legend and click popup) ・Click the image to open it full size

Crematoria

Pro and above
Show details

Overview

Crematorium locations based on OpenStreetMap contributor data. Coverage: 311 sites nationwide. All 47 prefectures are in scope. A name is recorded for 284 sites (91.3%), 23 of which were added by MAPRISE's own research. Completeness and accuracy are not guaranteed.

Data source

OpenStreetMap contributors (ODbL 1.0) + MAPRISE original research (names added)

Crematoria — Screen example (with legend and click popup)
Screen example (with legend and click popup) ・Click the image to open it full size
↑ Back to top

Prices & parcels15121515136 layers

Transaction prices, official land prices, appraisal reports, parcel numbers and road widths — the basics for judging value and extent.

What this group tells you

  • Level and trend of nearby transaction prices, contract prices and official land prices
  • Appraisal report details, national-property sales and the estimated width of the frontage road
  • Parcel boundaries as a guide, from registry maps (chiban) and farmland polygons

Everyday problems it helps with

  • Real Estate BrokersFinding and organising nearby transactions and land prices for valuations and explanations takes time.
  • Legal & Appraisal ProfessionalsAhead of an appraisal or survey, want public price data and parcel positions quickly in hand.
  • Banks (Lending)Want to test collateral valuations against nearby transactions and land prices.

Layers in this group

Show layer list

Official Land Prices

Time-series dataFree (partly paid plans)
Show details

Switch between years 2007–2026 to see past land prices.You can also ask the AI chat about a specific past year or compare with the past (questions without a year use the latest data).

Free: the latest 3 years. Starter and above: 10 years; Business and above: all years.

Overview

Annual benchmark land prices. Most standard indicator for collateral valuation and real estate. Zoomed out, it shows medians by prefecture, municipality or mesh (~10 km / ~1 km); zoomed in, individual points (use class, aggregation and JPY/tsubo are selectable). Medians are of appraisal points, not transaction prices.

Data source

KSJ L01/L02

Official Land Prices — Screen example (with legend and click popup)
Screen example (with legend and click popup) ・Click the image to open it full size

Land Price Change Rate

Time-series dataFree (partly paid plans)
Show details

Switch between years from 2008 to see past land price change rates.

Free: the latest 3 years. Starter and above: 10 years; Business and above: all years.

Overview

Visualizes price change rate between two years. Rising (green) / falling (red).

Data source

Processed by Vulcanz LLC from KSJ L01 (Land Price Publication; change rate calculated from two survey years)

Land Price Change Rate — Screen example (with legend and click popup)
Screen example (with legend and click popup) ・Click the image to open it full size

Real Estate: Condos

Time-series dataFree (partly paid plans)
Show details

Switch between years from 2006 to see past transaction prices.You can also ask the AI chat about a specific past year or compare with the past (questions without a year use the latest data).

Free: price-band colouring only. Transaction details and year switching need Starter or above.

Overview

Actual transaction prices for used condos (2005Q3-, quarterly updates) from MLIT.

Data source

Real Estate Library XIT001

Real Estate: Condos — Screen example (with legend and click popup)
Screen example (with legend and click popup) ・Click the image to open it full size

Real Estate: Land + Building

Time-series dataFree (partly paid plans)
Show details

Switch between years from 2006 to see past transaction prices.You can also ask the AI chat about a specific past year or compare with the past (questions without a year use the latest data).

Free: price-band colouring only. Transaction details and year switching need Starter or above.

Overview

Land+building transaction prices. For tracking detached house market trends.

Data source

Real Estate Library XIT001

Real Estate: Land + Building — Screen example (with legend and click popup)
Screen example (with legend and click popup) ・Click the image to open it full size

Real Estate: Land Only

Time-series dataFree (partly paid plans)
Show details

Switch between years from 2006 to see past transaction prices.You can also ask the AI chat about a specific past year or compare with the past (questions without a year use the latest data).

Free: price-band colouring only. Transaction details and year switching need Starter or above.

Overview

Land-only transaction prices. For builder land acquisition and new construction site evaluation.

Data source

Real Estate Library XIT001

Real Estate: Land Only — Screen example (with legend and click popup)
Screen example (with legend and click popup) ・Click the image to open it full size

Real Estate: Farmland/Forest

Time-series dataFree (partly paid plans)
Show details

Switch between years from 2006 to see past transaction prices.You can also ask the AI chat about a specific past year or compare with the past (questions without a year use the latest data).

Free: price-band colouring only. Transaction details and year switching need Starter or above.

Overview

Farmland/forest transaction prices. For conversion projects and forestry decisions.

Data source

Real Estate Library XIT001

Real Estate: Farmland/Forest — Screen example (with legend and click popup)
Screen example (with legend and click popup) ・Click the image to open it full size

Appraisal Reports (XCT001)

Beta / early accessTime-series dataPro and above
Show details

Switch between years 2022–2026 to see past appraisal reports.You can also ask the AI chat about a specific past year or compare with the past (questions without a year use the latest data).

  • Map display is early access. AI integration and PDF output are planned for Phase 2.

Overview

Official real-estate appraisal reports behind land-price publications (MLIT Real Estate Information Library), visualized per point. 258,214 points across all 47 prefectures over 5 years (as of Aug 2026). Each point holds results from licensed appraisers: three-method valuations (comparison / income / cost) plus values from two appraisers. For collateral valuation and loan screening (banks), land acquisition and due diligence (realtors / homebuilders), and multi-faceted price verification (market indicator vs. expert appraisal). *Reference information; a licensed real-estate appraiser is required for official valuation.*

Data source

Real Estate Library XCT001

Appraisal Reports (XCT001) — Screen example (with legend and click popup)
Screen example (with legend and click popup) ・Click the image to open it full size

National Property for Sale (MOF)

Free (partly paid plans)
Show details

Free: the 7 Kyushu prefectures only. Nationwide properties need Starter or above.

Overview

Shows 1,891 of 3,471 nationwide unused national property listings published by the Ministry of Finance (2,966 as of the end of FY2023/Reiwa 5, plus additional listings published by the Local Finance Bureaus) whose locations could be identified from the published addresses. 1,580 properties whose locations cannot be identified are not shown. Price fields are accounting book values for reference only, not actual sale prices. Listing does not mean the property is currently available for application. Note: the Free plan (including signed-out users) shows properties in the 7 Kyushu prefectures only; Starter and above show properties nationwide.

Data source

Processed by Vulcanz LLC from MOF "National Property Individual Information" (locations derived from the published addresses)

National Property for Sale (MOF) — Screen example (with legend and click popup)
Screen example (with legend and click popup) ・Click the image to open it full size

Kitakyushu Unused Land

Limited regionsStarter and above
Show details
  • Kitakyushu City-owned unused land only (425 sites).

Overview

Unused municipal land in Kitakyushu (425). Ready development candidate.

Data source

BODIK

Kitakyushu Unused Land — Screen example (with legend and click popup)
Screen example (with legend and click popup) ・Click the image to open it full size

Cadastral Maps (Parcel Numbers)

Partial coverageRelated to 重説Free (partly paid plans)
Show details
  • Coverage differs by municipality and keeps expanding.

Free: the area within about 10 km of each prefectural capital only. Full coverage needs Starter or above.

Overview

Cadastral maps from Legal Affairs Bureau. View parcel numbers and shapes. Not a certificate. Parcel numbers change over time via subdivision/merger and may not match the current registry.

Data source

G-Spatial / MoJ

Cadastral Maps (Parcel Numbers) — Screen example (with legend and click popup)
Screen example (with legend and click popup) ・Click the image to open it full size

Farmland Parcels

Partial coverageRelated to 重説Free (partly paid plans)
Show details
  • Coverage differs by municipality and keeps expanding.

Free: the area within about 10 km of each prefectural capital only. Full coverage needs Starter or above.

Overview

Farmland parcel boundaries (~27.12M records across 46 prefectures as of Sept 2026; Okinawa not yet ingested) from MAFF. Foundation for ownership and conversion decisions.

Data source

MAFF

Farmland Parcels — Screen example (with legend and click popup)
Screen example (with legend and click popup) ・Click the image to open it full size

Kumamoto Parcel Reference

Limited regionsRelated to 重説Free
Show details
  • Kumamoto City parcel reference map only.

Overview

Parcel reference map for Kumamoto only (~702,120). For parcel-based land research.

Data source

BODIK

Kumamoto Parcel Reference — Screen example (with legend and click popup)
Screen example (with legend and click popup) ・Click the image to open it full size

Road Width (Estimated)

Limited regionsEstimateRelated to 重説Starter and above
Show details
  • Road-size classes (wide / standard / narrow) are shown for 5 cities only: Kitakyushu, Fukuoka, Kurume, Sasebo and Kumamoto.
  • Width is a statistical estimate from nearby transactions, not a measurement of the clicked road.

Overview

With this layer ON, click the target road to see a statistical estimate (median, distribution and confidence: high/medium/low) of frontage road width, derived from nearby transaction and appraisal records. It also shows a road-scale category (wide / standard / narrow) based on building data, for 5 cities: Kitakyushu, Fukuoka, Kurume, Sasebo and Kumamoto (a category, not a width figure). Neither value is a direct measurement of the clicked road itself — both are statistical estimates from surrounding data. Confirm the official width, road classification, and any setback requirement with the local building authority or road administrator.

Data source

Processed by Vulcanz LLC from the MLIT Real Estate Information Library (transaction prices / land appraisal reports; statistically estimated from nearby records)

Road Width (Estimated) — Screen example (with legend and click popup)
Screen example (with legend and click popup) ・Click the image to open it full size

Housing Starts Statistics

Time-series dataFree (partly paid plans)
Show details

View housing starts year by year (2019–2025) or all years together (the 2019 figures were reloaded and corrected in November 2026, and now cover municipalities and wards nationwide).You can also ask the AI chat about a specific past year or compare with the past (questions without a year use the latest data).

Free: the year 2025 only. Other years need Starter or above.

Overview

Housing starts by municipality (2019-2025). Essential for builders market sizing.

Data source

e-Stat Housing Starts

Housing Starts Statistics — Screen example (with legend and click popup)
Screen example (with legend and click popup) ・Click the image to open it full size

Non-residential Building Starts (by use)

Time-series dataStarter and above
Show details

Switch between years 2020–2025 to see non-residential construction starts (the latest year, 2025, is shown first).

Overview

Non-residential building starts by municipality and use (floor area and year-on-year change), nationwide, 2020-2025 (switch years with the buttons; the latest year, 2025, is shown first). Shows floor area started for manufacturing, transport (logistics), wholesale/retail, lodging/food service, medical/welfare, education and more. Non-residential = total starts excluding exclusive dwellings, quasi-dwellings and mixed residential-commercial buildings. Small municipalities have few buildings, so year-on-year figures can swing widely. For reference only; not a basis for legal procedures.

Data source

Source: e-Stat Building Starts Survey (MLIT), table 7-2, processed by Vulcanz LLC (Government Standard Terms of Use v2.0). This service uses the API function of e-Stat, but the content of the service is not guaranteed by the government.

Non-residential Building Starts (by use) — Screen example (with legend and click popup)
Screen example (with legend and click popup) ・Click the image to open it full size

Isochrone map (area reachable on foot or by car)

Pro plan or above

Click a point on the map to colour the area reachable from it on foot or by car within a set time. Use it to compare how close a station, supermarket or school is in travel time rather than straight-line distance.

How to use

  1. Switch on "Isochrone Map" in the sidebar and click a start point on the map.
  2. Switch the time (5, 10, 15, 20 or 30 minutes) and the mode (walking or car) in the popup.
  3. Press "Clear" to remove it and pick another point.
Isochrone map example (area reachable within 20 minutes on foot around Hakata Station)
Example: the area reachable within 20 minutes on foot from a start point around Hakata Station (actual production screen)

Please note

  • This is a reference estimate based on actual road-network data. The real reachable area may differ because of traffic, signals and similar conditions.
  • Available on the Pro plan or above. See the pricing page for plan differences.

Source: Isochrone estimate from road-network data

↑ Back to top

Land history734472 layers

Meiji-era land use, old topographic maps and Showa-era land use — how the land has been used in the past.

What this group tells you

  • Whether the land used to be paddy, wetland or ponds
  • How the area developed, seen through pre-war topographic maps and the spread of housing
  • Locations of natural-disaster monuments that record past events

Everyday problems it helps with

Layers in this group

Show layer list

Land Use (Meiji Era)

Starter and above
Show details

Overview

Land use during Meiji era. Discover original land purpose. Useful for assessing ground conditions.

Data source

MLIT National Land Survey (Land Classification Survey / Water Survey) / National Land Information Web Mapping System (MLIT) (https://nlftp.mlit.go.jp/kokjo/inspect/inspect.html)

Land Use (Meiji Era) — Screen example (with legend and click popup)
Screen example (with legend and click popup) ・Click the image to open it full size

Land Use (Showa Era)

Starter and above
Show details

Overview

Land use during Showa era. Track changes from pre-war to post-war.

Data source

MLIT National Land Survey (Land Classification Survey / Water Survey) / National Land Information Web Mapping System (MLIT) (https://nlftp.mlit.go.jp/kokjo/inspect/inspect.html)

Land Use (Showa Era) — Screen example (with legend and click popup)
Screen example (with legend and click popup) ・Click the image to open it full size

Land Use Trends

Starter and above
Show details

Overview

Land use by purpose (residential/commercial/industrial/agricultural). Major metro areas only, detailed at z≥14.

Data source

GSI Japan

Land Use Trends — Screen example (with legend and click popup)
Screen example (with legend and click popup) ・Click the image to open it full size

Old Topographic Maps (Pre-war Showa 1:50k)

Partial coverageStarter and above
Show details
  • Covers major areas nationwide, but some major cities such as Sendai, Kyoto and Osaka are not yet in the source collection.

Overview

Pre-war topographic maps by the former Imperial Japanese Land Survey, digitized and released by Stanford University Libraries (public domain). For historical research and building location verification. Covers major regions nationwide from Hokkaido to Kyushu, as of Sept 2026. Note: coverage depends on the source collection; sheets not yet digitized by Stanford are not shown. Some major cities including Sendai, Kyoto, and Osaka are not yet included (to be added as the source becomes available). As pre-war historical material, it does not match present-day terrain, boundaries, or buildings.

Data source

Stanford University Libraries (Public Domain)

Old Topographic Maps (Pre-war Showa 1:50k) — Screen example (with legend and click popup)
Screen example (with legend and click popup) ・Click the image to open it full size

Meiji-era Wetlands

Starter and above
Show details

Overview

Areas that were wetlands, paddies or riverbeds in the Meiji era. Former wetlands tend to have soft ground prone to liquefaction. Major plains only.

Data source

GSI Japan

Meiji-era Wetlands — Screen example (with legend and click popup)
Screen example (with legend and click popup) ・Click the image to open it full size
Show details

Overview

Locations of stone monuments erected to pass on the damage caused by past tsunamis, floods, landslides and volcanic disasters. Their inscriptions record what happened and the lessons learned, letting you compare the projected risk shown by hazard layers against what actually occurred on that land. Most effective when combined with the flood-inundation or landslide-warning layers. Click a point to see the monument name, disaster name, disaster type and year erected, together with the full text of the inscription summary. Point colour follows the disaster type (the first type listed when a monument records several). Note: listings are based on applications from each municipality and do not cover every surviving monument; icon positions are approximate and are not survey results, so they must not be relied on for pinpoint accuracy.

Data source

Created from "Natural Disaster Monument Data" (Geospatial Information Authority of Japan)

Natural Disaster Monuments — Screen example (with legend and click popup)
Screen example (with legend and click popup) ・Click the image to open it full size

Railway Heritage (Closed Lines)

Partial coverageTime-series dataFree
Show details

Move the year from 1870 to 2026 to follow which sections were running or closed.You can also ask the AI chat about a specific past year or compare with the past (questions without a year use the latest data).

  • Alignments are traced by OpenStreetMap contributors, positional accuracy varies by area, and closed lines that were never mapped are not shown. Opening and closing years include estimates (years are known for about 60 percent of segments).

Overview

Shows former railway routes across Japan (about 6,000 segments, roughly 4,600 km) and about 2,900 former stations, over time. Move the year on the timeline row Former railways to see segments running in that year (orange), sections already closed (grey) and sections whose years are unknown (light grey), and follow waves of closures such as the 1980s national railway restructuring. Former stations are purple dots, a different color from the existing station layer (pink). Switch the base map to the 1974 aerial photography to overlay the routes on imagery that still shows the tracks in service. Click a segment for its name, operator, opening and closing years and status. Note: alignments are traced by OpenStreetMap contributors, positional accuracy varies by area, and closed lines that were never mapped are not shown. Opening and closing years come from OpenStreetMap date tags or are estimated from the years of nearby former stations (Wikidata); estimated segments are marked when clicked (years are known for about 60 percent of segments). Some former stations may be stations that only had a closing date recorded because of a rename or relocation.

Data source

(c) OpenStreetMap contributors (ODbL 1.0) and Wikidata (CC0), processed by Vulcanz LLC

Railway Heritage (Closed Lines) — Screen example (with legend and click popup)
Screen example (with legend and click popup) ・Click the image to open it full size
↑ Back to top

Forecasts & statistics818608 layers

Population forecasts, census, economic census and fiscal indices — statistics for judging an area's outlook and demand.

What this group tells you

  • Population outlook towards 2050 (250 m / 500 m meshes)
  • Population and household makeup by small area, and the concentration of businesses and workers
  • Municipal fiscal strength, housing-starts trends and the distribution of foreign residents

Everyday problems it helps with

  • Developers / FundsNeed population-outlook evidence to explain future demand for a site internally.
  • Local GovernmentWant to assemble planning and public-facility material from population and industry data quickly.
  • Banks (Lending)For long-term loans, want to check the future population trend of the collateral area.

Layers in this group

Show layer list

Population Forecast 500m (2050)

Time-series dataFree (partly paid plans)
Show details

Switch between projection years 2025–2070 (future projections).You can also ask the AI chat about a specific past year or compare with the past (questions without a year use the latest data).

Free: the 500 m mesh for 2050 only. The 250 m mesh and year switching need Starter or above.

Overview

2050 population forecast (500m mesh). Essential for "what will this land be in 30 years". Coverage: all 47 prefectures.

Data source

KSJ Future Population Forecast (R6 / H30)

Population Forecast 500m (2050) — Screen example (with legend and click popup)
Screen example (with legend and click popup) ・Click the image to open it full size

Population Forecast 250m (2050)

Time-series dataStarter and above
Show details

Switch between projection years 2025–2070 (future projections).You can also ask the AI chat about a specific past year or compare with the past (questions without a year use the latest data).

Overview

Finer 250m mesh forecast. For detailed catchment analysis. Coverage: Fukuoka Prefecture only (all 72 municipalities). Nothing is drawn outside Fukuoka — the data is not held there; it does not mean no forecast exists. Use the 500m mesh (nationwide) elsewhere.

Data source

KSJ Future Population Forecast (R6)

Population Forecast 250m (2050) — Screen example (with legend and click popup)
Screen example (with legend and click popup) ・Click the image to open it full size

Census Small Area Statistics

Free (partly paid plans)
Show details

Free: the area within about 10 km of each prefectural capital only. Full coverage needs Starter or above.

Overview

Population by cho-chome (age distribution, household types). For detailed demographic analysis.

Data source

e-Stat Census 2020

Census Small Area Statistics — Screen example (with legend and click popup)
Screen example (with legend and click popup) ・Click the image to open it full size
Show details

Overview

Establishment/employee count by 500m mesh. Critical for commercial location.

Data source

e-Stat Census 2021

Economic Census 500m — Screen example (with legend and click popup)
Screen example (with legend and click popup) ・Click the image to open it full size
Show details

Overview

Municipal fiscal strength (revenue/demand). ≥1.0 = wealthy municipality with infrastructure investment.

Data source

MIC; municipal shapes processed from the National Land Numerical Information (administrative areas), used with the approval of the Director-General of GSI under the Survey Act (approval no. R 8JHs 474)

Fiscal Strength Index — Screen example (with legend and click popup)
Screen example (with legend and click popup) ・Click the image to open it full size

Public Assistance Rate (by area)

Partial coverageTime-series dataStarter and above
Show details

Switch between FY2023 and FY2024 with the year buttons to compare the public assistance rate.

  • In most areas values are per prefecture (excluding designated and core cities), designated city or core city, not per municipality. Municipal figures published by 24 prefectures are shown individually (41 prefectures in total with those below). For Aichi, Gifu, Mie, Miyazaki, Shiga and the cities of Tochigi, where the prefecture does not publish a rate, we calculate the rate ourselves by dividing the number of recipients the prefecture publishes by the 2020 census population, and show it for cities only (not an officially published figure). For Yamagata, Ishikawa, Toyama, Yamaguchi, Ehime, Okayama, Hiroshima, Kagawa, Shizuoka, Nagano, Kagoshima and Okinawa, only municipalities confirmed in materials published by the prefecture or city are shown individually (for cities that publish only the number of recipients, we calculate the rate in the same way; these are not published figures). Others will be added as published data are confirmed. Definitions and reference dates differ by prefecture, so strict cross-prefecture comparison is not advised.
  • The share of households headed by a foreign national is not published per municipality, so it is shown only per prefecture (excluding designated and core cities), designated city or core city, for FY2023 and FY2024. It is based on the nationality of the head of household, not of each recipient (household members nationality is not recorded).

Overview

Shows the public assistance rate (recipients as a share of population; e.g. 4.62% means about 4.6 per 100 people) as a color-coded map. The Ministry of Health, Labour and Welfare publishes this survey only for prefectures, designated cities and core cities, so in most areas values are not per municipality: they are per prefecture (excluding designated and core cities), designated city, or core city. Where the prefecture itself publishes municipal figures (Hokkaido, Aomori, Iwate, Miyagi, Akita, Fukushima, Ibaraki, Tochigi, Tokyo, Kanagawa, Saitama, Chiba, Gunma, Niigata, Kyoto, Hyogo, Wakayama, Shimane, Kochi, Fukuoka, Saga, Nagasaki, Kumamoto and Oita), those municipalities are shown individually (cities only, or cities and towns, depending on what is published). For Yamagata, Ishikawa, Toyama, Yamaguchi, Ehime, Okayama, Hiroshima, Kagawa, Shizuoka, Nagano, Kagoshima and Okinawa, only the municipalities confirmed in figures published by the prefecture or the city are shown individually. For Aichi, Gifu, Mie, Miyazaki, Shiga and the cities of Tochigi, which do not publish the rate, the rate shown for cities is calculated by us from the prefecture-published number of recipients (fiscal-year monthly average) divided by the 2020 census population; it is not an official figure. For some cities in Hiroshima, Kagawa, Shizuoka, Nagano, Ishikawa, Toyama and Kagoshima, whose own materials publish only the number of recipients, the rate is calculated by us in the same way (not an official figure). Definitions and reference dates differ by prefecture, so strict cross-prefecture comparison is not advised. Other prefectures will be added as their published data are confirmed. Towns and villages without municipal figures are colored with the value of their whole prefecture (excluding designated and core cities), with no borders drawn between municipalities that share a value. Click an area to see the rate, households and recipients (monthly averages) and the share of households headed by a foreign national (area level only, as it is not published by municipality), for FY2023 and FY2024. The foreign-national share is based on the nationality of the head of household only, not of each recipient (household members nationality is not recorded). Rates reflect local factors such as aging and industry and do not rank areas.

Data source

Ministry of Health, Labour and Welfare, Survey on Public Assistance Recipients (monthly), FY2023-2024 (e-Stat; Government of Japan Standard Terms of Use v2.0) / Municipal figures: public assistance statistics published by each prefecture (and, for some municipalities, by the city) / Boundaries: Statistics Bureau of Japan, 2020 Census small-area boundaries aggregated by municipality (e-Stat) / Processed by Vulcanz LLC

Public Assistance Rate (by area) — Screen example (with legend and click popup)
Screen example (with legend and click popup) ・Click the image to open it full size

Foreign Population Heatmap

EstimateTime-series dataFree
Show details

Switch between years 2013–2026 or play them to see the trend.You can also ask the AI chat about a specific past year or compare with the past (questions without a year use the latest data).

  • Measured values, apportioned estimates and provisional estimates are mixed by area (the legend stars show accuracy).

Overview

Foreign residents and their share by municipality nationwide, from the Basic Resident Register (every year 2013-2026, as of Jan 1; 2013 as of Mar 31). Nagoya (school districts), Chiba, Hiroshima, Koto, Sumida and Adachi are shown by town / school district when zoomed in (each city's open data; years vary by city). 4 display modes. Switch or play years in the Foreign Population row of the bottom timeline; click a place to see its trend. In 2020, Fukuoka City school districts (census, city tabulation) are also shown. Municipal shapes are built from census small-area boundaries. Hamamatsu is shown city-wide because its wards were reorganized in 2024. This is reference information on area statistics and facility locations. It must not be used to screen people by nationality or religion in tenancy, sales, lending or similar decisions.

Data source

MIC, Population based on the Basic Resident Register / resident registers of Nagoya, Chiba, Koto, Sumida, Adachi (CC BY 4.0) and Hiroshima (CC BY 2.1 JP) / e-Stat census small-area boundaries / Fukuoka City, 2020 Population Census: Basic Complete Tabulation (by school district)

Foreign Population Heatmap — Screen example (with legend and click popup)
Screen example (with legend and click popup) ・Click the image to open it full size

Vacant Housing Rate (by municipality)

EstimateStarter and above
Show details
  • These are estimates from the Housing and Land Survey (a sample survey every five years), so the margin of error grows for smaller municipalities. Towns and villages whose municipal results are not published (about 680) are shown in gray (no data); clicking shows the prefecture-wide value for reference (not that municipality’s value). Available on the Starter plan and above.

Overview

Shows the share of vacant dwellings in the total housing stock (the vacancy rate) for each municipality as a color-coded map. Zoomed out (below zoom 7) it is shown by prefecture, and zoomed in by municipality. Click a municipality to see the number of vacant and total dwellings and a breakdown of vacant dwellings (for rent, for sale, second homes, other). Based on the 2023 Housing and Land Survey (as of 1 October 2023) by the Statistics Bureau of Japan, a sample survey conducted every five years; the national vacancy rate is 13.8%. Because these are sample-survey estimates, smaller municipalities have larger errors. Municipalities for which no municipality-level result was published (about 680 towns and villages) are shown in grey (no data); clicking one shows the prefecture-wide figure for reference (not the value of that municipality). Designated cities are shown by ward. Published dwelling counts are rounded, so the breakdown may not add up to the number of vacant dwellings. The vacancy rate is calculated by us as vacant dwellings divided by total dwellings. It does not show the location of individual vacant houses. For reference only; not a basis for legal procedures, valuation or transactions.

Data source

Statistics Bureau of Japan, 2023 Housing and Land Survey, Basic Tabulation on Housing and Households (e-Stat; Government of Japan Standard Terms of Use v2.0) / Boundaries: Statistics Bureau of Japan, 2020 Census small-area boundaries aggregated by municipality (e-Stat) / Processed by Vulcanz LLC

Vacant Housing Rate (by municipality) — Screen example (with legend and click popup)
Screen example (with legend and click popup) ・Click the image to open it full size
↑ Back to top

Safety, accidents & 3D444414 layers

Crime incidents, traffic accidents and PLATEAU 3D buildings (including shadow checks) for surroundings and building context.

What this group tells you

  • Trends in nearby crimes and traffic accidents
  • Use, height, seismic standard (year built) and structure of surrounding buildings from PLATEAU 3D models (nationwide), and how shadows fall

Everyday problems it helps with

  • Real Estate BrokersCannot answer questions about local safety and traffic accidents on the spot.
  • Developers / FundsWant to see early on how a planned building's shadow relates to its neighbours.
  • Local GovernmentWant to study safety measures for school routes and intersections with accident data on a map.

Layers in this group

Show layer list

Traffic Accidents

Time-series dataFree (partly paid plans)
Show details

View accidents year by year (2019–2024) or all years together.You can also ask the AI chat about a specific past year or compare with the past (questions without a year use the latest data).

Free: the year 2019 only. Other years and all years need Starter or above.

Overview

Accident locations from NPA open data (nationwide, 2019-2025, ~2.18M records). For school route safety and insurance.

Data source

NPA Open Data

Traffic Accidents — Screen example (with legend and click popup)
Screen example (with legend and click popup) ・Click the image to open it full size

Crime Incidents

Time-series dataFree (partly paid plans)
Show details

View incidents year by year (2019–2025) or all years together (2025 omits some prefectures).You can also ask the AI chat about a specific past year or compare with the past (questions without a year use the latest data).

Free: the year 2019 only. Other years and all years need Starter or above.

Overview

Crime locations from prefectural police (~526,000 records, all 47 prefectures as of Nov 2026; 2025 data is added as each prefecture publishes it). For residential safety and rental valuation.

Data source

Prefectural Police

Crime Incidents — Screen example (with legend and click popup)
Screen example (with legend and click popup) ・Click the image to open it full size

Serious Crime (Tokyo, by town)

Limited regionsTime-series dataFree (partly paid plans)
Show details

View counts by town year by year (2009–2025) or as the yearly average over all years (years other than 2009 need Pro or above).

  • Tokyo only (annual recognized-case counts by town published by the Tokyo Metropolitan Police Department). Areas outside Tokyo are not covered.

Free and Starter: the year 2009 only. Other years and all years need Pro or above.

Overview

Tokyo only (annual recognized-case counts per town published by the Tokyo Metropolitan Police, 2009-2025). Switch between robbery, homicide/arson, bodily injury, assault, threats/extortion, burglary (empty house), sneak-in/occupied-house burglary and other burglary. Complements the seven-theft-type point layer (Crime Incidents), which does not include these crime types. Counts per town, not the location of individual incidents. Provisional figures at publication; they may differ from other statistics. "All years" shows the yearly average. The Free and Starter plans show only 2009 (the oldest year); other years and "All years" are available on Pro and above.

Data source

Tokyo Metropolitan Police Department, "Recognized cases by town, crime type and method", Tokyo, CC BY 4.0 (joined to town boundaries and re-aggregated by MAPRISE)

Serious Crime (Tokyo, by town) — Screen example (with legend and click popup)
Screen example (with legend and click popup) ・Click the image to open it full size

PLATEAU Buildings

Limited regionsBeta / early accessFree (partly paid plans)
Show details
  • Building display is nationwide, but the seismic simulation (per-building collapse probability) covers only 27 Kyushu municipalities (~1.96 million buildings).→ Seismic simulation overview
  • The seismic simulation is a research-stage prototype (beta); outputs are reference information and cannot be used for formal seismic assessment.→ Seismic simulation overview

Free: building colouring only. 3D attributes such as height and floors, and the shadow / sunlight-hours calculation, need Starter or above.

Overview

MLIT 3D city models. 3D display of building height and usage covers some municipalities nationwide (~23.77M buildings) as of Sept 2026. Seismic collapse-probability analysis, however, is limited to ~1.96M buildings across 27 Kyushu municipalities (Fukuoka, Kitakyushu, Kumamoto, Sasebo, Kurume, etc). Attribute coverage in PLATEAU varies by municipality and survey year. Buildings we individually verified are outlined in gold with corrected usage. The share of buildings with a known usage differs widely: Kurume 100%, Kitakyushu 90%, Fukuoka 85%, but Omachi, Hita and Ogi are at 0% (usage attributes are absent from PLATEAU itself), and Shiroishi 22% / Kohoku 29%. An area that appears uniformly gray is not a data fault - the source data simply carries no usage information (measured 2026-08-02).

Data source

Processed by Vulcanz LLC from MLIT PLATEAU (3D city models, CC BY 4.0)

PLATEAU Buildings — Screen example (with legend and click popup)
Screen example (with legend and click popup) ・Click the image to open it full size

PLATEAU buildings (use, height, seismic standard, shadows)

Information as of: as of 4 October 2026

Shows MLIT Project PLATEAU 3D building models on the map, building by building. Switch between three colourings (by use, by seismic standard, by height); click a building to see its year built, seismic standard, height, floors and structure. The same data drives the winter/summer solstice shadow and sunlight-hours calculations.

Coverage

  • Building display (use, height, seismic standard, structure, shadows)

    Nationwide (265 municipalities with PLATEAU data, ~23.76 million buildings; not limited to Kyushu)

    Counts are as loaded on 16 August 2026 and keep growing as municipalities publish data.

  • Seismic simulation (per-building collapse probability)

    27 Kyushu municipalities, ~1.96 million buildings (Kyushu only for now)

    The nationwide expansion is the building display; collapse-probability analysis is limited to Kyushu, where the shaking mesh is computed.

Three ways to colour the same buildings

  • By use

    Six classes: residential (blue), multi-family (purple), commercial/business (red), factory/workshop (orange), agriculture/forestry/fishery (green), public/other (grey).

  • By seismic standard

    From the year built: pre-1970, 1971–1981, 1982–1999, post-2000 and unknown. A bird's-eye view of how seismic standards are distributed across an area.

  • By height

    An 8-step gradient from 0–3 m to 60 m+. The boundary between high-rise clusters and low-rise housing is visible at a glance.

  • Map around Hakata Ward and Tenjin, color-coded by use. Residential (blue), multi-family housing (purple), and commercial/business (red) buildings are shaded block by block, with a legend in the bottom right
  • Map around Hakata Ward and Tenjin, color-coded by seismic standard. A cluster of pre-old-standard (red) and old-standard (orange) buildings stands out near Hakata Station, with a legend in the bottom right
  • Map around Hakata Ward and Tenjin, color-coded by height. Building heights are shown as a gradient from low-rise (yellow to blue tones) to high-rise (purple to red tones), with a legend from 0-3m to 60m+ in the bottom right

Hakata / Tenjin (left to right: by use / by seismic standard / by height)

Filters and the building detail popup

Filter by use, seismic-standard era and structure (wood, steel, SRC, RC, light-gauge steel, etc.). Click a building to see its city, year built, seismic standard, height, floors and structure.

  • The filter panel for the PLATEAU Buildings layer, showing checkboxes for use type (residential, multi-family, commercial/business, factory/workshop, agriculture/forestry/fishery, public/other), seismic standard (all eras, pre-1970, pre-1981, post-1982, post-2000), and structure (wood, steel, SRC, other non-wood, RC, light-gauge steel, brick/block, unknown)
  • Popup shown when clicking a PLATEAU building, listing city (Fukuoka City), year built (2008), seismic standard (post-2000 standard), height (41.3m), floors (1F/B9999), and structure (RC), with a button below reading "Analyze 6-scenario collapse probability with AI"

Not only Hakata: examples from across Japan

Screens from Tokyo, Osaka, Nagoya and Sendai (captured from the app on 4 October 2026).

  • Area around Tokyo Station and Marunouchi coloured by use. Commercial/business (red), residential (blue) and others are shaded building by building, with a legend at the bottom right
  • Area around Tokyo Station and Marunouchi coloured by height. Heights shown as a gradient from low-rise to high-rise, with a legend from 0-3 m to 60 m+ at the bottom right
  • Area around Osaka Station and Umeda coloured by use. Commercial/business buildings (red) line the station area, with a legend at the bottom right
  • Area around Osaka Station and Umeda coloured by height. The station building and high-rises are purple to red, while low-rise buildings are blue
  • Area around Nagoya Station coloured by use. Commercial/business (red), multi-family housing (purple) and others are shaded block by block
  • Area around Sendai Station coloured by height. High-rises near the station are red to purple, with low-rise buildings around them in blue

Attributes (use, year built, structure) differ by municipality

The attributes PLATEAU carries vary by municipality and survey year. Where year built is not recorded, "by seismic standard" shows pale grey (unknown), and areas with no recorded use look uniformly grey in the use colouring. This is not a data fault: the source data simply has no information (example below: around Tokyo Station). Height is available in most areas.

  • Area around Tokyo Station in seismic-standard colouring. Buildings with no year of construction on record are shown in pale grey (unknown)

Buildings we verified and corrected are outlined in gold

Where use is missing or wrong in the source, we investigate individually, correct it and outline the building in gold (example: around Gion and Sumiyoshi Shrine, Hakata).

  • A use-classification map of the area around Gion and Sumiyoshi Shrine in Hakata. Buildings outlined in a bold gold line are individually verified and use-corrected, with the PLATEAU Buildings legend shown in the bottom right (residential / apartments / commercial-business / factory-workshop / agriculture-forestry-fishery / public-other color coding, plus a gold-outline = individually verified badge)

Everyday problems it helps with

  • Real Estate BrokersCheck the structure, age and height of the target and neighbouring buildings on one map before the important-matters briefing.
  • Developers / FundsIn early site screening, see the distribution of building use and height as an area, and find where high-rise clusters give way to low-rise housing.
  • Banks (Lending)Check the structure and age (seismic standard) of collateral and surrounding buildings on a map as primary information for credit review.
  • Legal & Appraisal ProfessionalsEfficiently confirm structure, age and height of the subject and nearby buildings during appraisal and survey work.
  • Local GovernmentSurvey the building stock by seismic standard and consider priority areas for retrofitting.

Assumptions and limits (reference only)

  • What is shown depends on what PLATEAU covers. Buildings and areas not covered are not displayed; missing attributes appear as "unknown".
  • Seismic-standard colours are a guide based on year built and do not indicate the seismic performance of an individual building.
  • Per-building collapse-probability analysis covers only 27 Kyushu municipalities and is a research-stage reference (not for formal seismic assessment).

Sun & shadow (shadows and sunlight-hours heatmap)

PLATEAU 3D buildings are combined with GSI elevation data and the height of elevated roads and railways to reproduce shadows at the winter solstice, equinox and summer solstice, hour by hour. A heatmap shows how many hours of sunlight each spot gets in a day. Everything is calculated in the browser, so you can pan the map and see results immediately.

Data used

  • PLATEAU (3D city model)

    Building heights. Where height is unknown it is estimated as floors × 3 m; buildings with neither are excluded.

    Source: MLIT Project PLATEAU

  • Elevation data (mountain and hill shade)

    Terrain up to about 20 km away is considered when calculating when the sun is blocked. Drawn in a different colour from building shadows.

    Source: GSI elevation tiles

  • Elevated roads and railways

    Height (roughly 6–16 m) and width are estimated from bridge/viaduct tags. These are estimates, not measurements.

    Source: OpenStreetMap (ODbL 1.0)

Shadows differ greatly between winter, equinox and summer

Osaka Station at 15:00, shown for the winter solstice, equinox and summer solstice from left to right. At the winter solstice the sun is only about 17° high and shadows stretch far; at the summer solstice it is about 49° and shadows fall short at the foot of buildings.

  • Winter solstice shadows around Osaka Station at 15:00. The sun is only about 17 degrees high, so shadows from buildings and elevated tracks stretch far to the northeast and cover a large part of the area in dark navy
  • Equinox shadows around Osaka Station at 15:00. The sun is about 36 degrees high, shadows are shorter than at the winter solstice, and more white sunlit area appears
  • Summer solstice shadows around Osaka Station at 15:00. The sun is about 49 degrees high, shadows fall short at the base of buildings, and most roads and plazas are sunlit

Move the time and the shadows move

Nishi-Shinjuku at the winter solstice at 9:00, 12:00 and 15:00. The shadows follow the time slider, and a "day motion" button plays the movement back.

  • Winter solstice shadows at 9:00 in Nishi-Shinjuku. The sun is low in the southeast and shadows from high-rises stretch long toward the northwest
  • Winter solstice shadows at 12:00 in Nishi-Shinjuku. The sun is due south, shadows point due north and are shorter than at 9:00
  • Winter solstice shadows at 15:00 in Nishi-Shinjuku. The sun is low in the southwest and shadows lengthen again toward the northeast

Sunlight hours as a heatmap

Switch to "sunlight hours (per day)" to see by colour how many hours each spot is sunlit (navy → blue → green → yellow, longer). Nagoya Station at the winter and summer solstices, and Tenjin, Fukuoka at the winter solstice.

  • Winter solstice sunlight-hours heatmap around Nagoya Station, counted over apparent solar time 8:00–16:00. Blue to purple areas dominate, and yellow (6 hours or more) is limited to places such as along the railway tracks
  • Summer solstice sunlight-hours heatmap around Nagoya Station for the same area. The yellow (6 hours or more) area spreads widely and more places receive long sunlight
  • Winter solstice sunlight-hours heatmap around Tenjin, Fukuoka. Streets between buildings are colored blue to purple, while open spaces such as parks and intersections are yellow or green

Mountain and hill shade is included

Tottori City at 9:00 on the winter solstice and its sunlight-hours heatmap. Brown areas are shaded by mountains and hills, drawn separately from building shadows (dark grey).

  • Winter solstice shadows at 9:00 in central Tottori City. The slope of the mountain to the east (right side) is painted brown, showing the area in the mountain's shade. Shadows from buildings in the town are drawn in dark gray
  • Winter solstice sunlight-hours heatmap for eastern Tottori City. Parts of the mountain slopes in terrain shade are shown in dark blue and purple, while sunny slopes are yellow

Click a point to compare the three seasons

Use "check sunlight at a point" and click the map to see that spot's sunlight hours for the three seasons side by side. In this example: 3 h 20 min / 5 h 10 min / 7 h 40 min.

  • The "Sunlight at this point" popup after clicking a point in Nishi-Shinjuku. Sunlight is 3 hours 20 minutes at the winter solstice, 5 hours 10 minutes at the equinox and 7 hours 40 minutes at the summer solstice, shown with hourly bar charts

Screens from the live app

Everyday problems it helps with

  • Developers / FundsCompare the sunlight of candidate sites across seasons, including the winter solstice, before visiting, and see how far shadows from tall buildings to the south and west reach.
  • Real Estate BrokersShow customers, on a map, which parts of a plot get long or short sunlight, for sales and leasing.
  • Banks (Lending)For collateral in hilly areas, check sunlight hours including mountain shade in advance.
  • Local GovernmentUse shadow screens to give stakeholders a shared understanding of sunlight.

Assumptions and limits (a guide only)

  • Trees and buildings not yet in PLATEAU are not considered; shadows from distant buildings outside the screen may be missed.
  • Terrain shade is calculated at points tens of metres apart, so retaining walls and small cliffs do not appear. Elevated heights are estimates.
  • The "apparent solar time 8:00–16:00" tally follows the measurement window used for shadow regulations but is not a compliance check. Always have an architect confirm shadow diagrams and regulations for actual plans.
  • Requires the Starter plan or above. Shown at zoom level 13 and higher.
→ Read the full article
↑ Back to top

Note: every layer is reference information. For legal checks or formal procedures, please consult the primary materials published by the competent authority. Screen examples show one location; coverage and update status differ by layer.

Pages that readers often check next.