We combine ground and building data with academic damage functions to estimate per-building collapse probability, then validate the results against real observation records and field surveys.
Earthquake simulations already exist. The real question is how much to trust the numbers
Earthquake damage projection services are common. Color-coded intensity maps, tools that show a building's seismic-code era — none of this is new on its own.
What MAPRISE is working toward goes a step further: combining ground data and building data — a genuinely multi-source approach — with academic damage functions to compute per-building collapse probability, and then checking those estimates against real observation records and field survey results to show how close they actually get.
What we're combining
MAPRISE's seismic simulation feature (beta) layers the following data to compute per-building collapse probability:
- Ground data: measured surface ground amplification mesh from NIED's J-SHIS
- Building data: Project PLATEAU 3D city models (structure type and construction era for roughly 1.55 million buildings across 17 cities in Kyushu)
- Ground motion propagation: the Si–Midorikawa (1999) attenuation relation
- Building fragility: structure-specific damage functions — a JMA-intensity-based function (Sudo, Yamazaki & Matsuoka 2019) for wood-frame buildings, and a PGV-based function (Murao & Yamazaki 2000) for non-wood structures

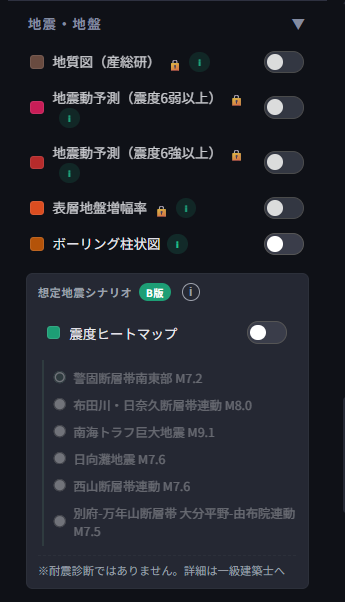
We continue to use the same 6 scenarios introduced previously.
What's new: per-building resolution
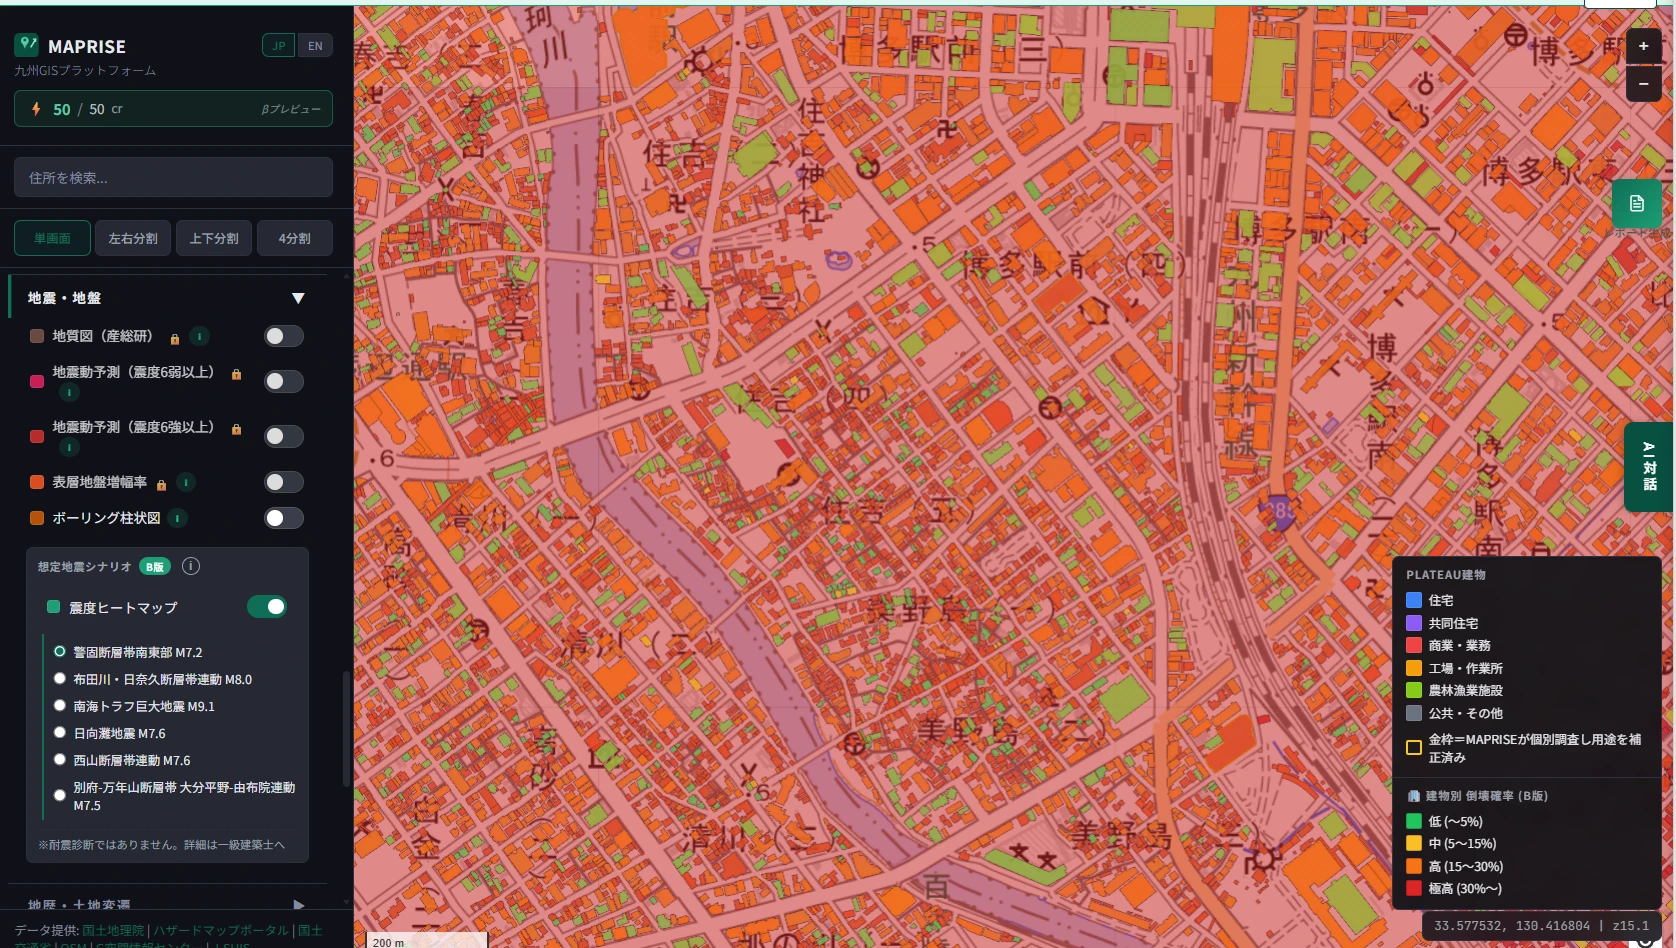
Previously, intensity was shown mainly at 1 km mesh resolution. This update substantially raises the resolution of the ground-motion data and adds per-building collapse-probability display on the map. Zooming in automatically switches from the intensity heatmap to per-building color coding.
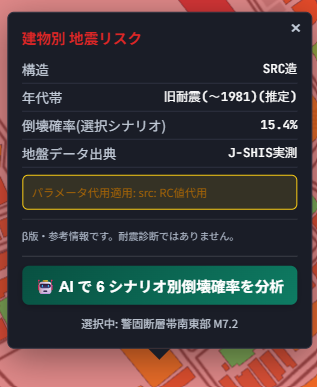
Clicking a building shows its structure type, construction era, collapse probability under the selected scenario, and the source of the ground data used.
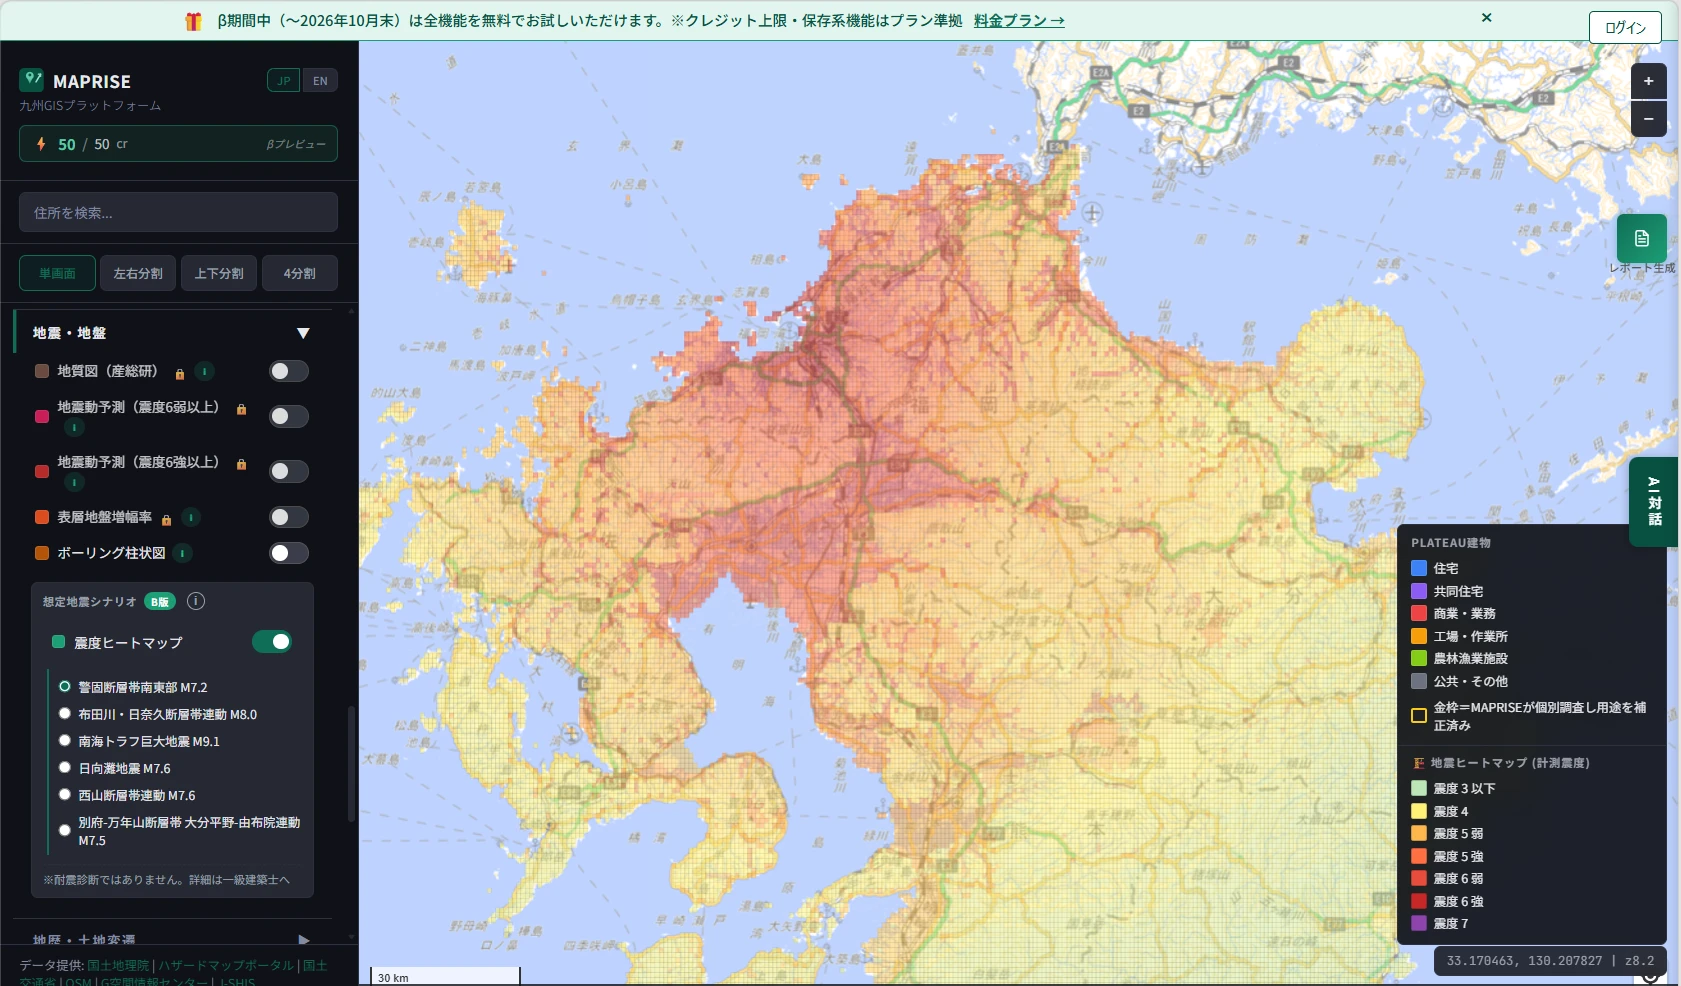
At wider zoom levels, the intensity heatmap still gives a region-wide view across Kyushu, as before.
What matters most here: checking our work
A simulation is only "plausible numbers" until you check it against reality. We validate MAPRISE's outputs against real observation records and on-the-ground survey data from an actual earthquake.
- KiK-net station data from the 2016 Kumamoto earthquake mainshock (Mashiki): comparing observed ground motion intensity against our simulated values
- A building-by-building damage survey in Mashiki: comparing the actual damage rates from a National Institute survey against our simulated average probabilities by construction era
This comparison work has driven concrete improvements — incorporating measured ground data into the site-amplification estimate, and replacing the damage function used for non-wood structures with one specific to that structure type. Checking our work and narrowing the gap with reality, repeatedly — that's the core of this update.
Important caveats
The seismic scenario feature is currently in beta.
This feature is a beta research-and-development prototype and does not constitute a formal seismic diagnosis under Japan's Building Seismic Retrofit Promotion Act. It is reference and screening information only. Buildings with unknown construction year are conservatively assumed to be pre-1981 code, and there remains substantial uncertainty in the earthquake occurrence probabilities themselves. It may not be used as the basis for statutory disclosure under Article 35 of the Real Estate Transaction Business Act, seismic performance certification under the Building Standards Act, real estate appraisal, or earthquake insurance rate-setting. Please consult a licensed architect or qualified specialist for a formal seismic assessment.
For detailed specifications, see the Seismic Simulation Feature Overview.
Tags: #seismic #simulation #beta #validation
Other-language share text (exception cases)
Quick share above follows our platform-locked language policy (X-family in Japanese, LinkedIn in English). The four panes below let you grab the opposite-language body when needed — e.g. introducing an English post to a Japanese audience on X, or posting a Japanese article to LinkedIn in Japanese. Each pane offers both a copy button and a direct intent link.
📝 MAPRISEで挑戦する地震の倒壊スコアリング — 実測データとの答え合わせ
地盤・建物という複合的なデータと学術的な被害関数を組み合わせて建物単位の倒壊確率を算出し、公的な観測記録・悉皆調査結果と突き合わせて精度を検証する取り組みを紹介します。
https://maprise.jp/ja/blog/seismic-collapse-scoring-accuracy/ #地震 #シミュレーション
🆕 新しいブログ記事を公開しました。

《MAPRISEで挑戦する地震の倒壊スコアリング — 実測データとの答え合わせ》

地盤・建物という複合的なデータと学術的な被害関数を組み合わせて建物単位の倒壊確率を算出し、公的な観測記録・悉皆調査結果と突き合わせて精度を検証する取り組みを紹介します。

👉 詳しくはこちら: https://maprise.jp/ja/blog/seismic-collapse-scoring-accuracy/
📝 How MAPRISE Scores Building Collapse Risk — Checking Our Work Against Real Data
We combine ground and building data with academic damage functions to estimate per-building collapse probability, then validate the results against …
https://maprise.jp/en/blog/seismic-collapse-scoring-accuracy/ #seismic #simulation
🆕 New on the MAPRISE blog.

《How MAPRISE Scores Building Collapse Risk — Checking Our Work Against Real Data》

We combine ground and building data with academic damage functions to estimate per-building collapse probability, then validate the results against real observation records and field surveys.

👉 Read the full post: https://maprise.jp/en/blog/seismic-collapse-scoring-accuracy/

#seismic #simulation #beta #validation