Fukuoka keeps getting called Japan's fastest-appreciating city, and the Tenjin Big Bang redevelopment gets the credit. We checked the claim directly against MAPRISE's land-price and 3D-building data — down to a tower still under construction at ¥11.8 million per square meter — and against the population numbers that make the whole thing possible.
Hello from the MAPRISE development team. I've lived in Fukuoka since 2011, and there are days I genuinely don't recognize my own neighborhood. A three-story apartment building I used to walk past has quietly become a ten-plus-story tower. Out in the suburbs, a run of small houses I knew individually has been bought up as a single parcel and replaced by a high-rise, seemingly overnight. Living here, you feel the pace of change before you can explain it.
One explanation is a specific policy program: Tenjin Big Bang, the urban redevelopment initiative Fukuoka City launched in 2015. This post is our attempt to check that explanation against actual data — land prices, building ages, building heights — rather than just repeat what everyone already says about Fukuoka.
What the Tenjin Big Bang Actually Changed
Tenjin sits about 5 km from Fukuoka Airport in a straight line. For decades, that proximity meant strict height restrictions under Japan's Civil Aeronautics Act — restrictions strict enough that owners of older, non-conforming buildings couldn't rebuild without shrinking their own floor space. Nobody wants to tear down a building only to end up with less of it, so aging buildings simply stayed up.
In 2014, Fukuoka was designated a National Strategic Special Zone, and the city used that status to negotiate an exception to the height limit. It paired that with its own floor-area-ratio bonus of up to +50%, nicknamed the "Tenjin BBB" (Big Bang Bonus), for owners who redevelop. The 2005 Fukuoka-ken Seihō-oki earthquake, which exposed how vulnerable a lot of the older stock actually was, is widely cited as the other push that got building owners to actually pull the trigger.
The program's original 10-year window was extended to the end of December 2026 because of pandemic-era delays, and it's still running. Landmarks along the way include the 2016 renewal of Suijo Park, the Tenjin Business Center, Fukuoka Ohana Garden City (built on the site of the former Daimyo Elementary School), and Tenjin Business Center II, completed on June 30, 2026, with its public opening set for early August.
Credit for actually getting this built usually goes to Mayor Sōichirō Takashima, in office since December 2010, for pursuing the special-zone designation and designing the floor-area-ratio incentive; to the city staff who turned that into a workable permitting process; and to the developers who took on the financial risk of rebuilding first, Fukuoka Jisho prominent among them. A decade-plus of consistent execution is the reason this looks like a changed skyline rather than a plan on paper.
The One Japanese City That Hasn't Stopped Growing
None of this works without demand, and that's where Fukuoka's population story comes in.
Japan's population peaked at roughly 128.08 million in 2008 and has been declining ever since. Fukuoka City is one of the rare exceptions: it hasn't recorded a population decline in any national census since the very first one, in 1920. In its own 2024 population projection, the city expects to keep growing until around 2040, when it's projected to reach approximately 1.702 million — five years later than the 2035 peak projected back in 2012. The National Institute of Population and Social Security Research projects that, among Japan's ordinance-designated cities, only Kawasaki, Saitama, and Fukuoka will have a larger population in 2050 than they had in the 2020 census.
The driver is straightforward: an inflow of students and young workers (social increase) outpacing the excess of deaths over births (natural decrease). That inflow is exactly what makes office and residential demand durable enough for private developers to fund something as capital-intensive as the Big Bang.
Checking It on the Map
That's the story everyone already tells. What we wanted to know is whether it actually shows up in the numbers — so we opened MAPRISE's land-price layers and looked.
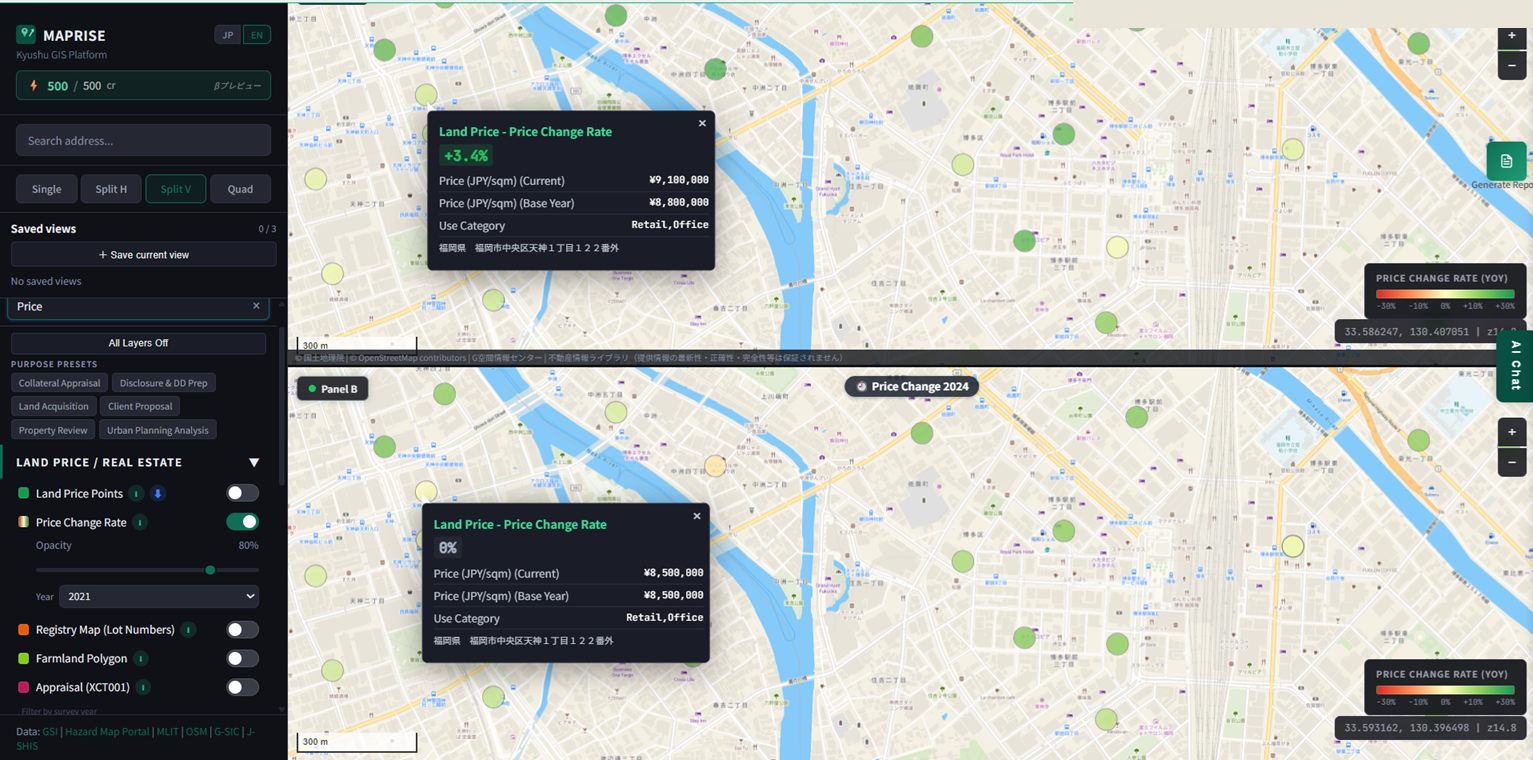
Two points, both in the same corner of Tenjin, one year-over-year color layer. One is climbing over 4% a year. The other, a short walk away, hasn't moved at all. That's not a citywide trend — it's a highly localized one, concentrated exactly where the redevelopment is happening.
Here's what one of those hot points looks like up close. This is Tenjin 1-chome, block 96-1 — the site of the One Fukuoka Building, one of the Big Bang's flagship towers, currently under construction:
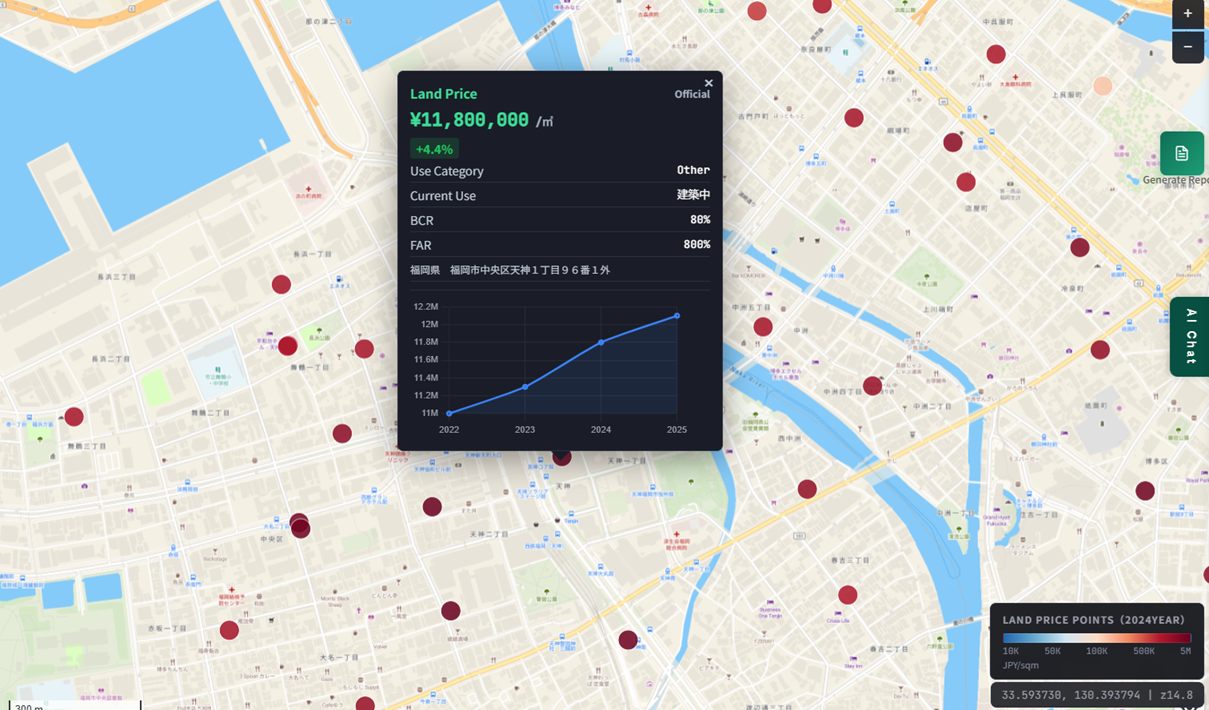
At ¥11.8 million per square meter, this is the single most expensive official land-price point we found anywhere in the area — a floor-area ratio of 800% tells you the zoning here allows a genuinely tall building, and "under construction" as the current-use field is about as literal a confirmation as land-price data ever gives you that redevelopment is actively in progress on this exact parcel.
Now compare that to Watanabe-dori, one of Tenjin's other major streets, a few blocks over:
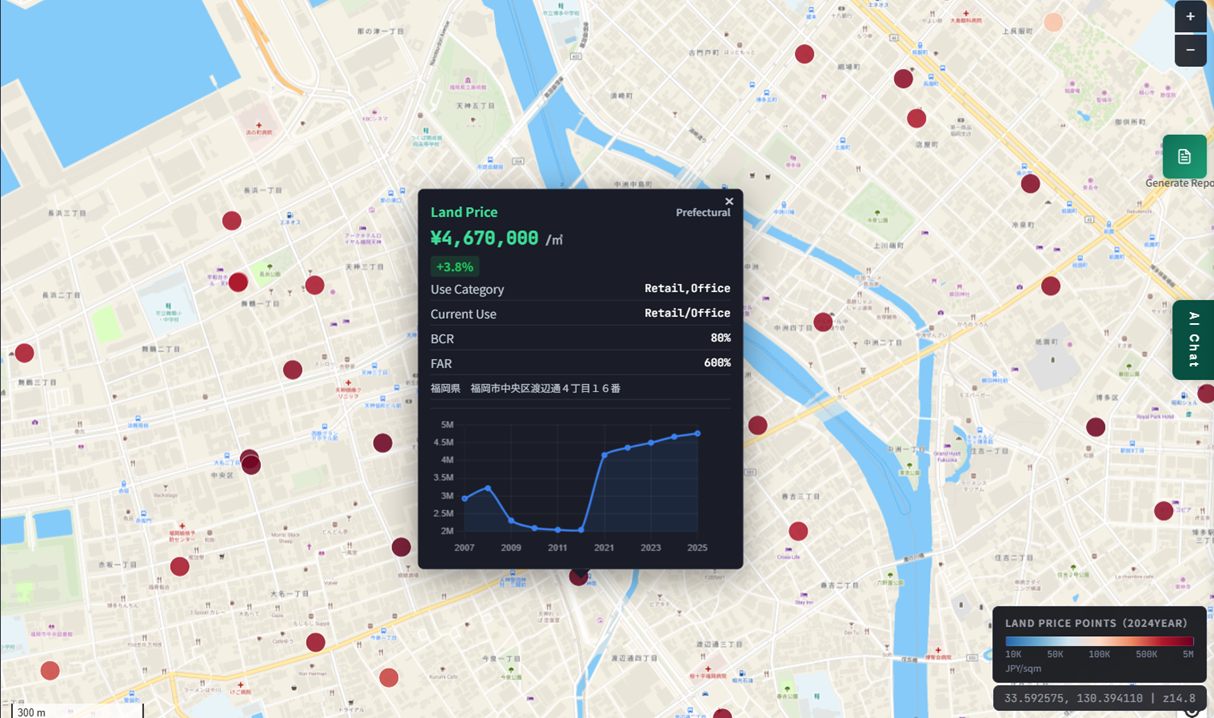
The shape of this chart is the interesting part. Price here was essentially flat for more than ten years — through the 2008 financial crisis, through the 2010s — and only started climbing sharply around 2021. That inflection point lines up with the Big Bang's later, more visible construction phase far better than it lines up with anything in the general economy. A point that sat still for a decade and then took off isn't background noise; it's a specific, dateable policy effect showing up in the data.
What's Actually Being Built, in 3D
Land price tells you value is moving. It doesn't tell you what's physically replacing what. For that we switched to MAPRISE's PLATEAU 3D building layer, which renders real building footprints and attributes across Kyushu.
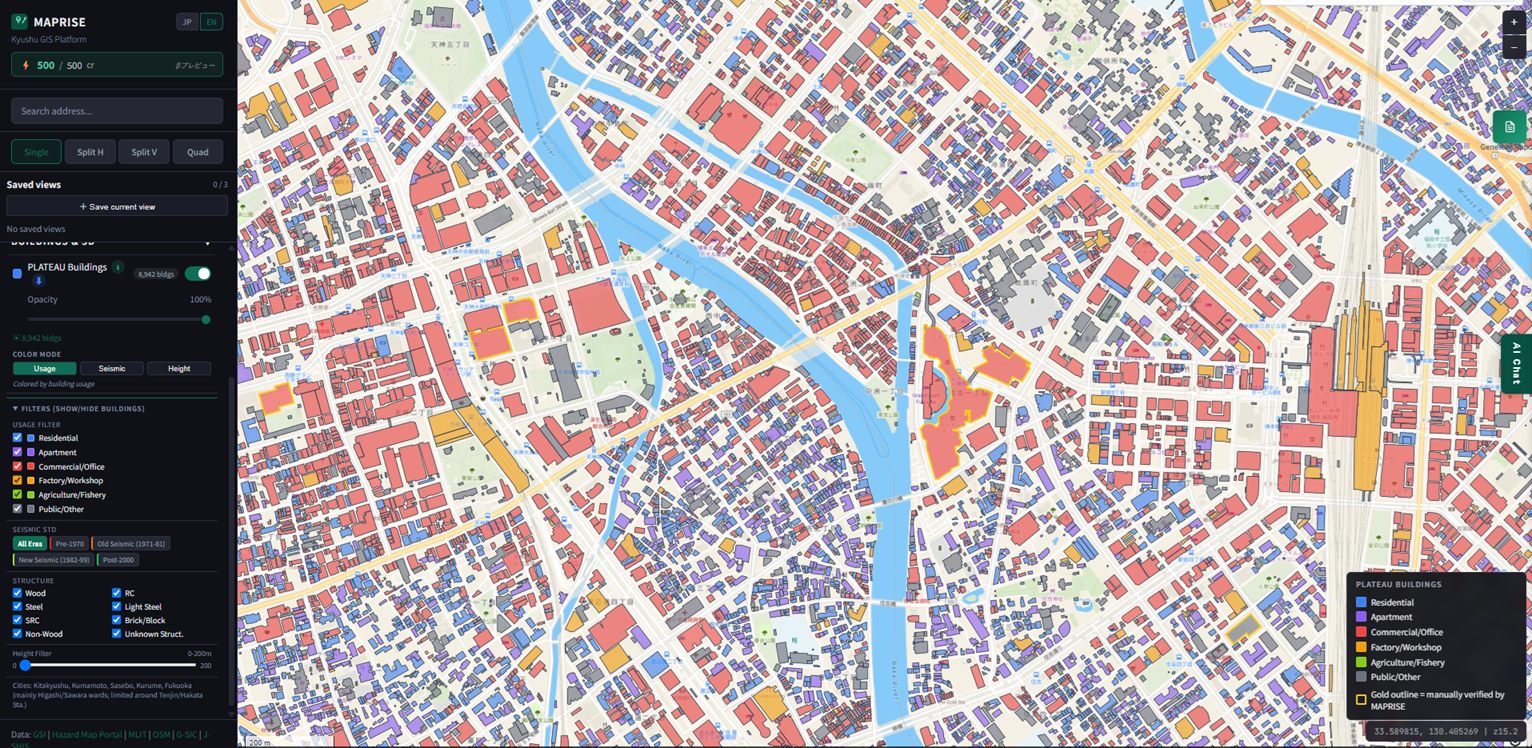
Tenjin and the Watanabe-dori corridor read as a dense red cluster — commercial and office space, exactly where the redevelopment is concentrated.
Switching the same layer to color by seismic design standard is where it gets genuinely striking. Japan's building code sets clear eras: pre-1970, an "old seismic standard" from 1971–81, a "new seismic standard" introduced in 1982–99, and the stricter 2000-and-later standard.
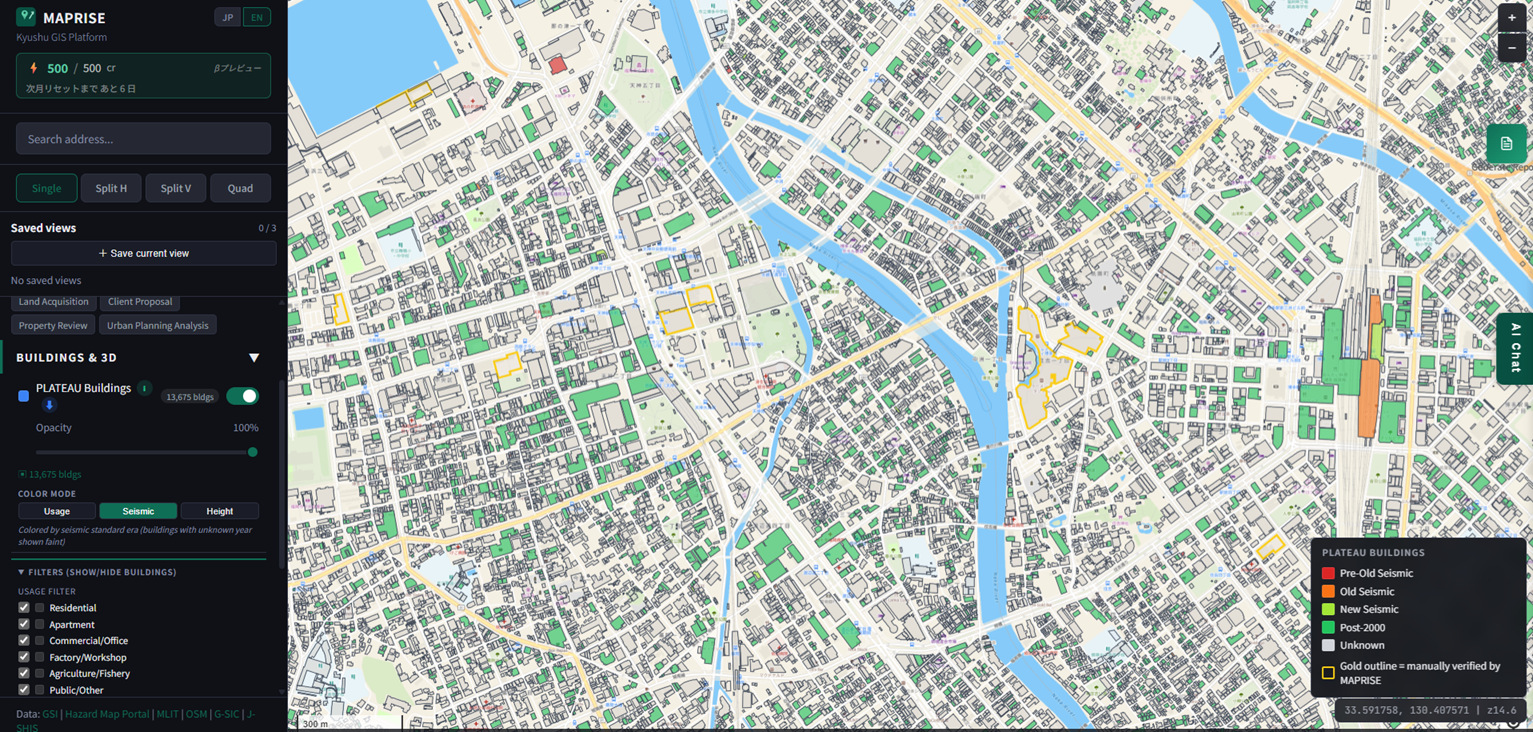
The Big Bang footprint — the cluster around Keyaki-dōri, in front of Kego Shrine, and around Tenjin Station — is almost entirely green: buildings meeting the strictest, most recent seismic standard. The blocks around it still carry a visible mix of red and orange, meaning older buildings built before or under earlier codes. This is the 2005 earthquake's fingerprint on the data: the area that redeveloped is, quite literally, the area that got rebuilt to current seismic code, while its surroundings mostly didn't.
One more pass, this time colored by building height:
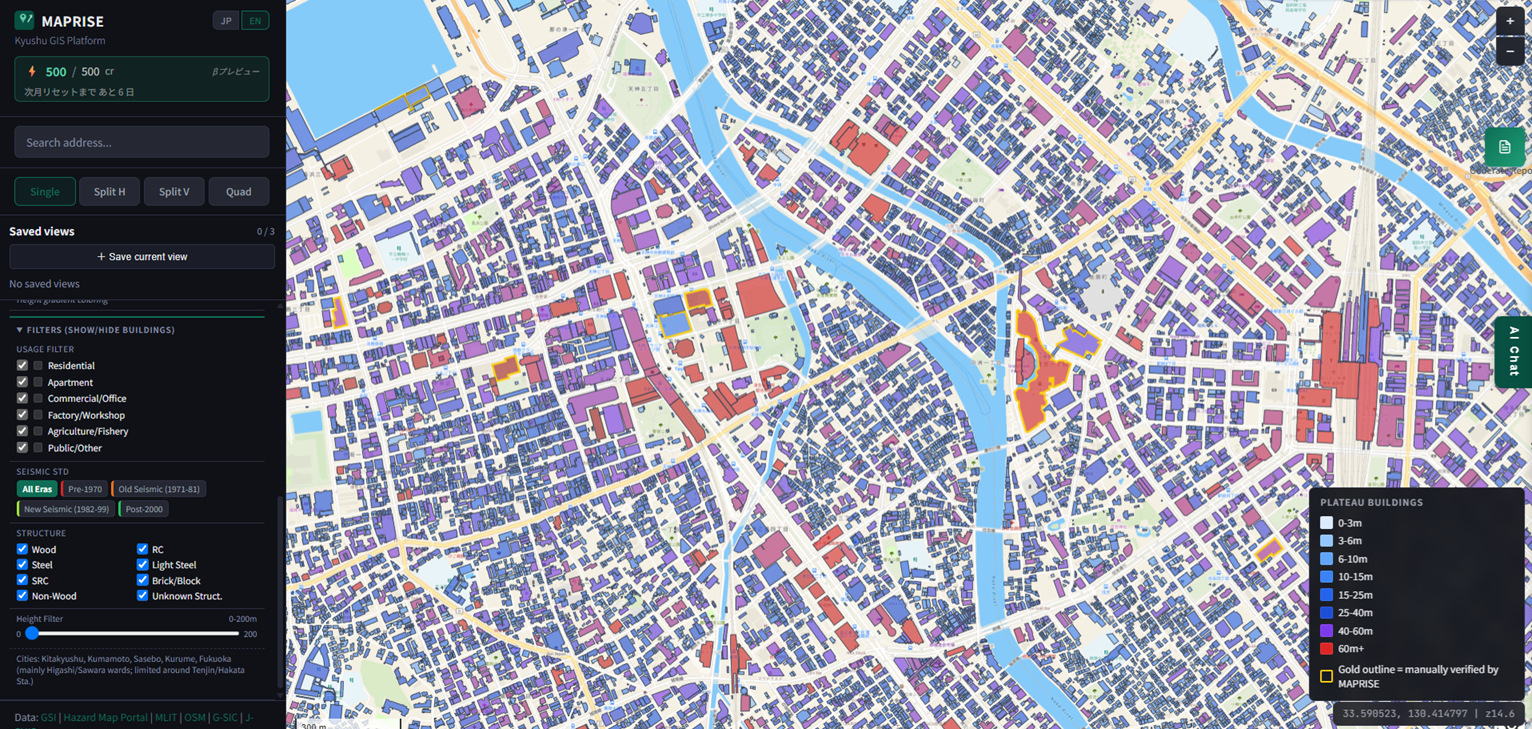
Same story again: the tallest buildings (the red band, 60 meters and up) sit almost exactly on top of the redevelopment footprint. That's the height-limit relaxation showing up as physical geometry — you can see, block by block, precisely where the special-zone exception applies and where it doesn't.
Under the Hood: What the 3D Layer Actually Lets You Toggle
The three color modes above aren't just visual presets — each one sits on top of the same set of per-building filters, shown and hidden independently of whichever color mode is active. You can filter by usage (residential, apartment, commercial/office, factory/workshop, agriculture/fishery, public/other), by seismic standard era (pre-1970, old seismic 1971–81, new seismic 1982–99, post-2000), and by structural material (wood, steel, SRC, RC, light steel, brick/block, unknown).
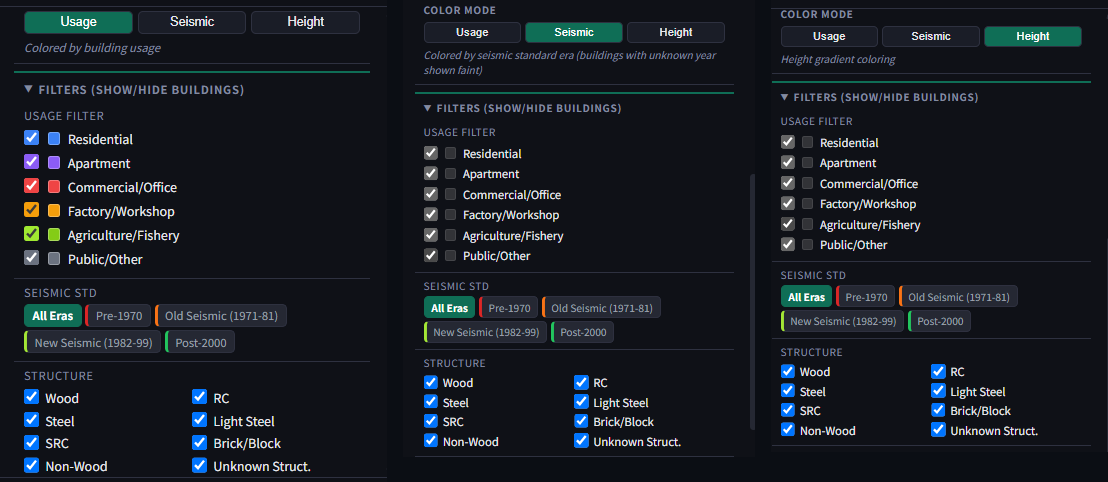
That's the same underlying per-building dataset — usage, construction-era class, and structural material — that powers a separate MAPRISE feature: building-level earthquake collapse-probability scoring. If you want to see how far this data goes, we wrote up how that scoring works, and how we validated it against real observed damage, in How MAPRISE Scores Building Collapse Risk.
Numbers and What It Feels Like to Live Here
None of this is news, exactly. International coverage already reports Fukuoka posting some of Japan's highest land-price growth rates for two years running. What we wanted to add is a way to check that claim yourself, point by point, rather than take a headline number on faith — and, on the way, some data that ties the price movement to a specific mechanism (the special-zone height exception, the floor-area bonus, the seismic-code push) rather than treating it as a vague "hot market."
Having lived through it since 2011, I'll admit the number that convinces me isn't the headline growth rate — it's watching a single flat line on a chart snap upward in exactly the year construction picked up nearby. The data and the lived experience turn out to agree.
If you want to check any of this yourself, MAPRISE lets you toggle land-price and PLATEAU 3D layers, click any single point, and see the same price, use, and multi-year trend data shown above.
The land-price data in this article is reference information based on the MLIT Official Land Price Publication and the Fukuoka Prefectural Land Price Survey. It does not guarantee future price movement at any individual point. For investment or transaction decisions, please consult a real-estate appraiser or other qualified professional.
Sources: MLIT Official Land Price Publication, Fukuoka Prefectural Land Price Survey, Fukuoka City "Future Population Projection for Fukuoka City" (April 2024), National Institute of Population and Social Security Research (IPSS), Fukuoka City official website.
Tags: #Tenjin Big Bang #Fukuoka #Land price #Urban redevelopment #PLATEAU
Other-language share text (exception cases)
Quick share above follows our platform-locked language policy (X-family in Japanese, LinkedIn in English). The four panes below let you grab the opposite-language body when needed — e.g. introducing an English post to a Japanese audience on X, or posting a Japanese article to LinkedIn in Japanese. Each pane offers both a copy button and a direct intent link.
📝 天神ビッグバンを地図で歩く ― 人口減少ニッポンで、なぜ福岡だけ伸びているのか
「福岡は2年連続、地価上昇率日本一」とよく言われます。本当にそうなのか、天神ビッグバンの前後でMAPRISEの地価レイヤーがどう動いたかを、建築中のビルの実データや3D建物データまで含めて地図で確かめてみました。2011年から福岡に住む筆者が見てきた街の変貌も交えて。
https://maprise.jp/ja/blog/tenjin-big-bang/ #天神ビッグバン #福岡市
🆕 新しいブログ記事を公開しました。

《天神ビッグバンを地図で歩く ― 人口減少ニッポンで、なぜ福岡だけ伸びているのか》

「福岡は2年連続、地価上昇率日本一」とよく言われます。本当にそうなのか、天神ビッグバンの前後でMAPRISEの地価レイヤーがどう動いたかを、建築中のビルの実データや3D建物データまで含めて地図で確かめてみました。2011年から福岡に住む筆者が見てきた街の変貌も交えて。

👉 詳しくはこちら: https://maprise.jp/ja/blog/tenjin-big-bang/

#PLATEAU
📝 Tenjin Big Bang, Mapped: Inside Fukuoka's Skyline Boom While Japan Shrinks
Fukuoka keeps getting called Japan's fastest-appreciating city, and the Tenjin Big Bang redevelopment gets the credit. We checked the claim directly a…
https://maprise.jp/en/blog/tenjin-big-bang/ #TenjinBigBang #Fukuoka
🆕 New on the MAPRISE blog.

《Tenjin Big Bang, Mapped: Inside Fukuoka's Skyline Boom While Japan Shrinks》

Fukuoka keeps getting called Japan's fastest-appreciating city, and the Tenjin Big Bang redevelopment gets the credit. We checked the claim directly against MAPRISE's land-price and 3D-building data — down to a tower still under construction at ¥11.8 million per square meter — and against the population numbers that make the whole thing possible.

👉 Read the full post: https://maprise.jp/en/blog/tenjin-big-bang/

#TenjinBigBang #Fukuoka #Landprice #Urbanredevelopment #PLATEAU