Search for "Japan market entry" and you get business-etiquette explainers and articles about Tokyo. But what actually decides whether a store or a branch works is a question that comes earlier: can a business survive in this specific spot? Using Fukuoka as the example, we walk through an actual location feasibility check in three steps — 500 m mesh population projections, switching to 250 m resolution, and overlaying station passenger counts with land prices.
Hello from the MAPRISE development team.
Search for "Japan market entry" and most of what comes back is either an explainer on business etiquette or an article about Tokyo. That material isn't useless, but for anyone actually weighing a store opening or a new branch, it sits some distance from the decision at hand.
What decides success or failure is a question that comes earlier. Can a business actually survive in this specific spot? Is the population growing or shrinking? How many people are in the catchment? Is the land priced sensibly? And will disaster risk or zoning trip you up later?
None of that needs to rest on intuition or hearsay. It can be checked against open data. Using Fukuoka as our example, here is the location feasibility check we would actually run, step by step, on a map.
Step 1. Is the population growing here? — the 500 m mesh view
Population trends come first. But "Fukuoka City's population is growing" — a city-wide statement — is close to useless for a store-opening decision, because growing and shrinking areas sit side by side inside the same city.
MAPRISE's "Pop. Forecast (500m Mesh)" layer renders MLIT projection figures in 500-metre squares, colour-graded across eight bands of change rate (−50% to +50%). The forecast year switches in five-year steps from 2025 through 2070.
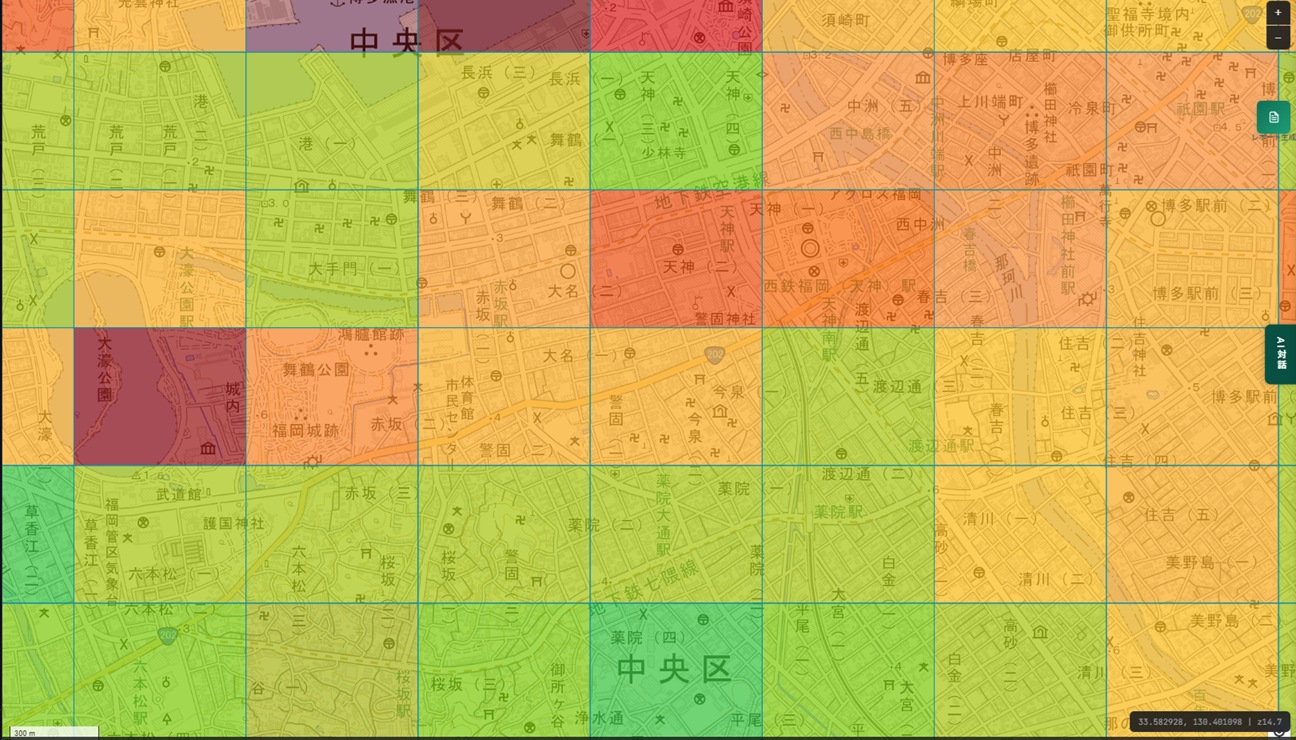
(The screenshots in this article show the Japanese interface. Every layer and control described here is also available in English — switch with the JP / EN toggle at the top left.)
Looking at the area around Tenjin, adjacent meshes diverge sharply. In the 2050 projection, a mesh sitting essentially flat at −0.2% can be immediately next to meshes at +14.8% and +17.3%.
This is precisely what the city-wide figure hides. Within one city, blocks that grow and blocks that don't are neighbours at a scale of a few hundred metres. Which side your candidate site falls on only becomes visible at this resolution.
Step 2. Turn the resolution up one more notch — the 250 m mesh
A 500-metre square already feels fine-grained, but there is another step available. The same layer group includes a "250m Mesh (High Resolution)" option, which cuts the area of each cell to a quarter.
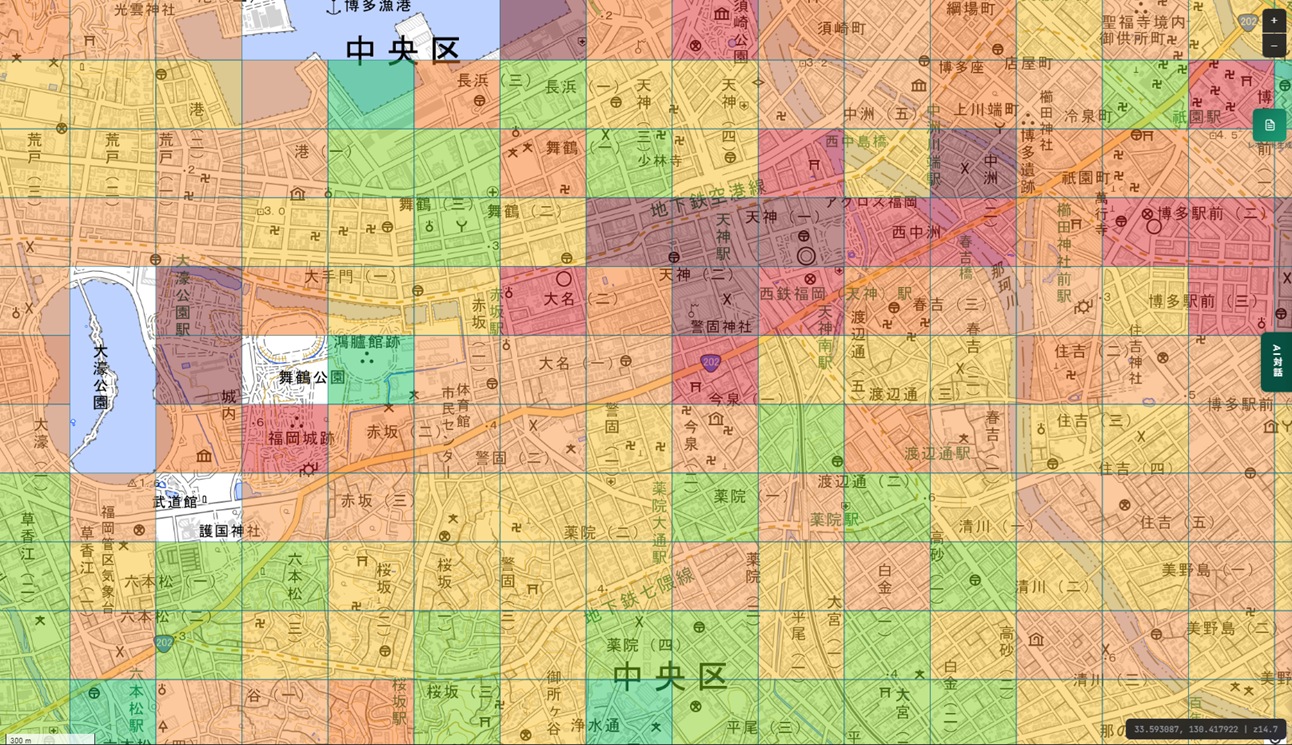
What happens when you switch? Areas that read as a single "growth zone" at 500 m break apart into growth and decline.
Over the same stretch around Tenjin, an area covered by 69 cells at 500 m resolution becomes 229 cells at 250 m. With roughly 3.3× the number of cells, the internal variation that the 500 m view had averaged away comes to the surface. One 500 m square can contain both a rising corner and a sinking one.
Store-opening decisions are usually made at a scale smaller than 500 metres square. "East side of the station or west?" "On the main road or one street back?" — a 500 m grid often cannot answer those. Raising the resolution is itself an analytical act.
One caveat: mesh statistics are projections, and the finer you go, the more sensitive they are to estimation error. Rather than treating the 250 m figures as absolute, we find it more practical to ask whether the trend seen at 500 m still holds when you zoom in.
Step 3. Weigh station pull against land price
Once the population picture is clear, the next question pairs "how many people gather here" with "what does this land cost."
MAPRISE carries a railway station layer with per-station passenger counts (2011–2023), which can be displayed on top of official land price survey points.
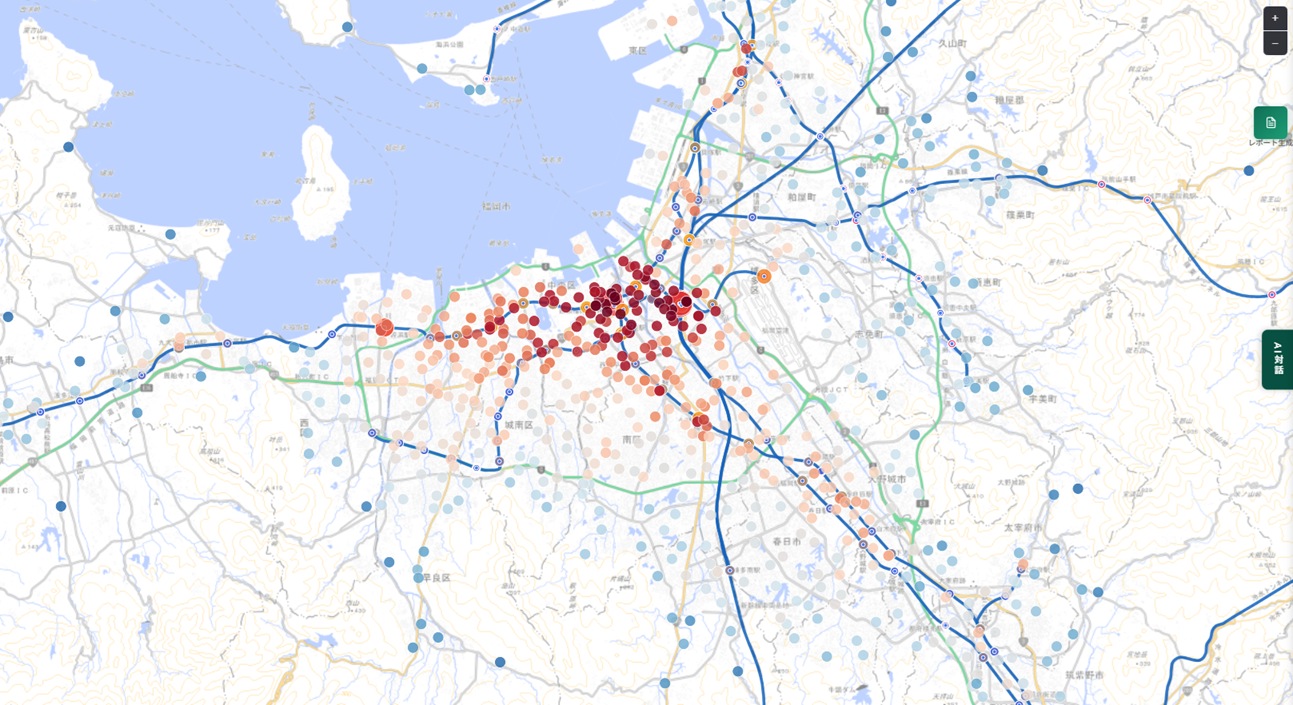
What this overlay is really for is finding stations where land is still cheap relative to the passenger volume.
Foot traffic scales roughly with passenger counts. Land prices, though, also move on other factors — zoning, whether redevelopment is underway, recent transaction history nearby. Where those two diverge — people gather but land is still inexpensive — you get a candidate site where rent burden and revenue outlook are easier to balance.
The reverse also shows up: stations where passenger growth has flattened but land prices have run ahead anyway. That is a market that has already priced things in, and it tends to disadvantage whoever arrives later.
Neither judgment is easy to reach when stations and land prices live in separate tools. They surface when you put both on the same screen.
Step 4. Close out the risk side
With the feasibility picture in place, the last pass is on downside risk. This doesn't need to be exhaustive — a look at hazards and zoning is usually enough.
- Flooding and landslides: multi-stage inundation projections and embankment regulation zones can be layered on. See our write-ups on the multi-stage flood simulation layer and on embankment regulation zones and large-scale fill land
- Earthquakes: this goes as far as per-building collapse-probability scoring (how we validated it against observed damage)
- Zoning and building regulation: for some business types, certain use districts rule the site out entirely. Worth checking alongside building- and floor-area ratios while you are still narrowing candidates
Candidates dropping out at this stage is not unusual. But leading with risk research before you have any read on feasibility is a poor allocation of effort. Feasibility first, then risk is the order we'd recommend.
In closing — this is what a bank does in a loan review
Line up these steps and nothing about them is exotic. Look at population trends, weigh foot traffic against land price, confirm there's no risk that would impair collateral value. In substance, this is what a financial institution does when underwriting a loan.
The difference is that these checks have traditionally lived in separate documents, handled by separate people, at separate times. Putting them on one screen changes how fast a decision can be made.
In MAPRISE, every layer above toggles on the same map. The PDF report feature also includes analysis items such as "Station & Land Price" and "Crime & Land Price," so some of what we compared by hand here can instead be produced automatically as report sections.
There is no single right answer in site selection. But you can check what is checkable before you commit — and the fact that the raw material is sitting there as open data is, we think, one of the more interesting things about Japan right now.
Disclaimer
The data and analysis in this article are reference information derived from public statistics. Population projections are estimates and do not guarantee actual demographic outcomes. For decisions on store openings, investment, or similar commitments, please consult a qualified professional and make your own determination.
Sources
- Population projections (500 m / 250 m mesh): MLIT National Land Numerical Information
- Official land price survey / prefectural land price survey: MLIT
- Railway stations and per-station passenger counts: MLIT National Land Numerical Information
Tags: #Site selection #Feasibility #Population forecast #Mesh statistics #Fukuoka City
Other-language share text (exception cases)
Quick share above follows our platform-locked language policy (X-family in Japanese, LinkedIn in English). The four panes below let you grab the opposite-language body when needed — e.g. introducing an English post to a Japanese audience on X, or posting a Japanese article to LinkedIn in Japanese. Each pane offers both a copy button and a direct intent link.
📝 その立地で商売は成り立つか ― 福岡を例に、データで事業性を評価してみる
「日本進出」で検索すると、出てくるのは商習慣の解説と東京の話ばかりです。でも出店や進出の成否を分けるのは、もっと手前にある「その場所で商売が成り立つか」という判断です。福岡を例に、500mメッシュの将来人口推計・250mへの解像度切替・駅の乗降客数と地価の重ね合わせという3ステップで、立地の事業性を実際に確かめてみました。
https://maprise.jp/ja/blog/site-selection-fukuoka/ #立地評価 #事業性評価
🆕 新しいブログ記事を公開しました。

《その立地で商売は成り立つか ― 福岡を例に、データで事業性を評価してみる》

「日本進出」で検索すると、出てくるのは商習慣の解説と東京の話ばかりです。でも出店や進出の成否を分けるのは、もっと手前にある「その場所で商売が成り立つか」という判断です。福岡を例に、500mメッシュの将来人口推計・250mへの解像度切替・駅の乗降客数と地価の重ね合わせという3ステップで、立地の事業性を実際に確かめてみました。

👉 詳しくはこちら: https://maprise.jp/ja/blog/site-selection-fukuoka/
📝 Site Selection in Japan, Done With Data: How We'd Evaluate a Business Location in Fukuoka
Search for "Japan market entry" and you get business-etiquette explainers and articles about Tokyo. But what actually decides wheth…
https://maprise.jp/en/blog/site-selection-fukuoka/ #Siteselection #Feasibility
🆕 New on the MAPRISE blog.

《Site Selection in Japan, Done With Data: How We'd Evaluate a Business Location in Fukuoka》

Search for "Japan market entry" and you get business-etiquette explainers and articles about Tokyo. But what actually decides whether a store or a branch works is a question that comes earlier: can a business survive in this specific spot? Using Fukuoka as the example, we walk through an actual location feasibility check in three steps — 500 m mesh population projections, switching to 250 m resolution, and overlaying station passenger counts with land prices.

👉 Read the full post: https://maprise.jp/en/blog/site-selection-fukuoka/

#Siteselection #Feasibility #Populationforecast #Meshstatistics #FukuokaCity